Estimated zip code population in 2022: 49,781 Zip code population in 2010: 49,341 Zip code population in 2000: 48,200
Houses and condos: 20,640 Renter-occupied apartments: 11,358
% of renters here:
58%
State:
44%
March 2022 cost of living index in zip code 92626: 88.6 (less than average, U.S. average is 100)
Land area: 9.6 sq. mi. Water area: 0.1 sq. mi.
Population density: 5,173 people per square mile
(average).
OSM Map
General Map
Google Map
MSN Map
OSM Map
General Map
Google Map
MSN Map
OSM Map
General Map
Google Map
MSN Map
OSM Map
General Map
Google Map
MSN Map
Please wait while loading the map...
Real estate property taxes paid for housing units in 2022:
This zip code:
0.6% ($6,495)
California:
0.7% ($4,831)
Median real estate property taxes paid for housing units with mortgages in 2022: $7,005 (0.7%) Median real estate property taxes paid for housing units with no mortgage in 2022: $4,768 (0.5%)
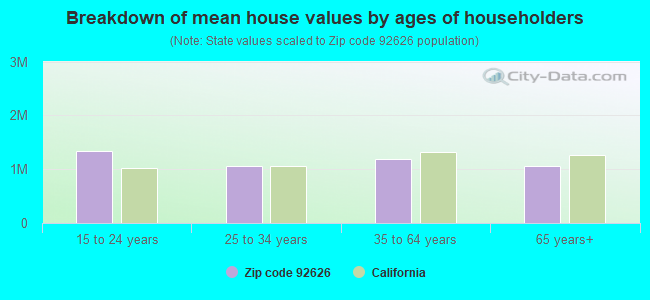
Estimated median house/condo value in 2022: $1,044,586
92626:
$1,044,586
California:
$715,900
According to our research of California and other state lists, there were 55 registered sex offenders living in 92626 zip code as of May 28, 2024. The ratio of all residents to sex offenders in zip code 92626 is 943 to 1. The ratio of registered sex offenders to all residents in this zip code is lower than the state average.
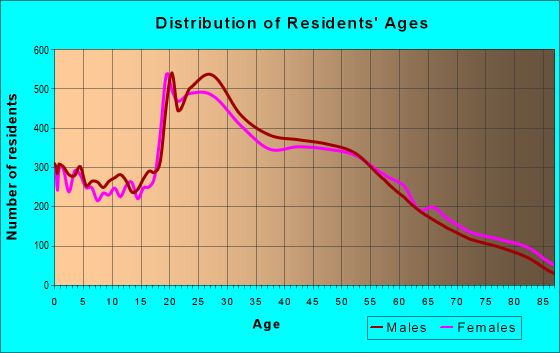
Median resident age:
This zip code:
37.8 years
California median age:
37.9 years
Average household size:
This zip code:
2.5 people
California:
2.8 people
Averages for the 2020 tax year for zip code 92626, filed in 2021:
Average Adjusted Gross Income (AGI) in 2020: $93,524 (Individual Income Tax Returns)
Here:
$93,524
State:
$95,910
Salary/wage: $75,693 (reported on 80.6% of returns)
Here:
$75,693
State:
$77,331
(% of AGI for various income ranges: 1251.0% for AGIs below $25k, 4144.2% for AGIs $25k-50k, 7566.0% for AGIs $50k-75k, 11499.2% for AGIs $75k-100k, 21919.0% for AGIs $100k-200k, 86167.3% for AGIs over 200k)
Taxable interest for individuals: $2,285 (reported on 35.6% of returns)
This zip code:
$2,285
California:
$2,294
(% of AGI for various income ranges: 22.5% for AGIs below $25k, 36.1% for AGIs $25k-50k, 44.1% for AGIs $50k-75k, 95.9% for AGIs $75k-100k, 204.4% for AGIs $100k-200k, 1859.5% for AGIs over 200k)
Ordinary dividends: $9,101 (reported on 23.1% of returns)
Here:
$9,101
State:
$10,949
(% of AGI for various income ranges: 35.5% for AGIs below $25k, 53.1% for AGIs $25k-50k, 99.5% for AGIs $50k-75k, 198.9% for AGIs $75k-100k, 415.2% for AGIs $100k-200k, 5730.9% for AGIs over 200k)
Net capital gain/loss in AGI: +$28,755 (reported on 23.5% of returns)
Here:
+$28,755
State:
+$49,306
(% of AGI for various income ranges: 8.0% for AGIs below $25k, 47.4% for AGIs $25k-50k, 116.2% for AGIs $50k-75k, 224.2% for AGIs $75k-100k, 723.1% for AGIs $100k-200k, 23532.8% for AGIs over 200k)
Profit/loss from business: +$14,744 (reported on 20.9% of returns)
Here:
+$14,744
State:
+$15,671
(% of AGI for various income ranges: 231.0% for AGIs below $25k, 263.2% for AGIs $25k-50k, 309.0% for AGIs $50k-75k, 531.1% for AGIs $75k-100k, 917.3% for AGIs $100k-200k, 3899.4% for AGIs over 200k)
Taxable individual retirement arrangement distribution: $22,870 (reported on 7.3% of returns)
92626:
$22,870
California:
$23,505
(% of AGI for various income ranges: 45.7% for AGIs below $25k, 94.3% for AGIs $25k-50k, 173.6% for AGIs $50k-75k, 343.4% for AGIs $75k-100k, 692.6% for AGIs $100k-200k, 2178.9% for AGIs over 200k)
Self-employed (Keogh) retirement plans: $26,078 (reported on 0.9% of returns)
92626:
$26,078
California:
$30,163
(% of AGI for various income ranges: 21.5% for AGIs $50k-75k, 61.1% for AGIs $100k-200k, 655.9% for AGIs over 200k)
Total itemized deductions: $39,877 (reported on 17.2% of returns)
Here:
$39,877
State:
$39,517
(% of AGI for various income ranges: 113.5% for AGIs below $25k, 198.0% for AGIs $25k-50k, 472.1% for AGIs $50k-75k, 1029.9% for AGIs $75k-100k, 2595.0% for AGIs $100k-200k, 13103.1% for AGIs over 200k)
Charity contributions: $12,081 (reported on 14.7% of returns)
Here:
$12,081
State:
$12,598
(% of AGI for various income ranges: 5.7% for AGIs below $25k, 18.7% for AGIs $25k-50k, 56.9% for AGIs $50k-75k, 131.2% for AGIs $75k-100k, 394.7% for AGIs $100k-200k, 5218.8% for AGIs over 200k)
Taxes paid: $8,933 (reported on 17.2% of returns)
92626:
$8,933
State:
$8,807
(% of AGI for various income ranges: 24.1% for AGIs below $25k, 42.0% for AGIs $25k-50k, 125.7% for AGIs $50k-75k, 292.8% for AGIs $75k-100k, 750.4% for AGIs $100k-200k, 2175.2% for AGIs over 200k)
Earned income credit: $1,673 (reported on 9.7% of returns)
Here:
$1,673
State:
$2,074
(% of AGI for various income ranges: 60.1% for AGIs below $25k, 41.2% for AGIs $25k-50k, 0.5% for AGIs $50k-75k)
Percentage of individuals using paid preparers for their 2020 taxes: 92.8%
Here:
93%
State:
92%
(% for various income ranges: 91.1% for AGIs below $25k, 93.2% for AGIs $25k-50k, 93.1% for AGIs $50k-75k, 92.9% for AGIs $75k-100k, 93.9% for AGIs $100k-200k, 94.7% for AGIs over 200k)
Averages for the 2012 tax year for zip code 92626, filed in 2013:
Average Adjusted Gross Income (AGI) in 2012: $71,121 (Individual Income Tax Returns)
Here:
$71,121
State:
$72,726
Salary/wage: $58,282 (reported on 82.7% of returns)
Here:
$58,282
State:
$59,079
(% of AGI for various income ranges: 74.3% for AGIs below $25k, 82.2% for AGIs $25k-50k, 80.0% for AGIs $50k-75k, 77.6% for AGIs $75k-100k, 76.7% for AGIs $100k-200k, 43.3% for AGIs over 200k)
Taxable interest for individuals: $1,643 (reported on 36.8% of returns)
This zip code:
$1,643
California:
$2,146
(% of AGI for various income ranges: 1.1% for AGIs below $25k, 0.6% for AGIs $25k-50k, 0.6% for AGIs $50k-75k, 0.7% for AGIs $75k-100k, 0.7% for AGIs $100k-200k, 1.2% for AGIs over 200k)
Ordinary dividends: $5,902 (reported on 20.2% of returns)
Here:
$5,902
State:
$9,308
(% of AGI for various income ranges: 1.6% for AGIs below $25k, 0.9% for AGIs $25k-50k, 0.9% for AGIs $50k-75k, 1.4% for AGIs $75k-100k, 1.5% for AGIs $100k-200k, 2.7% for AGIs over 200k)
Net capital gain/loss in AGI: +$9,302 (reported on 18.3% of returns)
Here:
+$9,302
State:
+$30,460
(% of AGI for various income ranges: 0.2% for AGIs $50k-75k, 0.5% for AGIs $75k-100k, 1.0% for AGIs $100k-200k, 7.0% for AGIs over 200k)
Profit/loss from business: +$15,065 (reported on 19.9% of returns)
Here:
+$15,065
State:
+$17,064
(% of AGI for various income ranges: 12.9% for AGIs below $25k, 5.7% for AGIs $25k-50k, 4.3% for AGIs $50k-75k, 3.2% for AGIs $75k-100k, 4.0% for AGIs $100k-200k, 2.5% for AGIs over 200k)
Taxable individual retirement arrangement distribution: $17,622 (reported on 9.0% of returns)
92626:
$17,622
California:
$19,557
(% of AGI for various income ranges: 2.6% for AGIs below $25k, 2.2% for AGIs $25k-50k, 2.3% for AGIs $50k-75k, 2.6% for AGIs $75k-100k, 2.7% for AGIs $100k-200k, 1.5% for AGIs over 200k)
Self-employment retirement plans: $17,519 (reported on 0.9% of returns)
92626:
$17,519
California:
$24,530
(% of AGI for various income ranges: 0.3% for AGIs $50k-75k, 0.3% for AGIs $100k-200k, 0.4% for AGIs over 200k)
Total itemized deductions: $34,433 (26% of AGI, reported on 38.1% of returns)
Here:
$34,433
State:
$34,004
Here:
26.0% of AGI
State:
22.7% of AGI
(% of AGI for various income ranges: 13.6% for AGIs below $25k, 11.5% for AGIs $25k-50k, 14.3% for AGIs $50k-75k, 18.4% for AGIs $75k-100k, 19.7% for AGIs $100k-200k, 22.8% for AGIs over 200k)
Charity contributions: $4,085 (reported on 32.4% of returns)
Here:
$4,085
State:
$4,659
(% of AGI for various income ranges: 0.8% for AGIs below $25k, 1.1% for AGIs $25k-50k, 1.6% for AGIs $50k-75k, 2.0% for AGIs $75k-100k, 2.1% for AGIs $100k-200k, 2.2% for AGIs over 200k)
Taxes paid: $13,576 (reported on 38.0% of returns)
92626:
$13,576
State:
$14,448
(% of AGI for various income ranges: 2.5% for AGIs below $25k, 2.4% for AGIs $25k-50k, 4.1% for AGIs $50k-75k, 6.0% for AGIs $75k-100k, 7.8% for AGIs $100k-200k, 11.5% for AGIs over 200k)
Earned income credit: $1,758 (reported on 12.1% of returns)
Here:
$1,758
State:
$2,286
(% of AGI for various income ranges: 3.7% for AGIs below $25k, 0.7% for AGIs $25k-50k)
Percentage of individuals using paid preparers for their 2012 taxes: 62.1%
Here:
62%
State:
64%
(% for various income ranges: 59.2% for AGIs below $25k, 59.6% for AGIs $25k-50k, 59.4% for AGIs $50k-75k, 63.3% for AGIs $75k-100k, 69.5% for AGIs $100k-200k, 79.8% for AGIs over 200k)
Averages for the 2004 tax year for zip code 92626, filed in 2005:
Average Adjusted Gross Income (AGI) in 2004: $65,591 (Individual Income Tax Returns)
Here:
$65,591
State:
$58,600
Salary/wage: $50,167 (reported on 83.5% of returns)
Here:
$50,167
State:
$49,455
(% of AGI for various income ranges: 128.8% for AGIs below $10k, 76.9% for AGIs $10k-25k, 84.3% for AGIs $25k-50k, 80.5% for AGIs $50k-75k, 78.3% for AGIs $75k-100k, 48.6% for AGIs over 100k)
Taxable interest for individuals: $2,487 (reported on 47.3% of returns)
This zip code:
$2,487
California:
$2,365
(% of AGI for various income ranges: 7.5% for AGIs below $10k, 1.7% for AGIs $10k-25k, 1.2% for AGIs $25k-50k, 1.2% for AGIs $50k-75k, 1.3% for AGIs $75k-100k, 2.2% for AGIs over 100k)
Taxable dividends: $4,119 (reported on 24.7% of returns)
Here:
$4,119
State:
$4,746
(% of AGI for various income ranges: 5.0% for AGIs below $10k, 1.6% for AGIs $10k-25k, 0.8% for AGIs $25k-50k, 0.9% for AGIs $50k-75k, 1.2% for AGIs $75k-100k, 1.9% for AGIs over 100k)
Net capital gain/loss: +$19,620 (reported on 22.1% of returns)
Here:
+$19,620
State:
+$23,418
(% of AGI for various income ranges: -0.6% for AGIs below $10k, -0.0% for AGIs $10k-25k, 0.3% for AGIs $25k-50k, 0.6% for AGIs $50k-75k, 1.3% for AGIs $75k-100k, 11.8% for AGIs over 100k)
Profit/loss from business: +$15,576 (reported on 19.6% of returns)
Here:
+$15,576
State:
+$16,826
(% of AGI for various income ranges: 13.6% for AGIs below $10k, 9.9% for AGIs $10k-25k, 5.2% for AGIs $25k-50k, 5.2% for AGIs $50k-75k, 5.0% for AGIs $75k-100k, 3.6% for AGIs over 100k)
Profit/loss from farming: +$2,867 (reported on 0.1% of returns)
Here:
+$2,867
State:
-$7,562
IRA payment deduction: $3,388 (reported on 3.5% of returns)
92626:
$3,388
California:
$3,192
(% of AGI for various income ranges: 0.5% for AGIs below $10k, 0.2% for AGIs $10k-25k, 0.3% for AGIs $25k-50k, 0.2% for AGIs $50k-75k, 0.2% for AGIs $75k-100k, 0.1% for AGIs over 100k)
Self-employed pension: $13,540 (reported on 1.5% of returns)
Here:
$13,540
California:
$17,688
(% of AGI for various income ranges: 0.2% for AGIs $10k-25k, 0.1% for AGIs $25k-50k, 0.3% for AGIs $50k-75k, 0.4% for AGIs $75k-100k, 0.4% for AGIs over 100k)
Total itemized deductions: $29,166 (24% of AGI, reported on 40.8% of returns)
Here:
$29,166
State:
$28,113
Here:
24.2% of AGI
State:
25.3% of AGI
(% of AGI for various income ranges: 29.5% for AGIs below $10k, 13.8% for AGIs $10k-25k, 14.8% for AGIs $25k-50k, 18.7% for AGIs $50k-75k, 22.4% for AGIs $75k-100k, 18.3% for AGIs over 100k)
Charity contributions deductions: $4,073 (3% of AGI, reported on 36.3% of returns)
Here:
$4,073
State:
$3,923
Here:
3.3% of AGI
State:
3.3% of AGI
(% of AGI for various income ranges: 1.2% for AGIs below $10k, 1.1% for AGIs $10k-25k, 1.7% for AGIs $25k-50k, 2.2% for AGIs $50k-75k, 2.7% for AGIs $75k-100k, 2.5% for AGIs over 100k)
Total tax: $11,921 (reported on 81.1% of returns)
92626:
$11,921
State:
$10,761
(% of AGI for various income ranges: 5.9% for AGIs below $10k, 5.1% for AGIs $10k-25k, 8.1% for AGIs $25k-50k, 10.3% for AGIs $50k-75k, 10.9% for AGIs $75k-100k, 19.6% for AGIs over 100k)
Earned income credit: $1,391 (reported on 9.2% of returns)
Here:
$1,391
State:
$1,763
Percentage of individuals using paid preparers for their 2004 taxes: 62.4%
Here:
62%
State:
66%
(% for various income ranges: 51.5% for AGIs below $10k, 61.9% for AGIs $10k-25k, 59.7% for AGIs $25k-50k, 64.2% for AGIs $50k-75k, 68.0% for AGIs $75k-100k, 75.3% for AGIs over 100k)
Likely homosexual households (counted as self-reported same-sex unmarried-partner households)
Lesbian couples: 0.2% of all households
Gay men: 0.3% of all households
Household received Food Stamps/SNAP in the past 12 months: 1,621 Household did not receive Food Stamps/SNAP in the past 12 months: 17,843
Women who had a birth in the past 12 months: 543 (507 now married, 33 unmarried) Women who did not have a birth in the past 12 months: 11,164 (4,421 now married, 6,743 unmarried)
Housing units in zip code 92626 with a mortgage: 6,261 (607 second mortgage, 552 both second mortgage and home equity loan) Houses without a mortgage: 76
Median monthly owner costs for units with a mortgage: $2,994 Median monthly owner costs for units without a mortgage: $781
Residents with income below the poverty level in 2022:
This zip code:
8.9%
Whole state:
12.2%
Residents with income below 50% of the poverty level in 2022:
This zip code:
4.8%
Whole state:
6.2%
Median number of rooms in houses and condos:
Here:
6.3
State:
6.0
Median number of rooms in apartments:
Here:
3.7
State:
3.9
Notable locations in this zip code not listed on our city pages
Notable locations in zip code 92626: Costa Mesa Golf Course (A), Mesa Verde Country Club (B), Mesa Verde Branch Orange County Public Library (C), Pacific Amphitheater (D), Fairview Developmental Center (E), Schaefer Ambulance Service (F), Costa Mesa Fire Department Station 6 (G), Orange County Fire Authority Station 33 (H), Costa Mesa Fire Department Station 5 (I), Costa Mesa Fire Department Station 4 (J), Costa Mesa Fire Department Station 2 (K), Costa Mesa Fire Department Station 1 (L). Display/hide their locations on the map
Shopping Centers: Stater Brothers Plaza Shopping Center (1), South Coast Plaza Shopping Center (2), Mesa Verde Shopping Center (3), Crystal Court Shopping Center (4), Harbor Shopping Center (5). Display/hide their locations on the map
Parks in zip code 92626 include: LeBard Stadium (1), Harbor Rest Memorial Park (2), Te Winkle Park (3), Orange County Fairgrounds (4), Wilson Street Park (5), Civic Center Park (6), Del Mesa Park (7), Gisler Park (8), Paularino Park (9). Display/hide their locations on the map
6,081 married couples with children.
1,648 single-parent households (471 men, 1,177 women).
64.1% of residents of 92626 zip code speak English at home.
20.3% of residents speak Spanish at home (67% very well, 16% well, 8% not well, 9% not at all).
4.4% of residents speak other Indo-European language at home (82% very well, 13% well, 4% not well).
10.0% of residents speak Asian or Pacific Island language at home (64% very well, 19% well, 14% not well, 3% not at all).
1.0% of residents speak other language at home (80% very well, 7% well, 13% not well).
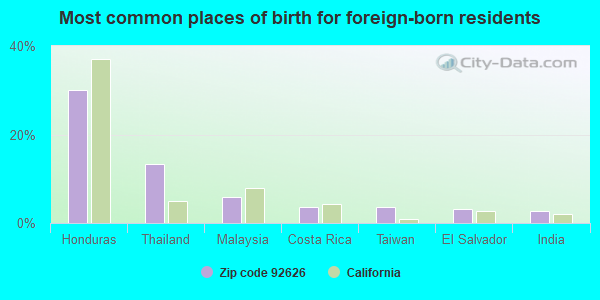
Foreign born population: 11,647 (23.4%) (56.6% of them are naturalized citizens)
Major facilities with environmental interests located in this zip code:
JIFFY LUBE (375 S BRISTOL STE 110 in COSTA MESA, CA)
STATE MASTER (California - Hazardous Waste Tracking) - HAZARDOU WASTE PROGRAM Small Quantity Generators, between 100 kg and 1000 kg of hazardous waste/month (Resource Conservation and Recovery Act (tracking hazardous waste)) - notification Small Quantity Generators, between 100 kg and 1000 kg of hazardous waste/month (Resource Conservation and Recovery Act (tracking hazardous waste)) - notification STATE MASTER (California - Used Oil Recycling System ) - USED OIL RECYCLING, USED OIL PROGRAM Business NAICS classification: ALL OTHER AUTOMOTIVE REPAIR AND MAINTENANCE. Organizations: ALLIED LUBE INC (CONTACT/OWNER)
, CARDINAL DEV CO (CONTACT/OWNER)
Alternative names: JIFFY LUBE NO 861, JIFFY LUBE #861
NABERS CADILLAC BUICK (2600 HARBOR BLVD in COSTA MESA, CA)
STATE MASTER (California - Hazardous Waste Tracking) - HAZARDOU WASTE PROGRAM Small Quantity Generators, between 100 kg and 1000 kg of hazardous waste/month (Resource Conservation and Recovery Act (tracking hazardous waste)) - notification STATE MASTER (California - Used Oil Recycling System ) - USED OIL RECYCLING Organizations: RICHARD NABERS (CONTACT/OWNER)
Alternative names: NABERS PONTIAC GMC BUICK CADILLAC
CERADYNE INCORPORATED (3169 REDHILL AVENUE in COSTA MESA, CA)
STATE MASTER (California - Hazardous Waste Tracking) - HAZARDOU WASTE PROGRAM CRITERIA AND HAZARDOUS AIR POLLUTANT INVENTORY (Inventory of air pollution sources) Large Quantity Generators, more that 1000 kg of hazardous waste/month (Resource Conservation and Recovery Act (tracking hazardous waste)) TRI REPORTER (Tracking of toxic chemicals releasing facilities) Business SIC classification: POTTERY PRODUCTS; ELECTROPLATING, PLATING, POLISHING, ANODIZING, AND COLORING; ELECTRON TUBES Business NAICS classification: ALL OTHER MISCELLANEOUS NONMETALLIC MINERAL PRODUCT MANUFACTURING.
ITT JABSCO (1485 DALE WAY in COSTA MESA, CA)
STATE MASTER (California - Hazardous Waste Tracking) - HAZARDOU WASTE PROGRAM Large Quantity Generators, more that 1000 kg of hazardous waste/month (Resource Conservation and Recovery Act (tracking hazardous waste)) TRI REPORTER (Tracking of toxic chemicals releasing facilities) Business SIC classification: PUMPS AND PUMPING EQUIPMENT Business NAICS classification: PUMP AND PUMPING EQUIPMENT MANUFACTURING. Organizations: JOHN W. MCCRAY (CONTACT/OWNER)
Alternative names: ITT INDS. JABSCO, ITT JABSCO PRODUCTS
EQUILON ENTERPRISES (1201 E BAKER/ FAIRVIEW in COSTA MESA, CA) . Federal Facility
STATE MASTER (California - Hazardous Waste Tracking) - HAZARDOU WASTE PROGRAM HAZARDOUS WASTE BIENNIAL REPORTER (Resource Conservation and Recovery Act (tracking hazardous waste)) Large Quantity Generators, more that 1000 kg of hazardous waste/month (Resource Conservation and Recovery Act (tracking hazardous waste)) Organizations: SHELL OIL PRODUCTS US (CONTACT/OPERATOR)
, EQUILON ENTERPRISES LLC DBA SHELL OIL PR (CONTACT/OWNER)
Alternative names: SHELL OIL CO
EXOTIC MATERIAL INC (2968 RANDOLPH AVE in COSTA MESA, CA)
(Integrated Compliance Information System) - ICIS-08-1990-0106, FORMAL ENFORCEMENT ACTION (Resource Conservation and Recovery Act (tracking hazardous waste)) Organizations: EXOTIC MATERIALS INC. (CONTACT/OWNER)
KYOWA AMERICA CORPORATION (385 CLINTON ST. in COSTA MESA, CA)
STATE MASTER (California - Hazardous Waste Tracking) - HAZARDOU WASTE PROGRAM CRITERIA AND HAZARDOUS AIR POLLUTANT INVENTORY (Inventory of air pollution sources) Small Quantity Generators, between 100 kg and 1000 kg of hazardous waste/month (Resource Conservation and Recovery Act (tracking hazardous waste)) - notification TRI REPORTER (Tracking of toxic chemicals releasing facilities) Business SIC classification: PLASTICS PRODUCTS Business NAICS classification: ALL OTHER PLASTICS PRODUCT MANUFACTURING.; HOUSEHOLD FURNITURE (EXCEPT WOOD AND METAL) MANUFACTURING. Organizations: SUMITO FURUYA (CONTACT/OWNER)
Alternative names: KYOWA OF AMERICA CORPORATION
GLOBAL CABLING SYSTEMS INC (1675 TORONTO WY in COSTA MESA, CA)
STATE MASTER (California - Hazardous Waste Tracking) - HAZARDOU WASTE PROGRAM Large Quantity Generators, more that 1000 kg of hazardous waste/month (Resource Conservation and Recovery Act (tracking hazardous waste)) - notification Organizations: HERBERT M AXENROTH (CONTACT/OWNER)
FAIRVIEW STATE HOSPITAL (2501 HARBOR BOULEVARD in COSTA MESA, CA)
AIR MAJOR (AIRS/AFS) STATE MASTER (California - Hazardous Waste Tracking) - HAZARDOU WASTE PROGRAM CRITERIA AND HAZARDOUS AIR POLLUTANT INVENTORY (Inventory of air pollution sources) Small Quantity Generators, between 100 kg and 1000 kg of hazardous waste/month (Resource Conservation and Recovery Act (tracking hazardous waste)) Business SIC classification: SKILLED NURSING CARE FACILITIES Alternative names: FAIRVIEW DEVELOPMENT CENTER, FAIRVIEW ST HOSP, FAIRVIEW STATE HOSPIPAL
CHEVRON STATION NO 91660 (3048 BRISTOL ST in COSTA MESA, CA)
Small Quantity Generators, between 100 kg and 1000 kg of hazardous waste/month (Resource Conservation and Recovery Act (tracking hazardous waste)) - notification STATE MASTER (California - Used Oil Recycling System ) - USED OIL RECYCLING Organizations: CHEVRON PRODUCTS CO (CONTACT/OWNER)
Alternative names: PLAZA CHEVRON SERVICE, PLAZA CHEVRON SERVICE CENTER
ADAMS ELEMENTARY SCHOOL (2850 CLUBHOUSE RD in COSTA MESA, CA)
(Geographic Names Information System) (National Center for Education Statistics) - STATE ID-6029227 Organizations: NEWPORT-MESA UNIFIED (SCHOOL DISTRICT)
FOOTE PHOTO CO (88 FAIR DR in COSTA MESA, CA)
STATE MASTER (California - Hazardous Waste Tracking) - HAZARDOU WASTE PROGRAM Small Quantity Generators, between 100 kg and 1000 kg of hazardous waste/month (Resource Conservation and Recovery Act (tracking hazardous waste)) - notification Organizations: ROBIN GRAY (CONTACT/OWNER)
EPE TECHNOLOGIES INCORPORATED (1660 SCENIC AVENUE in COSTA MESA, CA)
COMPLIANCE ACTIVITY (Tracking inspections of insecticide, fungicide, and rodenticide, and toxic substances) CRITERIA AND HAZARDOUS AIR POLLUTANT INVENTORY (Inventory of air pollution sources) HAZARDOUS WASTE BIENNIAL REPORTER (Resource Conservation and Recovery Act (tracking hazardous waste)) Large Quantity Generators, more that 1000 kg of hazardous waste/month (Resource Conservation and Recovery Act (tracking hazardous waste)) Business SIC classification: ELECTRONIC COILS, TRANSFORMERS, AND OTHER INDUCTORS; ELECTRONIC COMPONENTS Business NAICS classification: POWER, DISTRIBUTION, AND SPECIALTY TRANSFORMER MANUFACTURING. Organizations: MGE UPS SYSTEMS (CONTACT/OPERATOR)
Alternative names: EMERGENCY POWER ENGINEERING, MGE UPS SYSTEMS
Housing units lacking complete plumbing facilities: 0.3% Housing units lacking complete kitchen facilities: 1.1%
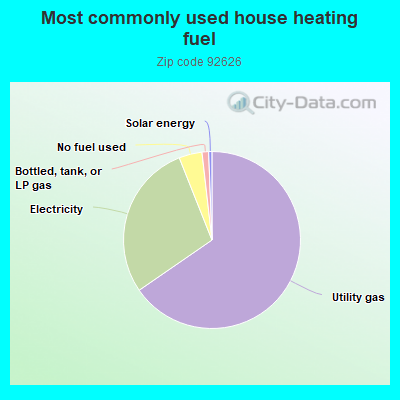
65.2%Utility gas
28.5%Electricity
4.2%No fuel used
1.2%Bottled, tank, or LP gas
0.6%Solar energy
Population in 1990: 45,411. Population change in the 1990s: +2,789 (+6.1%).
Place of birth for U.S.-born residents:
This state: 29,148
Northeast: 2,099
Midwest: 2,957
South: 1,804
West: 1,664
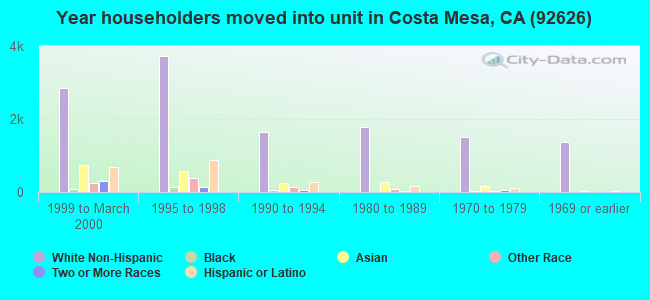
50% of the 92626 zip code residents lived in the same house 5 years ago. Out of people who lived in different houses, 67% lived in this county. Out of people who lived in different counties, 50% lived in California.
85% of the 92626 zip code residents lived in the same house 1 year ago. Out of people who lived in different houses, 60% moved from this county. Out of people who lived in different houses, 18% moved from different county within same state. Out of people who lived in different houses, 6% moved from different state. Out of people who lived in different houses, 14% moved from abroad.
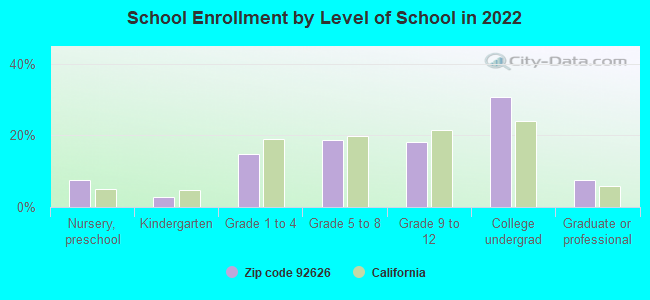
Private vs. public school enrollment:
Students in private schools in grades 1 to 8 (elementary and middle school): 731
Here:
19.9%
California:
10.5%
Students in private schools in grades 9 to 12 (high school): 302
Here:
15.4%
California:
8.5%
Students in private undergraduate colleges: 547
Here:
16.4%
California:
15.9%
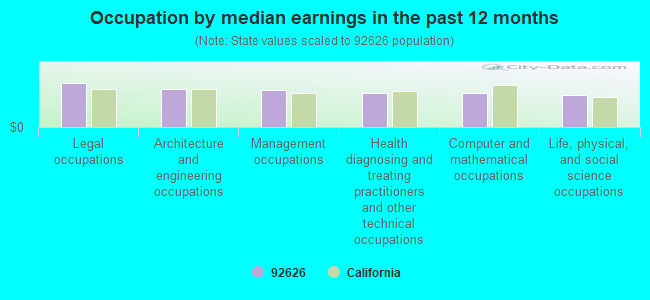
Occupation by median earnings in the past 12 months ($)
120,534Legal occupations
103,456Architecture and engineering occupations
100,830Management occupations
94,277Health diagnosing and treating practitioners and other technical occupations
91,903Computer and mathematical occupations
86,581Life, physical, and social science occupations
Companies with biggest federal contracts located in this zip code (COSTA MESA, CA):
CERADYNE INC (3169 RED HILL AVE; small business) : $625,921,877 in 294 contractsfrom 2000 to 2006
Contracts for Armor, Personal, Miscellaneous Ship and Marine Equipment, Individual Equipment, Miscellaneous Aircraft Accessories and Components, and moreby Army, Defense Logistics Agency, Department of Defense, U.S. Special Operations Command, and others Signed by year:2000: $13,225,987; 2001: $8,797,634; 2002: $21,938,891; 2003: $40,532,318; 2004: $162,505,302; 2005: $260,519,330; 2006: $118,402,415.
Biggest contracts:
$75,745,980 with Army for Armor, Personal. Signed on 2004-10-29. Completion date: 2005-02-28.
$75,478,456, same as above.Signed on 2005-06-27. Completion date: 2006-01-31.
$70,000,000, same as above.Signed on 2006-01-17. Completion date: 2006-06-30.
$60,067,208, same as above.Signed on 2005-11-07. Completion date: 2006-08-31.
IRVINE SENSORS CORPORATION (3001 REDHILL AVE BLDG 4-10; small business) : $49,874,419 in 113 contractsfrom 2000 to 2006
Contracts for Defense Electronics and Communication Equipment -- Advanced Development (R&D), Defense Electronics and Communication Equipment -- Applied Research and Exploratory Development (R&D), Other Defense -- Operational Systems Development (R&D), Other Defense -- Applied Research and Exploratory Development (R&D), and moreby Department of Defense, Air Force, Army, Navy, and others Signed by year:2000: $1,911,569; 2001: $2,919,222; 2002: $10,740,940; 2003: $8,728,865; 2004: $6,588,617; 2005: $12,973,313; 2006: $6,011,893.
Biggest contracts:
$6,512,545 with Department of Defense for Defense Electronics and Communication Equipment -- Advanced Development (R&D). Signed on 2005-03-07. Completion date: 2007-03-06.
$4,368,864 with Air Force for Defense Electronics and Communication Equipment -- Applied Research and Exploratory Development (R&D). Signed on 2006-05-09. Completion date: 2008-03-09.
$3,635,560 with Army for Other Defense -- Operational Systems Development (R&D). Signed on 2002-06-13. Completion date: 2003-05-20.
$2,749,000 with Department of Defense for Other Defense -- Applied Research and Exploratory Development (R&D). Signed on 2003-04-21. Completion date: 2004-06-26.
CLAYTON GROUP SERVICES, INC (1565 MACARTHUR BLVD) : $37,913,063 in 43 contractsfrom 2000 to 2006
Contracts for Other Professional Services, Water Quality Support Services, Hazardous Substance Removal, Cleanup, and Disposal Services and Operational Support, Waste Treatment and Storage, and moreby Army, Federal Technology Service, Air Force, Federal Supply Service, and others Signed by year:2000: $3,249,288; 2001: $2,242,742; 2002: $2,851,173; 2003: $2,675,433; 2004: $819,441; 2005: $13,807,866; 2006: $12,267,120.
Biggest contracts:
$11,889,287 with Army for Other Professional Services. Signed on 2006-02-22. Completion date: 2015-09-01.
$10,963,229, same as above.Signed on 2005-09-01. Completion date: 2015-09-01.
$2,196,177 with Army for Water Quality Support Services. Signed on 2005-04-01. Completion date: 2006-03-31.
$2,147,116 with Army for Hazardous Substance Removal, Cleanup, and Disposal Services and Operational Support. Signed on 2002-09-17. Completion date: 2004-09-29.
AMERICAN STATES UTILITY SERVIC (535 ANTON BLVD) : $13,878,809 in 4 contractsfrom 2004 to 2005
$7,000,000 with Defense Logistics Agency for Water Services. Signed on 2005-09-30. Completion date: 2005-09-30.
$3,998,338 with Defense Logistics Agency for Electric Services. Taking place in TX. Signed on 2004-06-22. Completion date: 2005-06-22.
$2,293,424 with Defense Logistics Agency for Water Services. Taking place in VA. Signed on 2005-09-29. Completion date: 2005-09-29.
$587,047, same as above.Signed on 2005-09-29. Completion date: 2005-09-29.
EATON CORPORATION (3184 PULLMAN STREET) : $11,275,104 in 237 contractsfrom 1999 to 2006
Contracts for Miscellaneous Power Transmission Equipment, Miscellaneous Aircraft Accessories and Components, Miscellaneous Ammunition, Combination and Miscellaneous Instruments, and moreby Air Force, Defense Logistics Agency, Navy, U.S. Coast Guard, and others Signed by year:2000: $717,942; 2001: $1,814,391; 2002: $2,058,023; 2003: $772,648; 2004: $2,470,072; 2005: $2,273,199; 2006: $1,079,465.
Biggest contracts:
$480,388 with Air Force for Miscellaneous Power Transmission Equipment. Signed on 2002-04-16. Completion date: 2003-02-28.
$395,120 with Air Force for Miscellaneous Aircraft Accessories and Components. Signed on 2001-04-19. Completion date: 2002-04-30.
$374,665 with Defense Logistics Agency for Miscellaneous Aircraft Accessories and Components. Signed on 2004-09-17. Completion date: 2005-09-18.
$322,449 with Navy for Miscellaneous Ammunition. Signed on 2002-09-30. Completion date: 2003-04-30.
MCA ENGINEERS INC (2960 AIRWAY AVE STE A103; small business) : $6,569,078 in 48 contractsfrom 1999 to 2006
Contracts for Facilities Operations Support Services, Automated Information System Design and Integration Services, Engineering and Technical Services, Maintenance, Repair and Rebuilding of Equipment -- Automatic Data Processing Equipment (Including Firmware), Software, Supplies and Support Equipment, and moreby Air Force, Navy Signed by year:2000: $715,075; 2001: $324,797; 2002: $295,153; 2003: $149,178; 2004: $2,283,987; 2005: $2,548,439; 2006: $39,234.
Biggest contracts:
$2,285,164 with Air Force for Facilities Operations Support Services. Signed on 2004-10-26. Completion date: 2004-12-31.
$2,141,342, same as above.Signed on 2005-02-01. Completion date: 2005-04-30.
$720,897, same as above.Signed on 2005-01-01. Completion date: 2005-01-31.
$101,670 with Navy for Automated Information System Design and Integration Services. Signed on 2001-03-22. Completion date: 2001-08-31.
US NIGHT VISION CORPORATION (3303 HARBOR BLVD STE E5; small business) : $6,267,538 in 13 contractsfrom 2002 to 2006
Contracts for Night Vision Equipment, Emitted and Reflected Radiation, Miscellaneous Items, Aircraft Ground Servicing Equipment, Individual Equipment, and moreby Army, Navy, Department of Defense Signed by year:2000: $0; 2001: $0; 2002: $198,990; 2003: $2,633,702; 2004: $232,113; 2005: $3,122,279; 2006: $80,454.
Biggest contracts:
$3,112,865 with Army for Night Vision Equipment, Emitted and Reflected Radiation. Signed on 2005-09-30. Completion date: 2006-05-28.
$2,163,294 with Army for Miscellaneous Items. Taking place in TX. Signed on 2003-09-06. Completion date: 2003-09-30.
$198,990 with Army for Night Vision Equipment, Emitted and Reflected Radiation. Signed on 2002-11-06. Completion date: 2003-02-14.
$198,000, same as above.Signed on 2003-01-17. Completion date: 2003-01-30.
ELECTRICAL MAINTENANCE CONTRAC (245 FISCHER AVENUE, SUITE) : $2,897,594 in 69 contractsfrom 1999 to 2002
Contracts for Relays and Solenoids, Electrical and Electronic Properties Measuring and Testing Instruments, Switches, Valves, Powered, and moreby Defense Logistics Agency, Navy Signed by year:2000: $585,385; 2001: $1,710,305; 2002: $571,130; 2003: $0; 2004: $0; 2005: $0; 2006: $0.
Biggest contracts:
$99,998 with Defense Logistics Agency for Relays and Solenoids. Signed on 2000-09-29. Completion date: 2001-09-29.
$99,960 with Defense Logistics Agency for Electrical and Electronic Properties Measuring and Testing Instruments. Taking place in VA. Signed on 2002-03-19. Completion date: 2002-05-21.
$98,437 with Defense Logistics Agency for Relays and Solenoids. Signed on 2001-09-17. Completion date: 2002-01-15.
$84,000 with Defense Logistics Agency for Switches. Signed on 2001-05-24. Completion date: 2001-10-01.
MIDAC CORPORATION (130 MCCORMICK AVE STE 111; small business) : $2,126,663 in 43 contractsfrom 2000 to 2006
Contracts for Laboratory Equipment and Supplies, Hazard-Detecting Instruments and Apparatus, Chemical Analysis Instruments, Pressure, Temperature, and Humidity Measuring and Controlling Instruments, and moreby Army, National Institute of Standards and Technology, U.S. Army Corps of Engineers - civil program financing only, Bureau of Alcohol, Tobacco, Firearms and Explosives, and others Signed by year:2000: $130,188; 2001: $291,679; 2002: $237,080; 2003: $481,018; 2004: $214,054; 2005: $502,278; 2006: $270,366.
Biggest contracts:
$204,198 with Army for Laboratory Equipment and Supplies. Signed on 2003-02-13. Completion date: 2003-04-22.
$182,000 with National Institute of Standards and Technology for Laboratory Equipment and Supplies. Signed on 2005-09-14. Completion date: 2006-10-29.
$178,920 with U.S. Army Corps of Engineers - civil program financing only for Hazard-Detecting Instruments and Apparatus. Taking place in LA. Signed on 2002-05-14. Completion date: 2002-09-30.
$126,516 with Army for Chemical Analysis Instruments. Signed on 2005-12-29. Completion date: 2006-03-30.
CARTER & BURGESS, INC (275 MCCORMICK STE B) : $1,528,367 in 8 contractsfrom 2003 to 2005
Contracts for Architect - Engineer Services (including landscaping, interior layout, and designing) by Army Signed by year:2000: $0; 2001: $0; 2002: $0; 2003: $1,387,523; 2004: $5,749; 2005: $135,095; 2006: $0.
Biggest contracts:
$736,881 with Army for Architect - Engineer Services (including landscaping, interior layout, and designing). Signed on 2003-12-17. Completion date: 2004-04-06.
$541,043, same as above.Signed on 2003-03-14. Completion date: 2003-06-24.
$119,378, same as above.Signed on 2005-06-23. Completion date: 2005-07-20.
$66,893, same as above.Signed on 2003-02-20. Completion date: 2003-02-21.
Top industries in this zip code by the number of employees in 2005:
Administrative and Support and Waste Management and Remediation Services: Temporary Help Services (250-499: 2, 100-249: 4, 50-99: 4, 20-49: 4, 10-19: 3, 5-9: 2, 1-4: 5)
Management of Companies and Enterprises: Corporate, Subsidiary, and Regional Managing Offices (250-499: 1, 100-249: 6, 50-99: 4, 20-49: 4, 10-19: 1, 5-9: 1, 1-4: 1)
Professional, Scientific, and Technical Services: Offices of Lawyers (100-249: 4, 50-99: 3, 20-49: 12, 10-19: 15, 5-9: 12, 1-4: 87)
Finance and Insurance: Direct Property and Casualty Insurance Carriers (over 1000: 1, 100-249: 1, 20-49: 1, 5-9: 4, 1-4: 2)
Administrative and Support and Waste Management and Remediation Services: All Other Travel Arrangement and Reservation Services (over 1000: 1, 50-99: 1, 20-49: 1, 10-19: 2, 1-4: 2)
People in group quarters in 2010:
715 people in college/university student housing
455 people in nursing facilities/skilled-nursing facilities
286 people in group homes intended for adults
70 people in residential treatment centers for adults
41 people in other noninstitutional facilities
36 people in group homes for juveniles (non-correctional)
12 people in residential treatment centers for juveniles (non-correctional)
4 people in workers' group living quarters and job corps centers
People in group quarters in 2000:
840 people in schools, hospitals, or wards for the intellectually disabled
695 people in college dormitories (includes college quarters off campus)
171 people in other noninstitutional group quarters
88 people in homes for the mentally retarded
60 people in homes or halfway houses for drug/alcohol abuse
25 people in nursing homes
22 people in local jails and other confinement facilities (including police lockups)
18 people in homes for the physically handicapped
8 people in religious group quarters
6 people in halfway houses
6 people in other group homes
Fatal accident statistics in 2014:
Fatal accident count: 3
Vehicles involved in fatal accidents: 5
Fatal accidents caused by drunken drivers: 2
Fatalities: 3
Persons involved in fatal accidents: 8
Pedestrians involved in fatal accidents: 0
Fatal accident statistics in 2013:
Fatal accident count: 8
Vehicles involved in fatal accidents: 10
Fatal accidents caused by drunken drivers: 3
Fatalities: 8
Persons involved in fatal accidents: 17
Pedestrians involved in fatal accidents: 0
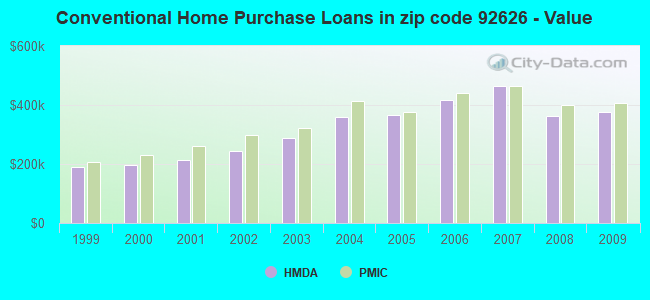
Home Mortgage Disclosure Act Aggregated Statistics For Year 2009 (Based on 14 full and 8 partial tracts)
A) FHA, FSA/RHS & VA Home Purchase Loans
B) Conventional Home Purchase Loans
C) Refinancings
D) Home Improvement Loans
E) Loans on Dwellings For 5+ Families
F) Non-occupant Loans on < 5 Family Dwellings (A B C & D)
G) Loans On Manufactured Home Dwelling (A B C & D)
Number
Average Value
Number
Average Value
Number
Average Value
Number
Average Value
Number
Average Value
Number
Average Value
Number
Average Value
LOANS ORIGINATED
136
$442,794
382
$376,303
1,546
$325,771
91
$233,766
1
$695,240
126
$324,358
0
$0
APPLICATIONS APPROVED, NOT ACCEPTED
9
$397,134
55
$390,664
172
$340,983
13
$148,683
0
$0
10
$300,622
0
$0
APPLICATIONS DENIED
42
$463,109
92
$357,444
408
$373,473
12
$184,152
0
$0
75
$330,142
5
$42,722
APPLICATIONS WITHDRAWN
38
$453,047
77
$385,073
291
$345,404
18
$267,056
0
$0
41
$308,444
0
$0
FILES CLOSED FOR INCOMPLETENESS
5
$433,026
11
$354,112
94
$355,266
1
$9,000
0
$0
3
$605,060
0
$0
Aggregated Statistics For Year 2008 (Based on 14 full and 8 partial tracts)
A) FHA, FSA/RHS & VA Home Purchase Loans
B) Conventional Home Purchase Loans
C) Refinancings
D) Home Improvement Loans
E) Loans on Dwellings For 5+ Families
F) Non-occupant Loans on < 5 Family Dwellings (A B C & D)
G) Loans On Manufactured Home Dwelling (A B C & D)
Number
Average Value
Number
Average Value
Number
Average Value
Number
Average Value
Number
Average Value
Number
Average Value
Number
Average Value
LOANS ORIGINATED
57
$450,177
521
$362,235
633
$329,283
86
$185,983
8
$6,909,079
133
$341,509
8
$53,786
APPLICATIONS APPROVED, NOT ACCEPTED
14
$476,723
91
$341,442
129
$363,886
14
$94,824
0
$0
31
$375,519
15
$58,225
APPLICATIONS DENIED
20
$443,598
181
$385,648
320
$418,404
51
$107,627
1
$876,610
62
$396,758
5
$62,518
APPLICATIONS WITHDRAWN
24
$426,009
88
$387,209
180
$361,944
21
$358,392
0
$0
26
$409,468
0
$0
FILES CLOSED FOR INCOMPLETENESS
2
$469,335
31
$381,127
62
$426,640
8
$193,028
0
$0
12
$394,311
0
$0
Aggregated Statistics For Year 2007 (Based on 14 full and 8 partial tracts)
A) FHA, FSA/RHS & VA Home Purchase Loans
B) Conventional Home Purchase Loans
C) Refinancings
D) Home Improvement Loans
E) Loans on Dwellings For 5+ Families
F) Non-occupant Loans on < 5 Family Dwellings (A B C & D)
G) Loans On Manufactured Home Dwelling (A B C & D)
Number
Average Value
Number
Average Value
Number
Average Value
Number
Average Value
Number
Average Value
Number
Average Value
Number
Average Value
LOANS ORIGINATED
0
$0
852
$465,961
1,154
$395,617
182
$271,495
8
$3,839,568
250
$471,772
6
$53,712
APPLICATIONS APPROVED, NOT ACCEPTED
0
$0
265
$501,859
250
$408,317
26
$281,828
0
$0
64
$555,017
11
$89,118
APPLICATIONS DENIED
1
$389,940
326
$438,754
680
$449,434
74
$216,537
1
$500,000
83
$422,727
16
$92,094
APPLICATIONS WITHDRAWN
1
$80,000
156
$459,329
285
$389,731
28
$227,505
1
$2,251,990
53
$446,789
0
$0
FILES CLOSED FOR INCOMPLETENESS
0
$0
21
$434,229
117
$433,891
8
$387,330
0
$0
7
$527,770
0
$0
Aggregated Statistics For Year 2006 (Based on 14 full and 8 partial tracts)
B) Conventional Home Purchase Loans
C) Refinancings
D) Home Improvement Loans
E) Loans on Dwellings For 5+ Families
F) Non-occupant Loans on < 5 Family Dwellings (A B C & D)
G) Loans On Manufactured Home Dwelling (A B C & D)
Number
Average Value
Number
Average Value
Number
Average Value
Number
Average Value
Number
Average Value
Number
Average Value
LOANS ORIGINATED
1,208
$417,081
1,780
$399,429
267
$253,602
11
$9,276,829
369
$430,034
6
$46,932
APPLICATIONS APPROVED, NOT ACCEPTED
229
$406,586
331
$385,072
47
$182,956
0
$0
65
$415,143
12
$99,003
APPLICATIONS DENIED
534
$415,577
689
$440,929
65
$260,640
0
$0
101
$454,810
10
$109,051
APPLICATIONS WITHDRAWN
375
$369,426
513
$397,148
48
$180,270
0
$0
96
$416,990
0
$0
FILES CLOSED FOR INCOMPLETENESS
60
$368,414
106
$416,763
8
$188,014
0
$0
14
$405,418
0
$0
Aggregated Statistics For Year 2005 (Based on 14 full and 8 partial tracts)
A) FHA, FSA/RHS & VA Home Purchase Loans
B) Conventional Home Purchase Loans
C) Refinancings
D) Home Improvement Loans
E) Loans on Dwellings For 5+ Families
F) Non-occupant Loans on < 5 Family Dwellings (A B C & D)
G) Loans On Manufactured Home Dwelling (A B C & D)
Number
Average Value
Number
Average Value
Number
Average Value
Number
Average Value
Number
Average Value
Number
Average Value
Number
Average Value
LOANS ORIGINATED
1
$295,000
1,540
$365,693
2,131
$378,691
279
$216,555
13
$4,092,048
366
$391,020
3
$62,970
APPLICATIONS APPROVED, NOT ACCEPTED
0
$0
345
$317,391
322
$378,794
46
$220,786
0
$0
74
$339,458
10
$63,634
APPLICATIONS DENIED
0
$0
448
$370,721
718
$380,386
115
$200,603
2
$1,125,000
94
$418,544
20
$84,090
APPLICATIONS WITHDRAWN
0
$0
338
$347,259
560
$349,284
96
$245,132
1
$13,712,400
61
$344,954
1
$42,000
FILES CLOSED FOR INCOMPLETENESS
0
$0
81
$341,876
242
$369,007
18
$118,798
0
$0
7
$450,406
0
$0
Aggregated Statistics For Year 2004 (Based on 14 full and 8 partial tracts)
A) FHA, FSA/RHS & VA Home Purchase Loans
B) Conventional Home Purchase Loans
C) Refinancings
D) Home Improvement Loans
E) Loans on Dwellings For 5+ Families
F) Non-occupant Loans on < 5 Family Dwellings (A B C & D)
G) Loans On Manufactured Home Dwelling (A B C & D)
Number
Average Value
Number
Average Value
Number
Average Value
Number
Average Value
Number
Average Value
Number
Average Value
Number
Average Value
LOANS ORIGINATED
0
$0
1,337
$359,878
2,668
$310,042
237
$250,470
8
$1,588,938
335
$338,935
3
$45,343
APPLICATIONS APPROVED, NOT ACCEPTED
0
$0
468
$347,526
435
$314,324
45
$138,939
2
$4,500,000
63
$268,089
4
$40,468
APPLICATIONS DENIED
3
$248,720
316
$333,183
635
$329,621
102
$149,504
1
$500,000
69
$345,451
12
$81,255
APPLICATIONS WITHDRAWN
0
$0
262
$333,732
545
$300,807
48
$171,459
1
$927,740
30
$307,401
4
$30,242
FILES CLOSED FOR INCOMPLETENESS
0
$0
85
$350,548
226
$327,461
9
$90,840
0
$0
21
$348,143
0
$0
Aggregated Statistics For Year 2003 (Based on 14 full and 8 partial tracts)
A) FHA, FSA/RHS & VA Home Purchase Loans
B) Conventional Home Purchase Loans
C) Refinancings
D) Home Improvement Loans
E) Loans on Dwellings For 5+ Families
F) Non-occupant Loans on < 5 Family Dwellings (A B C & D)
Number
Average Value
Number
Average Value
Number
Average Value
Number
Average Value
Number
Average Value
Number
Average Value
LOANS ORIGINATED
19
$246,853
1,171
$287,180
5,612
$245,203
96
$84,939
16
$1,661,463
522
$264,701
APPLICATIONS APPROVED, NOT ACCEPTED
1
$405,000
182
$259,745
701
$240,310
16
$95,524
0
$0
39
$262,281
APPLICATIONS DENIED
2
$250,850
266
$251,572
869
$266,765
65
$58,846
0
$0
70
$287,711
APPLICATIONS WITHDRAWN
1
$187,750
161
$265,705
806
$246,221
12
$161,372
0
$0
55
$268,186
FILES CLOSED FOR INCOMPLETENESS
2
$154,440
59
$401,232
217
$271,054
8
$61,128
1
$6,171,550
13
$668,825
Aggregated Statistics For Year 2002 (Based on 14 full and 8 partial tracts)
A) FHA, FSA/RHS & VA Home Purchase Loans
B) Conventional Home Purchase Loans
C) Refinancings
D) Home Improvement Loans
E) Loans on Dwellings For 5+ Families
F) Non-occupant Loans on < 5 Family Dwellings (A B C & D)
Number
Average Value
Number
Average Value
Number
Average Value
Number
Average Value
Number
Average Value
Number
Average Value
LOANS ORIGINATED
35
$192,070
1,183
$244,024
3,947
$227,612
68
$69,488
10
$1,068,271
294
$224,029
APPLICATIONS APPROVED, NOT ACCEPTED
4
$135,750
163
$261,755
637
$228,823
23
$53,048
1
$1,850,000
45
$202,257
APPLICATIONS DENIED
3
$213,667
187
$233,619
596
$214,874
34
$38,195
3
$2,597,430
53
$231,484
APPLICATIONS WITHDRAWN
7
$191,776
169
$237,804
608
$209,378
21
$41,256
1
$2,212,320
25
$208,142
FILES CLOSED FOR INCOMPLETENESS
3
$204,393
89
$243,554
260
$230,344
5
$40,264
1
$1,511,400
14
$160,582
Aggregated Statistics For Year 2001 (Based on 14 full and 8 partial tracts)
A) FHA, FSA/RHS & VA Home Purchase Loans
B) Conventional Home Purchase Loans
C) Refinancings
D) Home Improvement Loans
E) Loans on Dwellings For 5+ Families
F) Non-occupant Loans on < 5 Family Dwellings (A B C & D)
Number
Average Value
Number
Average Value
Number
Average Value
Number
Average Value
Number
Average Value
Number
Average Value
LOANS ORIGINATED
62
$204,674
1,087
$213,806
3,046
$211,270
114
$46,814
9
$1,612,024
220
$210,781
APPLICATIONS APPROVED, NOT ACCEPTED
5
$296,660
189
$232,470
474
$196,133
19
$44,203
1
$1,900,000
26
$178,703
APPLICATIONS DENIED
5
$216,562
198
$180,599
613
$205,436
72
$38,840
0
$0
51
$183,121
APPLICATIONS WITHDRAWN
8
$223,615
130
$198,865
739
$177,264
39
$41,902
0
$0
34
$173,898
FILES CLOSED FOR INCOMPLETENESS
0
$0
51
$214,821
268
$126,682
4
$25,775
2
$995,005
21
$120,655
Aggregated Statistics For Year 2000 (Based on 14 full and 8 partial tracts)
A) FHA, FSA/RHS & VA Home Purchase Loans
B) Conventional Home Purchase Loans
C) Refinancings
D) Home Improvement Loans
E) Loans on Dwellings For 5+ Families
F) Non-occupant Loans on < 5 Family Dwellings (A B C & D)
Number
Average Value
Number
Average Value
Number
Average Value
Number
Average Value
Number
Average Value
Number
Average Value
LOANS ORIGINATED
79
$166,454
1,106
$195,856
664
$170,445
101
$38,716
8
$8,788,314
119
$200,349
APPLICATIONS APPROVED, NOT ACCEPTED
6
$184,468
167
$206,156
138
$151,148
41
$37,678
0
$0
13
$163,472
APPLICATIONS DENIED
16
$160,730
311
$177,542
361
$162,626
48
$26,344
0
$0
32
$154,392
APPLICATIONS WITHDRAWN
9
$144,916
176
$170,971
194
$134,228
20
$15,907
0
$0
15
$172,661
FILES CLOSED FOR INCOMPLETENESS
8
$131,798
58
$181,927
54
$187,333
3
$20,717
0
$0
7
$171,907
Aggregated Statistics For Year 1999 (Based on 9 full and 4 partial tracts)
A) FHA, FSA/RHS & VA Home Purchase Loans
B) Conventional Home Purchase Loans
C) Refinancings
D) Home Improvement Loans
E) Loans on Dwellings For 5+ Families
F) Non-occupant Loans on < 5 Family Dwellings (A B C & D)
2005 - 2018 National Fire Incident Reporting System (NFIRS) incidents
Based on the data from the years 2005 - 2018 the average number of fires per year is 102. The highest number of fire incidents - 162 took place in 2016, and the least - 62 in 2012. The data has a decreasing trend.
When looking into fire subcategories, the most incidents belonged to: Structure Fires (36.0%), and Outside Fires (33.4%).
Fire incident types reported to NFIRS in Zip Code 92626


+$2,867
-$7,562
 Nearest zip codes: 92627, 92704, 92708, 92707, 92660, 92646.


 Based on the data from the years 2005 - 2018 the average number of fires per year is 102. The highest number of fire incidents - 162 took place in 2016, and the least - 62 in 2012. The data has a decreasing trend.
 When looking into fire subcategories, the most incidents belonged to: Structure Fires (36.0%), and Outside Fires (33.4%).