Estimated zip code population in 2022: 9,092 Zip code population in 2010: 9,741 Zip code population in 2000: 5,586
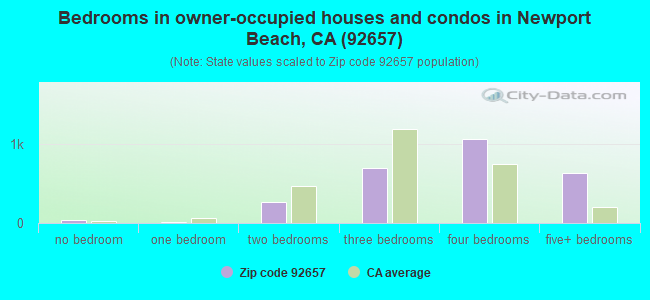
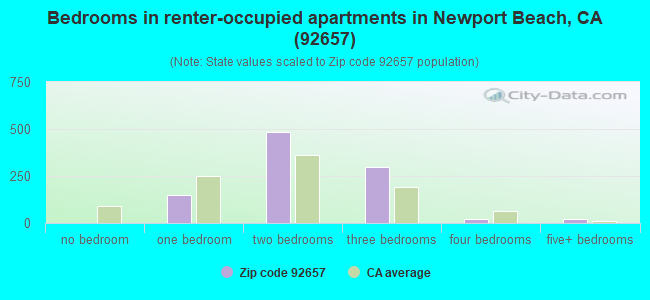
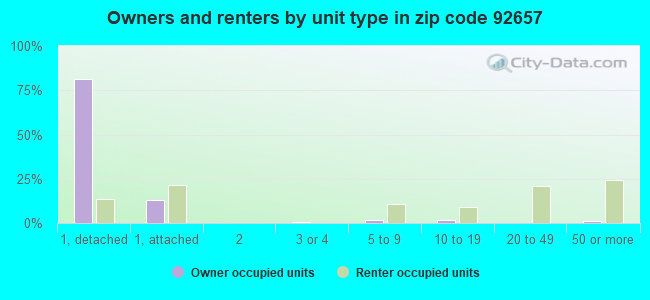
Houses and condos: 4,280 Renter-occupied apartments: 978
% of renters here:
27%
State:
44%
March 2022 cost of living index in zip code 92657: 90.3 (less than average, U.S. average is 100)
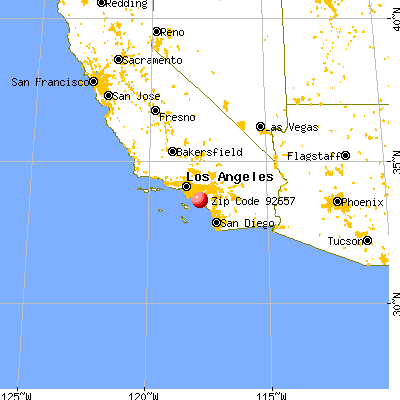
Land area: 7.4 sq. mi. Water area: 0.7 sq. mi.
Population density: 1,233 people per square mile
(low).
OSM Map
General Map
Google Map
MSN Map
OSM Map
General Map
Google Map
MSN Map
OSM Map
General Map
Google Map
MSN Map
OSM Map
General Map
Google Map
MSN Map
Please wait while loading the map...
Real estate property taxes paid for housing units in 2022:
This zip code:
0.5% ($10,292)
California:
0.7% ($4,831)
Median real estate property taxes paid for housing units with mortgages in 2022: $10,330 (0.5%) Median real estate property taxes paid for housing units with no mortgage in 2022: $10,572 (0.5%)
Business Search- 14 Million verified businesses
Males: 4,278
(47.0%)
Females: 4,814
(53.0%)
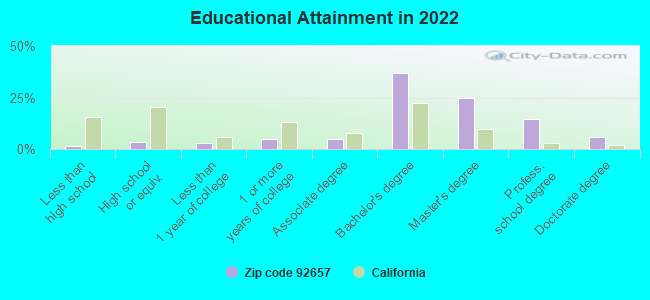
For population 25 years and over in 92657:
High school or higher: 100.8%
Bachelor's degree or higher: 84.5%
Graduate or professional degree: 46.9%
Unemployed: 0.7%
Mean travel time to work (commute): 25.8 minutes
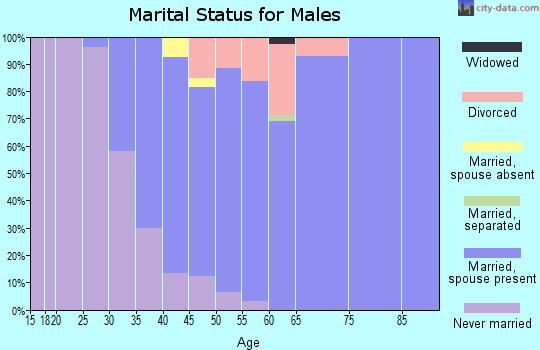
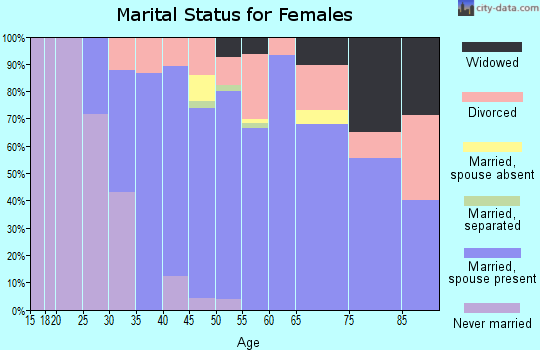
For population 15 years and over in 92657:
Never married: 21.3%
Now married: 60.5%
Separated: 0.0%
Widowed: 4.3%
Divorced: 13.8%
Zip code 92657 compared to state average:
Median household income above state average.
Median house value significantly above state average.
Unemployed percentage significantly below state average.
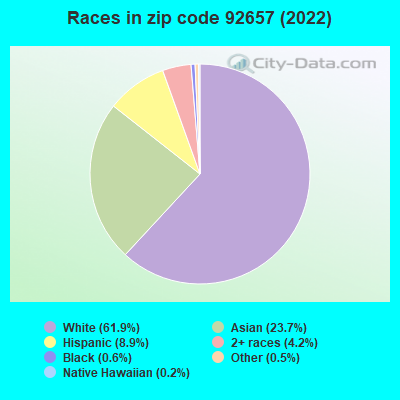
Black race population percentage significantly below state average.
Hispanic race population percentage significantly below state average.
Median age significantly above state average.
Renting percentage below state average.
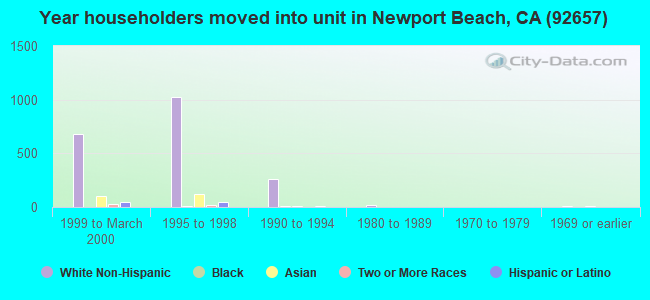
Length of stay since moving in above state average.
Number of rooms per house above state average.
House age significantly below state average.
Percentage of population with a bachelor's degree or higher significantly above state average.
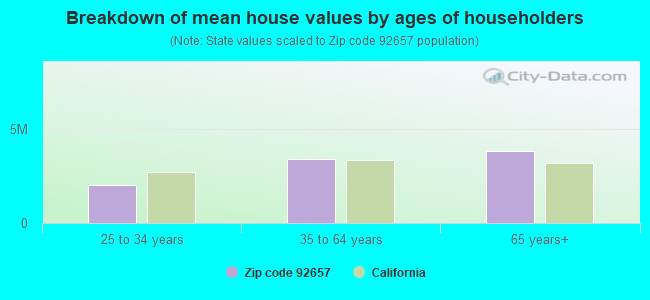
Estimated median house/condo value in 2022: $2,171,698
92657:
$2,171,698
California:
$715,900
According to our research of California and other state lists, there was 1 registered sex offender living in 92657 zip code as of May 28, 2024. The ratio of all residents to sex offenders in zip code 92657 is 9,908 to 1. The ratio of registered sex offenders to all residents in this zip code is much lower than the state average.
Median resident age:
This zip code:
48.0 years
California median age:
37.9 years
Average household size:
This zip code:
2.5 people
California:
2.8 people
Averages for the 2020 tax year for zip code 92657, filed in 2021:
Average Adjusted Gross Income (AGI) in 2020: $576,004 (Individual Income Tax Returns)
Here:
$576,004
State:
$95,910
Salary/wage: $251,242 (reported on 68.8% of returns)
Here:
$251,242
State:
$77,331
(% of AGI for various income ranges: 1637.5% for AGIs below $25k, 4600.0% for AGIs $25k-50k, 8630.6% for AGIs $50k-75k, 10919.2% for AGIs $75k-100k, 24320.0% for AGIs $100k-200k, 241135.7% for AGIs over 200k)
Taxable interest for individuals: $21,381 (reported on 64.9% of returns)
This zip code:
$21,381
California:
$2,294
(% of AGI for various income ranges: 155.2% for AGIs below $25k, 311.3% for AGIs $25k-50k, 685.0% for AGIs $50k-75k, 569.2% for AGIs $75k-100k, 1489.3% for AGIs $100k-200k, 19930.7% for AGIs over 200k)
Ordinary dividends: $53,419 (reported on 55.8% of returns)
Here:
$53,419
State:
$10,949
(% of AGI for various income ranges: 227.8% for AGIs below $25k, 339.6% for AGIs $25k-50k, 920.6% for AGIs $50k-75k, 1474.6% for AGIs $75k-100k, 2681.8% for AGIs $100k-200k, 43880.3% for AGIs over 200k)
Net capital gain/loss in AGI: +$253,211 (reported on 57.4% of returns)
Here:
+$253,211
State:
+$49,306
(% of AGI for various income ranges: 256.5% for AGIs below $25k, 604.3% for AGIs $25k-50k, 938.1% for AGIs $50k-75k, 2018.5% for AGIs $75k-100k, 3471.1% for AGIs $100k-200k, 229222.0% for AGIs over 200k)
Profit/loss from business: +$69,809 (reported on 23.6% of returns)
Here:
+$69,809
State:
+$15,671
(% of AGI for various income ranges: 385.8% for AGIs below $25k, 604.3% for AGIs $25k-50k, 1231.9% for AGIs $50k-75k, 817.7% for AGIs $75k-100k, 2101.4% for AGIs $100k-200k, 22577.0% for AGIs over 200k)
Taxable individual retirement arrangement distribution: $55,386 (reported on 10.1% of returns)
92657:
$55,386
California:
$23,505
(% of AGI for various income ranges: 77.0% for AGIs below $25k, 218.7% for AGIs $25k-50k, 438.8% for AGIs $50k-75k, 1008.5% for AGIs $75k-100k, 1916.1% for AGIs $100k-200k, 6316.7% for AGIs over 200k)
Self-employed (Keogh) retirement plans: $53,205 (reported on 4.5% of returns)
92657:
$53,205
California:
$30,163
(% of AGI for various income ranges: 368.9% for AGIs $100k-200k, 3557.3% for AGIs over 200k)
Total itemized deductions: $96,688 (reported on 39.5% of returns)
Here:
$96,688
State:
$39,517
(% of AGI for various income ranges: 424.5% for AGIs below $25k, 958.7% for AGIs $25k-50k, 1943.1% for AGIs $50k-75k, 2386.9% for AGIs $75k-100k, 4327.9% for AGIs $100k-200k, 54147.0% for AGIs over 200k)
Charity contributions: $38,940 (reported on 34.3% of returns)
Here:
$38,940
State:
$12,598
(% of AGI for various income ranges: 19.0% for AGIs below $25k, 69.1% for AGIs $25k-50k, 195.0% for AGIs $50k-75k, 293.8% for AGIs $75k-100k, 667.5% for AGIs $100k-200k, 20614.3% for AGIs over 200k)
Taxes paid: $9,505 (reported on 39.5% of returns)
92657:
$9,505
State:
$8,807
(% of AGI for various income ranges: 97.8% for AGIs below $25k, 194.8% for AGIs $25k-50k, 432.5% for AGIs $50k-75k, 535.4% for AGIs $75k-100k, 1100.4% for AGIs $100k-200k, 4282.0% for AGIs over 200k)
Earned income credit: $1,400 (reported on 3.5% of returns)
Here:
$1,400
State:
$2,074
(% of AGI for various income ranges: 43.5% for AGIs below $25k, 27.8% for AGIs $25k-50k)
Percentage of individuals using paid preparers for their 2020 taxes: 93.6%
Here:
94%
State:
92%
(% for various income ranges: 91.0% for AGIs below $25k, 91.5% for AGIs $25k-50k, 94.7% for AGIs $50k-75k, 93.3% for AGIs $75k-100k, 94.0% for AGIs $100k-200k, 95.2% for AGIs over 200k)
Averages for the 2012 tax year for zip code 92657, filed in 2013:
Average Adjusted Gross Income (AGI) in 2012: $622,627 (Individual Income Tax Returns)
Here:
$622,627
State:
$72,726
Salary/wage: $279,618 (reported on 73.7% of returns)
Here:
$279,618
State:
$59,079
(% of AGI for various income ranges: 79.4% for AGIs below $25k, 66.6% for AGIs $25k-50k, 63.3% for AGIs $50k-75k, 62.6% for AGIs $75k-100k, 62.3% for AGIs $100k-200k, 30.9% for AGIs over 200k)
Taxable interest for individuals: $32,106 (reported on 66.6% of returns)
This zip code:
$32,106
California:
$2,146
(% of AGI for various income ranges: 4.4% for AGIs below $25k, 2.3% for AGIs $25k-50k, 2.8% for AGIs $50k-75k, 2.4% for AGIs $75k-100k, 3.0% for AGIs $100k-200k, 3.5% for AGIs over 200k)
Ordinary dividends: $58,245 (reported on 53.1% of returns)
Here:
$58,245
State:
$9,308
(% of AGI for various income ranges: 9.1% for AGIs below $25k, 4.7% for AGIs $25k-50k, 6.3% for AGIs $50k-75k, 4.5% for AGIs $75k-100k, 5.3% for AGIs $100k-200k, 4.9% for AGIs over 200k)
Net capital gain/loss in AGI: +$328,983 (reported on 56.6% of returns)
Here:
+$328,983
State:
+$30,460
(% of AGI for various income ranges: 1.5% for AGIs below $25k, 2.4% for AGIs $25k-50k, 2.1% for AGIs $50k-75k, 1.9% for AGIs $75k-100k, 3.3% for AGIs $100k-200k, 31.9% for AGIs over 200k)
Profit/loss from business: +$56,314 (reported on 25.2% of returns)
Here:
+$56,314
State:
+$17,064
(% of AGI for various income ranges: 14.2% for AGIs below $25k, 9.7% for AGIs $25k-50k, 5.8% for AGIs $50k-75k, 10.5% for AGIs $75k-100k, 7.4% for AGIs $100k-200k, 1.9% for AGIs over 200k)
Taxable individual retirement arrangement distribution: $61,511 (reported on 11.9% of returns)
92657:
$61,511
California:
$19,557
(% of AGI for various income ranges: 3.8% for AGIs below $25k, 4.3% for AGIs $25k-50k, 3.9% for AGIs $50k-75k, 3.6% for AGIs $75k-100k, 5.3% for AGIs $100k-200k, 0.9% for AGIs over 200k)
Self-employment retirement plans: $42,948 (reported on 5.5% of returns)
92657:
$42,948
California:
$24,530
(% of AGI for various income ranges: 3.4% for AGIs below $25k, 0.9% for AGIs $100k-200k, 0.4% for AGIs over 200k)
Total itemized deductions: $157,294 (18% of AGI, reported on 69.5% of returns)
Here:
$157,294
State:
$34,004
Here:
17.8% of AGI
State:
22.7% of AGI
(% of AGI for various income ranges: 42.9% for AGIs below $25k, 30.3% for AGIs $25k-50k, 27.6% for AGIs $50k-75k, 28.5% for AGIs $75k-100k, 29.8% for AGIs $100k-200k, 16.6% for AGIs over 200k)
Charity contributions: $26,118 (reported on 59.3% of returns)
Here:
$26,118
State:
$4,659
(% of AGI for various income ranges: 1.6% for AGIs below $25k, 1.8% for AGIs $25k-50k, 2.6% for AGIs $50k-75k, 1.8% for AGIs $75k-100k, 2.3% for AGIs $100k-200k, 2.5% for AGIs over 200k)
Taxes paid: $95,115 (reported on 69.2% of returns)
92657:
$95,115
State:
$14,448
(% of AGI for various income ranges: 15.4% for AGIs below $25k, 11.2% for AGIs $25k-50k, 9.6% for AGIs $50k-75k, 11.4% for AGIs $75k-100k, 13.3% for AGIs $100k-200k, 10.4% for AGIs over 200k)
Earned income credit: $1,600 (reported on 3.8% of returns)
Here:
$1,600
State:
$2,286
(% of AGI for various income ranges: 2.4% for AGIs below $25k, 0.3% for AGIs $25k-50k)
Percentage of individuals using paid preparers for their 2012 taxes: 77.9%
Here:
78%
State:
64%
(% for various income ranges: 67.7% for AGIs below $25k, 71.1% for AGIs $25k-50k, 72.7% for AGIs $50k-75k, 75.9% for AGIs $75k-100k, 76.8% for AGIs $100k-200k, 87.4% for AGIs over 200k)
Averages for the 2004 tax year for zip code 92657, filed in 2005:
Average Adjusted Gross Income (AGI) in 2004: $388,600 (Individual Income Tax Returns)
Here:
$388,600
State:
$58,600
Salary/wage: $243,294 (reported on 73.9% of returns)
Here:
$243,294
State:
$49,455
(% of AGI for various income ranges: 69.0% for AGIs $10k-25k, 66.7% for AGIs $25k-50k, 63.9% for AGIs $50k-75k, 64.7% for AGIs $75k-100k, 43.7% for AGIs over 100k)
Taxable interest for individuals: $29,430 (reported on 73.5% of returns)
This zip code:
$29,430
California:
$2,365
(% of AGI for various income ranges: 7.7% for AGIs $10k-25k, 4.7% for AGIs $25k-50k, 3.4% for AGIs $50k-75k, 3.8% for AGIs $75k-100k, 5.1% for AGIs over 100k)
Taxable dividends: $16,491 (reported on 59.7% of returns)
Here:
$16,491
State:
$4,746
(% of AGI for various income ranges: 4.6% for AGIs $10k-25k, 4.4% for AGIs $25k-50k, 2.6% for AGIs $50k-75k, 3.8% for AGIs $75k-100k, 2.4% for AGIs over 100k)
Net capital gain/loss: +$139,789 (reported on 61.0% of returns)
Here:
+$139,789
State:
+$23,418
(% of AGI for various income ranges: 2.5% for AGIs $10k-25k, 2.3% for AGIs $25k-50k, 2.0% for AGIs $50k-75k, 1.4% for AGIs $75k-100k, 21.8% for AGIs over 100k)
Profit/loss from business: +$55,692 (reported on 24.6% of returns)
Here:
+$55,692
State:
+$16,826
(% of AGI for various income ranges: 12.2% for AGIs $10k-25k, 11.0% for AGIs $25k-50k, 13.2% for AGIs $50k-75k, 9.3% for AGIs $75k-100k, 3.0% for AGIs over 100k)
IRA payment deduction: $4,311 (reported on 4.2% of returns)
92657:
$4,311
California:
$3,192
(% of AGI for various income ranges: 0.6% for AGIs $10k-25k, 0.3% for AGIs $25k-50k, 0.2% for AGIs $50k-75k, 0.2% for AGIs $75k-100k, 0.0% for AGIs over 100k)
Self-employed pension: $32,890 (reported on 6.8% of returns)
Here:
$32,890
California:
$17,688
(% of AGI for various income ranges: 1.2% for AGIs $50k-75k, 0.7% for AGIs $75k-100k, 0.6% for AGIs over 100k)
Total itemized deductions: $101,549 (18% of AGI, reported on 69.2% of returns)
Here:
$101,549
State:
$28,113
Here:
17.8% of AGI
State:
25.3% of AGI
(% of AGI for various income ranges: 31.5% for AGIs $10k-25k, 33.9% for AGIs $25k-50k, 35.4% for AGIs $50k-75k, 36.1% for AGIs $75k-100k, 16.7% for AGIs over 100k)
Charity contributions deductions: $18,078 (3% of AGI, reported on 61.9% of returns)
Here:
$18,078
State:
$3,923
Here:
3.0% of AGI
State:
3.3% of AGI
(% of AGI for various income ranges: 1.7% for AGIs $10k-25k, 2.3% for AGIs $25k-50k, 3.0% for AGIs $50k-75k, 2.5% for AGIs $75k-100k, 2.8% for AGIs over 100k)
Total tax: $109,424 (reported on 84.9% of returns)
92657:
$109,424
State:
$10,761
(% of AGI for various income ranges: 7.2% for AGIs $10k-25k, 8.6% for AGIs $25k-50k, 11.2% for AGIs $50k-75k, 11.1% for AGIs $75k-100k, 23.6% for AGIs over 100k)
Earned income credit: $960 (reported on 2.3% of returns)
Here:
$960
State:
$1,763
Percentage of individuals using paid preparers for their 2004 taxes: 80.0%
Here:
80%
State:
66%
(% for various income ranges: 74.3% for AGIs below $10k, 74.5% for AGIs $10k-25k, 75.8% for AGIs $25k-50k, 72.3% for AGIs $50k-75k, 77.4% for AGIs $75k-100k, 85.3% for AGIs over 100k)
Household received Food Stamps/SNAP in the past 12 months: 186 Household did not receive Food Stamps/SNAP in the past 12 months: 3,401
Women who had a birth in the past 12 months: 64 (63 now married, 0 unmarried) Women who did not have a birth in the past 12 months: 1,784 (826 now married, 953 unmarried)
Housing units in zip code 92657 with a mortgage: 1,695 (291 second mortgage, 274 both second mortgage and home equity loan) Median monthly owner costs for units with a mortgage: $3,876 Median monthly owner costs for units without a mortgage: $1,556
Residents with income below the poverty level in 2022:
This zip code:
6.2%
Whole state:
12.2%
Residents with income below 50% of the poverty level in 2022:
This zip code:
1.6%
Whole state:
6.2%
Median number of rooms in houses and condos:
Here:
7.2
State:
6.0
Median number of rooms in apartments:
Here:
4.5
State:
3.9
Notable locations in this zip code not listed on our city pages
Size of family households: 1,097 2-persons, 855 3-persons, 436 4-persons, 192 5-persons, 26 6-persons, 12 7-or-more-persons
Size of nonfamily households: 758 1-person, 274 2-persons
1,748 married couples with children.
318 single-parent households (75 men, 243 women).
65.9% of residents of 92657 zip code speak English at home.
2.4% of residents speak Spanish at home (94% very well, 6% not well).
17.0% of residents speak other Indo-European language at home (92% very well, 8% well, 1% not at all).
15.3% of residents speak Asian or Pacific Island language at home (60% very well, 26% well, 14% not well).
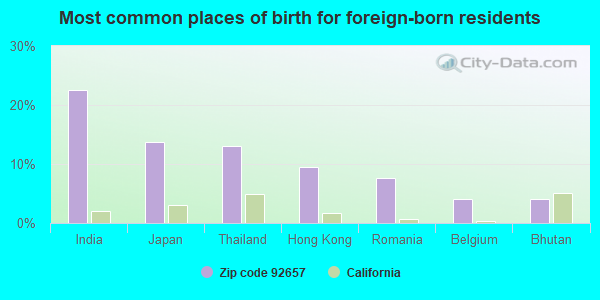
Foreign born population: 2,668 (29.3%) (73.4% of them are naturalized citizens)
This zip code:
29.3%
Whole state:
26.7%
22%India
14%Japan
13%Thailand
9%Hong Kong
8%Romania
4%Belgium
4%Bhutan
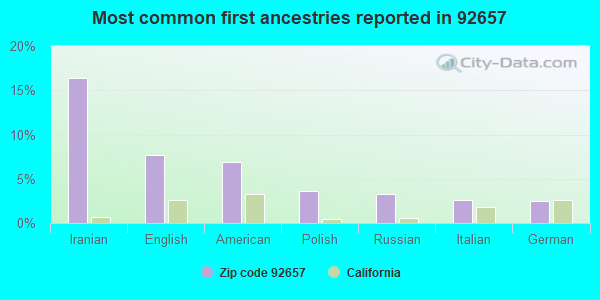
16%Iranian
8%English
7%American
4%Polish
3%Russian
3%Italian
3%German
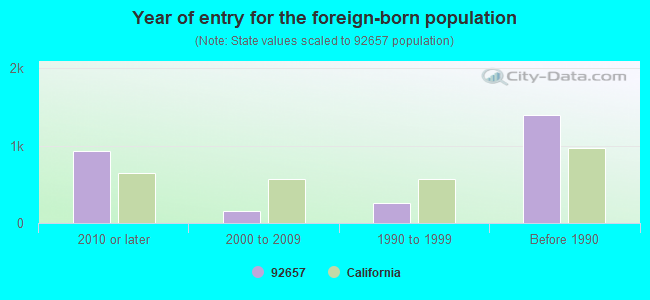
Year of entry for the foreign-born population
9372010 or later
1582000 to 2009
2631990 to 1999
1,398Before 1990
Facilities with environmental interests located in this zip code:
NEWPORT COAST ELEMENTARY (6655 RIDGE PARK RD. in NEWPORT BEACH, CA)
(National Center for Education Statistics) - STATE ID-6118236 Organizations: NEWPORT-MESA UNIFIED (SCHOOL DISTRICT)
NORTHCOTT WILLIAMS INC (400 PARK NEWPORT #203 in NEWPORT BEACH, CA)
Small Quantity Generators, between 100 kg and 1000 kg of hazardous waste/month (Resource Conservation and Recovery Act (tracking hazardous waste)) - notification Organizations: DOUGLAS WILLIAMS (CONTACT/OWNER)
NEWPORT TERRACE LF / NEWPORT CITY DUMP #1 (W 9TH ST DEAD END in NEWPORT BEACH, CA)
CRITERIA AND HAZARDOUS AIR POLLUTANT INVENTORY (Inventory of air pollution sources) Business SIC classification: REFUSE SYSTEMS Business NAICS classification: SOLID WASTE LANDFILL.; SOLID WASTE LANDFILL.
NEWPORT BEACH CITY UTILITIES (5800 WEST COAST HIGHWAY in NEWPORT BEACH, CA)
CRITERIA AND HAZARDOUS AIR POLLUTANT INVENTORY (Inventory of air pollution sources) Business SIC classification: CRUDE PETROLEUM AND NATURAL GAS Alternative names: NEWPORT BEACH CITY, CITY YARD
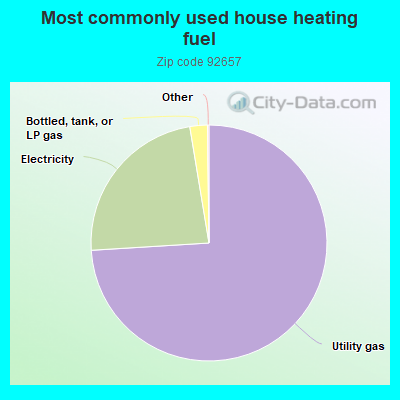
74.1%Utility gas
23.4%Electricity
2.4%Bottled, tank, or LP gas
Population in 1990: 8,254.
Place of birth for U.S.-born residents:
This state: 3,946
Northeast: 940
Midwest: 688
South: 413
West: 352
23% of the 92657 zip code residents lived in the same house 5 years ago. Out of people who lived in different houses, 63% lived in this county. Out of people who lived in different counties, 50% lived in California.
92% of the 92657 zip code residents lived in the same house 1 year ago. Out of people who lived in different houses, 43% moved from this county. Out of people who lived in different houses, 5% moved from different county within same state. Out of people who lived in different houses, 56% moved from different state.
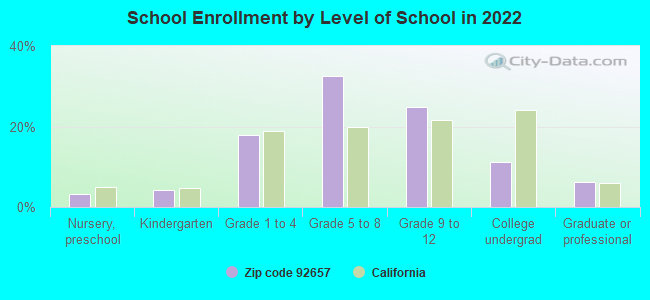
Private vs. public school enrollment:
Students in private schools in grades 1 to 8 (elementary and middle school): 364
Here:
33.4%
California:
10.5%
Students in private schools in grades 9 to 12 (high school): 283
Here:
53.8%
California:
8.5%
Students in private undergraduate colleges: 68
Here:
29.0%
California:
15.9%
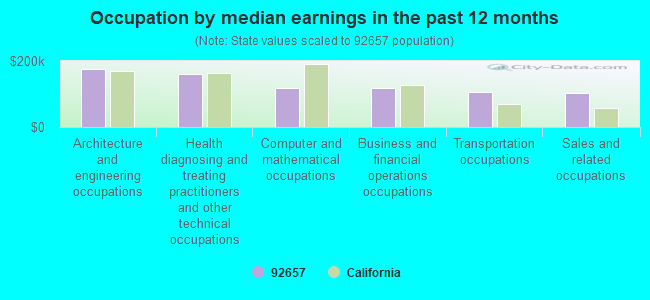
Occupation by median earnings in the past 12 months ($)
176,560Architecture and engineering occupations
161,143Health diagnosing and treating practitioners and other technical occupations
118,422Computer and mathematical occupations
116,748Business and financial operations occupations
105,472Transportation occupations
101,650Sales and related occupations
Top industries in this zip code by the number of employees in 2005:
Management of Companies and Enterprises: Corporate, Subsidiary, and Regional Managing Offices (100-249 employees: 2 establishments, 1-4 employees: 1 establishment)
2005 - 2018 National Fire Incident Reporting System (NFIRS) incidents
Based on the data from the years 2005 - 2018 the average number of fires per year is 7. The highest number of fires - 16 took place in 2006, and the least - 0 in 2008. The data has a growing trend.
When looking into fire subcategories, the most incidents belonged to: Structure Fires (35.6%), and Mobile Property/Vehicle Fires (32.7%).
Fire incident types reported to NFIRS in Zip Code 92657


 Nearest zip codes: 92625, 92617, 92603, 92660, 92651, 92612.
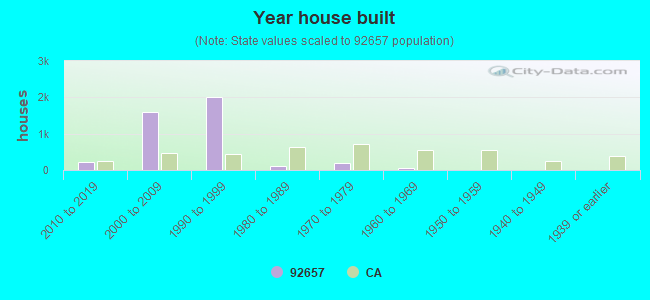


 Based on the data from the years 2005 - 2018 the average number of fires per year is 7. The highest number of fires - 16 took place in 2006, and the least - 0 in 2008. The data has a growing trend.
 When looking into fire subcategories, the most incidents belonged to: Structure Fires (35.6%), and Mobile Property/Vehicle Fires (32.7%).