Estimated zip code population in 2022: 36,126 Zip code population in 2010: 37,184 Zip code population in 2000: 37,900
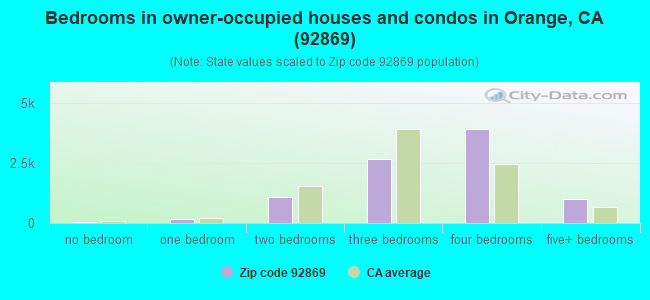
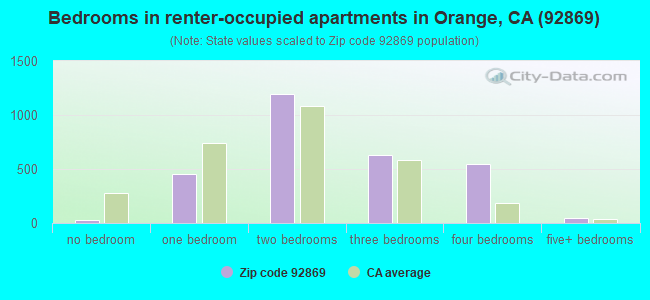
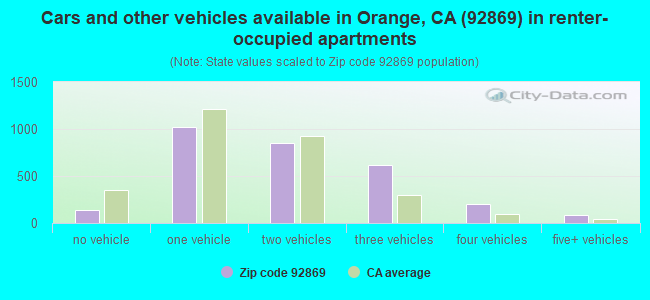
Houses and condos: 11,927 Renter-occupied apartments: 2,914
% of renters here:
25%
State:
44%
March 2022 cost of living index in zip code 92869: 86.8 (less than average, U.S. average is 100)
Land area: 9.3 sq. mi. Water area: 0.2 sq. mi.
Population density: 3,888 people per square mile
(average).
OSM Map
General Map
Google Map
MSN Map
OSM Map
General Map
Google Map
MSN Map
OSM Map
General Map
Google Map
MSN Map
OSM Map
General Map
Google Map
MSN Map
Please wait while loading the map...
Real estate property taxes paid for housing units in 2022:
This zip code:
0.6% ($6,173)
California:
0.7% ($4,831)
Median real estate property taxes paid for housing units with mortgages in 2022: $6,890 (0.7%) Median real estate property taxes paid for housing units with no mortgage in 2022: $4,956 (0.5%)
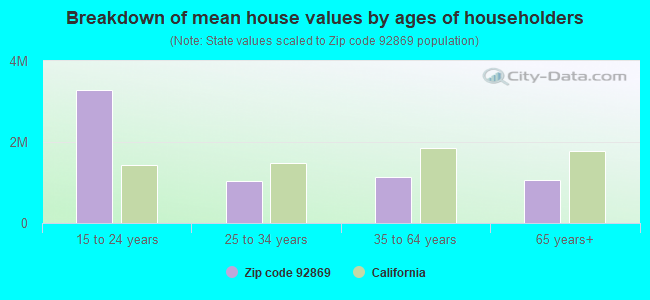
Estimated median house/condo value in 2022: $959,456
92869:
$959,456
California:
$715,900
According to our research of California and other state lists, there were 32 registered sex offenders living in 92869 zip code as of May 28, 2024. The ratio of all residents to sex offenders in zip code 92869 is 1,151 to 1. The ratio of registered sex offenders to all residents in this zip code is lower than the state average.
Median resident age:
This zip code:
41.8 years
California median age:
37.9 years
Average household size:
This zip code:
3.0 people
California:
2.8 people
Averages for the 2020 tax year for zip code 92869, filed in 2021:
Average Adjusted Gross Income (AGI) in 2020: $105,080 (Individual Income Tax Returns)
Here:
$105,080
State:
$95,910
Salary/wage: $83,131 (reported on 79.2% of returns)
Here:
$83,131
State:
$77,331
(% of AGI for various income ranges: 1240.8% for AGIs below $25k, 4167.7% for AGIs $25k-50k, 7440.8% for AGIs $50k-75k, 11133.3% for AGIs $75k-100k, 21136.6% for AGIs $100k-200k, 85084.5% for AGIs over 200k)
Taxable interest for individuals: $2,281 (reported on 44.8% of returns)
This zip code:
$2,281
California:
$2,294
(% of AGI for various income ranges: 27.8% for AGIs below $25k, 34.3% for AGIs $25k-50k, 59.3% for AGIs $50k-75k, 142.6% for AGIs $75k-100k, 217.8% for AGIs $100k-200k, 1915.0% for AGIs over 200k)
Ordinary dividends: $8,810 (reported on 25.5% of returns)
Here:
$8,810
State:
$10,949
(% of AGI for various income ranges: 37.2% for AGIs below $25k, 59.9% for AGIs $25k-50k, 120.9% for AGIs $50k-75k, 222.5% for AGIs $75k-100k, 402.1% for AGIs $100k-200k, 4805.3% for AGIs over 200k)
Net capital gain/loss in AGI: +$22,254 (reported on 25.3% of returns)
Here:
+$22,254
State:
+$49,306
(% of AGI for various income ranges: 13.5% for AGIs below $25k, 76.4% for AGIs $25k-50k, 71.7% for AGIs $50k-75k, 259.6% for AGIs $75k-100k, 635.8% for AGIs $100k-200k, 14862.2% for AGIs over 200k)
Profit/loss from business: +$18,792 (reported on 20.1% of returns)
Here:
+$18,792
State:
+$15,671
(% of AGI for various income ranges: 227.8% for AGIs below $25k, 290.1% for AGIs $25k-50k, 366.3% for AGIs $50k-75k, 428.2% for AGIs $75k-100k, 887.1% for AGIs $100k-200k, 5310.7% for AGIs over 200k)
Taxable individual retirement arrangement distribution: $24,740 (reported on 9.1% of returns)
92869:
$24,740
California:
$23,505
(% of AGI for various income ranges: 51.8% for AGIs below $25k, 118.2% for AGIs $25k-50k, 250.2% for AGIs $50k-75k, 540.3% for AGIs $75k-100k, 818.5% for AGIs $100k-200k, 2460.0% for AGIs over 200k)
Self-employed (Keogh) retirement plans: $21,900 (reported on 1.3% of returns)
92869:
$21,900
California:
$30,163
(% of AGI for various income ranges: 24.4% for AGIs $50k-75k, 61.4% for AGIs $100k-200k, 625.0% for AGIs over 200k)
Total itemized deductions: $37,908 (reported on 24.6% of returns)
Here:
$37,908
State:
$39,517
(% of AGI for various income ranges: 149.9% for AGIs below $25k, 338.9% for AGIs $25k-50k, 852.0% for AGIs $50k-75k, 1597.5% for AGIs $75k-100k, 3426.5% for AGIs $100k-200k, 12405.5% for AGIs over 200k)
Charity contributions: $9,125 (reported on 21.2% of returns)
Here:
$9,125
State:
$12,598
(% of AGI for various income ranges: 6.4% for AGIs below $25k, 28.0% for AGIs $25k-50k, 93.2% for AGIs $50k-75k, 210.5% for AGIs $75k-100k, 506.4% for AGIs $100k-200k, 3869.7% for AGIs over 200k)
Taxes paid: $8,997 (reported on 24.6% of returns)
92869:
$8,997
State:
$8,807
(% of AGI for various income ranges: 26.8% for AGIs below $25k, 74.4% for AGIs $25k-50k, 226.6% for AGIs $50k-75k, 484.2% for AGIs $75k-100k, 974.2% for AGIs $100k-200k, 2294.8% for AGIs over 200k)
Earned income credit: $1,803 (reported on 9.5% of returns)
Here:
$1,803
State:
$2,074
(% of AGI for various income ranges: 65.5% for AGIs below $25k, 46.8% for AGIs $25k-50k, 1.2% for AGIs $50k-75k)
Percentage of individuals using paid preparers for their 2020 taxes: 92.3%
Here:
92%
State:
92%
(% for various income ranges: 90.6% for AGIs below $25k, 92.6% for AGIs $25k-50k, 92.1% for AGIs $50k-75k, 92.6% for AGIs $75k-100k, 93.4% for AGIs $100k-200k, 94.3% for AGIs over 200k)
Averages for the 2012 tax year for zip code 92869, filed in 2013:
Average Adjusted Gross Income (AGI) in 2012: $86,983 (Individual Income Tax Returns)
Here:
$86,983
State:
$72,726
Salary/wage: $72,574 (reported on 81.2% of returns)
Here:
$72,574
State:
$59,079
(% of AGI for various income ranges: 71.9% for AGIs below $25k, 78.6% for AGIs $25k-50k, 74.9% for AGIs $50k-75k, 74.2% for AGIs $75k-100k, 73.9% for AGIs $100k-200k, 57.6% for AGIs over 200k)
Taxable interest for individuals: $2,182 (reported on 44.9% of returns)
This zip code:
$2,182
California:
$2,146
(% of AGI for various income ranges: 1.1% for AGIs below $25k, 0.8% for AGIs $25k-50k, 0.6% for AGIs $50k-75k, 0.7% for AGIs $75k-100k, 0.8% for AGIs $100k-200k, 1.6% for AGIs over 200k)
Ordinary dividends: $11,022 (reported on 24.0% of returns)
Here:
$11,022
State:
$9,308
(% of AGI for various income ranges: 1.6% for AGIs below $25k, 1.0% for AGIs $25k-50k, 1.5% for AGIs $50k-75k, 1.5% for AGIs $75k-100k, 1.3% for AGIs $100k-200k, 5.5% for AGIs over 200k)
Net capital gain/loss in AGI: +$31,966 (reported on 21.9% of returns)
Here:
+$31,966
State:
+$30,460
(% of AGI for various income ranges: 0.1% for AGIs $25k-50k, 0.3% for AGIs $50k-75k, 0.4% for AGIs $75k-100k, 1.2% for AGIs $100k-200k, 19.0% for AGIs over 200k)
Profit/loss from business: +$20,714 (reported on 20.7% of returns)
Here:
+$20,714
State:
+$17,064
(% of AGI for various income ranges: 13.7% for AGIs below $25k, 6.1% for AGIs $25k-50k, 5.7% for AGIs $50k-75k, 3.5% for AGIs $75k-100k, 4.3% for AGIs $100k-200k, 4.3% for AGIs over 200k)
Taxable individual retirement arrangement distribution: $20,466 (reported on 10.5% of returns)
92869:
$20,466
California:
$19,557
(% of AGI for various income ranges: 2.8% for AGIs below $25k, 2.1% for AGIs $25k-50k, 3.2% for AGIs $50k-75k, 3.6% for AGIs $75k-100k, 3.0% for AGIs $100k-200k, 1.7% for AGIs over 200k)
Self-employment retirement plans: $20,533 (reported on 1.6% of returns)
92869:
$20,533
California:
$24,530
(% of AGI for various income ranges: 0.4% for AGIs $50k-75k, 0.1% for AGIs $75k-100k, 0.4% for AGIs $100k-200k, 0.5% for AGIs over 200k)
Total itemized deductions: $35,436 (23% of AGI, reported on 46.8% of returns)
Here:
$35,436
State:
$34,004
Here:
23.2% of AGI
State:
22.7% of AGI
(% of AGI for various income ranges: 15.0% for AGIs below $25k, 14.8% for AGIs $25k-50k, 20.3% for AGIs $50k-75k, 22.9% for AGIs $75k-100k, 22.5% for AGIs $100k-200k, 16.8% for AGIs over 200k)
Charity contributions: $4,778 (reported on 40.7% of returns)
Here:
$4,778
State:
$4,659
(% of AGI for various income ranges: 0.9% for AGIs below $25k, 1.3% for AGIs $25k-50k, 1.9% for AGIs $50k-75k, 2.3% for AGIs $75k-100k, 2.5% for AGIs $100k-200k, 2.5% for AGIs over 200k)
Taxes paid: $15,452 (reported on 46.7% of returns)
92869:
$15,452
State:
$14,448
(% of AGI for various income ranges: 2.9% for AGIs below $25k, 3.4% for AGIs $25k-50k, 5.8% for AGIs $50k-75k, 7.0% for AGIs $75k-100k, 8.5% for AGIs $100k-200k, 10.6% for AGIs over 200k)
Earned income credit: $2,059 (reported on 11.3% of returns)
Here:
$2,059
State:
$2,286
(% of AGI for various income ranges: 4.3% for AGIs below $25k, 0.8% for AGIs $25k-50k)
Percentage of individuals using paid preparers for their 2012 taxes: 69.1%
Here:
69%
State:
64%
(% for various income ranges: 67.7% for AGIs below $25k, 68.5% for AGIs $25k-50k, 68.2% for AGIs $50k-75k, 69.1% for AGIs $75k-100k, 69.5% for AGIs $100k-200k, 78.7% for AGIs over 200k)
Averages for the 2004 tax year for zip code 92869, filed in 2005:
Average Adjusted Gross Income (AGI) in 2004: $73,630 (Individual Income Tax Returns)
Here:
$73,630
State:
$58,600
Salary/wage: $62,515 (reported on 83.2% of returns)
Here:
$62,515
State:
$49,455
(% of AGI for various income ranges: 284.0% for AGIs below $10k, 75.7% for AGIs $10k-25k, 80.5% for AGIs $25k-50k, 79.0% for AGIs $50k-75k, 78.9% for AGIs $75k-100k, 64.4% for AGIs over 100k)
Taxable interest for individuals: $2,399 (reported on 56.8% of returns)
This zip code:
$2,399
California:
$2,365
(% of AGI for various income ranges: 19.4% for AGIs below $10k, 1.9% for AGIs $10k-25k, 1.2% for AGIs $25k-50k, 1.4% for AGIs $50k-75k, 1.2% for AGIs $75k-100k, 2.1% for AGIs over 100k)
Taxable dividends: $4,243 (reported on 29.6% of returns)
Here:
$4,243
State:
$4,746
(% of AGI for various income ranges: 14.4% for AGIs below $10k, 1.4% for AGIs $10k-25k, 0.9% for AGIs $25k-50k, 1.1% for AGIs $50k-75k, 0.9% for AGIs $75k-100k, 2.1% for AGIs over 100k)
Net capital gain/loss: +$16,335 (reported on 26.3% of returns)
Here:
+$16,335
State:
+$23,418
(% of AGI for various income ranges: 18.3% for AGIs below $10k, -0.2% for AGIs $10k-25k, 0.2% for AGIs $25k-50k, 1.0% for AGIs $50k-75k, 0.9% for AGIs $75k-100k, 9.1% for AGIs over 100k)
Profit/loss from business: +$19,980 (reported on 20.9% of returns)
Here:
+$19,980
State:
+$16,826
(% of AGI for various income ranges: -5.2% for AGIs below $10k, 10.3% for AGIs $10k-25k, 7.2% for AGIs $25k-50k, 5.6% for AGIs $50k-75k, 5.5% for AGIs $75k-100k, 5.2% for AGIs over 100k)
Profit/loss from farming: +$3,333 (reported on 0.2% of returns)
Here:
+$3,333
State:
-$7,562
IRA payment deduction: $3,519 (reported on 4.0% of returns)
92869:
$3,519
California:
$3,192
(% of AGI for various income ranges: 1.3% for AGIs below $10k, 0.2% for AGIs $10k-25k, 0.4% for AGIs $25k-50k, 0.3% for AGIs $50k-75k, 0.2% for AGIs $75k-100k, 0.1% for AGIs over 100k)
Self-employed pension: $18,025 (reported on 2.5% of returns)
Here:
$18,025
California:
$17,688
(% of AGI for various income ranges: 0.3% for AGIs $25k-50k, 0.3% for AGIs $50k-75k, 0.4% for AGIs $75k-100k, 0.8% for AGIs over 100k)
Total itemized deductions: $36,325 (31% of AGI, reported on 53.1% of returns)
Here:
$36,325
State:
$28,113
Here:
30.8% of AGI
State:
25.3% of AGI
(% of AGI for various income ranges: 70.3% for AGIs below $10k, 17.4% for AGIs $10k-25k, 28.6% for AGIs $25k-50k, 27.2% for AGIs $50k-75k, 27.2% for AGIs $75k-100k, 25.9% for AGIs over 100k)
Charity contributions deductions: $4,466 (4% of AGI, reported on 48.8% of returns)
Here:
$4,466
State:
$3,923
Here:
3.6% of AGI
State:
3.3% of AGI
(% of AGI for various income ranges: 2.9% for AGIs below $10k, 1.4% for AGIs $10k-25k, 2.0% for AGIs $25k-50k, 2.8% for AGIs $50k-75k, 3.1% for AGIs $75k-100k, 3.2% for AGIs over 100k)
Total tax: $13,334 (reported on 79.8% of returns)
92869:
$13,334
State:
$10,761
(% of AGI for various income ranges: 12.6% for AGIs below $10k, 4.6% for AGIs $10k-25k, 7.0% for AGIs $25k-50k, 9.0% for AGIs $50k-75k, 9.9% for AGIs $75k-100k, 18.4% for AGIs over 100k)
Earned income credit: $1,622 (reported on 9.0% of returns)
Here:
$1,622
State:
$1,763
Percentage of individuals using paid preparers for their 2004 taxes: 68.6%
Here:
69%
State:
66%
(% for various income ranges: 59.4% for AGIs below $10k, 67.2% for AGIs $10k-25k, 68.7% for AGIs $25k-50k, 69.9% for AGIs $50k-75k, 72.0% for AGIs $75k-100k, 74.1% for AGIs over 100k)
Likely homosexual households (counted as self-reported same-sex unmarried-partner households)
Lesbian couples: 0.1% of all households
Gay men: 0.2% of all households
Household received Food Stamps/SNAP in the past 12 months: 588 Household did not receive Food Stamps/SNAP in the past 12 months: 10,918
Women who had a birth in the past 12 months: 335 (298 now married, 35 unmarried) Women who did not have a birth in the past 12 months: 7,401 (3,264 now married, 4,122 unmarried)
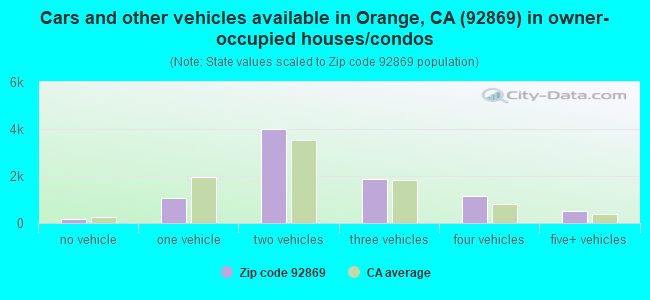
Housing units in zip code 92869 with a mortgage: 6,108 (552 second mortgage, 19 home equity loan, 552 both second mortgage and home equity loan) Houses without a mortgage: 54
Median monthly owner costs for units with a mortgage: $3,242 Median monthly owner costs for units without a mortgage: $808
Residents with income below the poverty level in 2022:
This zip code:
6.0%
Whole state:
12.2%
Residents with income below 50% of the poverty level in 2022:
This zip code:
2.8%
Whole state:
6.2%
Median number of rooms in houses and condos:
Here:
6.8
State:
6.0
Median number of rooms in apartments:
Here:
4.4
State:
3.9
Notable locations in this zip code not listed on our city pages
Notable locations in zip code 92869: Ridgeline Country Club (A), El Modena Branch Orange Public Library (B), City of Orange Fire Department Station 7 (C), Orange County Fire Authority Station 23 (D), City of Orange Fire Department Station 4 (E). Display/hide their locations on the map
Churches in zip code 92869 include: Apostolic Church of Orange (A), Christ Lutheran Church of Orange (B), La Purisma Catholic Church (C), Orange Covenant Church (D), Orange Hills Baptist Church (E). Display/hide their locations on the map
Parks in zip code 92869 include: Irvine Park (1), El Modena Park (2), Santiago Oaks Regional Park (3), Yorba Park (4). Display/hide their locations on the map
4,921 married couples with children.
1,124 single-parent households (414 men, 710 women).
60.8% of residents of 92869 zip code speak English at home.
25.5% of residents speak Spanish at home (62% very well, 17% well, 16% not well, 5% not at all).
3.5% of residents speak other Indo-European language at home (78% very well, 13% well, 7% not well, 2% not at all).
9.6% of residents speak Asian or Pacific Island language at home (50% very well, 37% well, 12% not well, 1% not at all).
0.8% of residents speak other language at home (74% very well, 23% well, 3% not well).
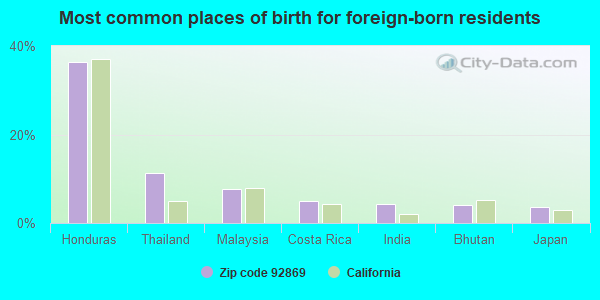
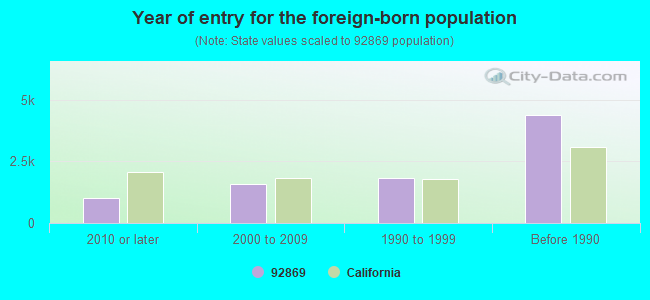
Foreign born population: 8,469 (23.4%) (65.8% of them are naturalized citizens)
Facilities with environmental interests located in this zip code:
EL MODENA HIGH SCHOOL (3920 SPRING ST in ORANGE, CA)
(National Center for Education Statistics) - STATE ID-3031952 Small Quantity Generators, between 100 kg and 1000 kg of hazardous waste/month (Resource Conservation and Recovery Act (tracking hazardous waste)) - notification Organizations: ORANGE USD (CONTACT/OWNER)
, ORANGE UNIFIED (SCHOOL DISTRICT)
MORALES TRUCKING (315 S TRACY LANE in ORANGE, CA)
STATE MASTER (California - Hazardous Waste Tracking) - HAZARDOU WASTE PROGRAM TRANSPORTER (Resource Conservation and Recovery Act (tracking hazardous waste)) - notification Organizations: DEBORAH MORALES (CONTACT/OWNER)
CHAPMAN GENERAL HOSPITAL X RAY (2601 E CHAPMAN AVE in ORANGE, CA)
STATE MASTER (California - Hazardous Waste Tracking) - HAZARDOU WASTE PROGRAM Small Quantity Generators, between 100 kg and 1000 kg of hazardous waste/month (Resource Conservation and Recovery Act (tracking hazardous waste)) - notification Organizations: AMERICAN HEALTHCARE MANAGEMENT (CONTACT/OWNER)
Alternative names: CHAPMAN MEDICAL CENTER X-RAY
ESPLANADE ELEMENTARY (381 N. ESPLANADE in ORANGE, CA)
(National Center for Education Statistics) - STATE ID-6029771 Organizations: ORANGE UNIFIED (SCHOOL DISTRICT)
LINDA VISTA ELEMENTARY (1200 N. CANNON ST. in ORANGE, CA)
(National Center for Education Statistics) - STATE ID-6071112 Organizations: ORANGE UNIFIED (SCHOOL DISTRICT)
MCPHERSON (ELEM) (333 SO PROSPECT in ORANGE, CA)
(National Center for Education Statistics) - STATE ID-6058945 Organizations: ORANGE UNIFIED (SCHOOL DISTRICT)
ELDORADO SCHOOL FOR THE GIFTED CHILD (4100 E WALNUT in ORANGE, CA)
COMPLIANCE ACTIVITY (Tracking inspections of insecticide, fungicide, and rodenticide, and toxic substances) Alternative names: EL DORADO SCHOOL FOR THE GIFTED CHILD
GRANDE CLEANERS (3345 CHAPMAN AVE in ORANGE, CA)
Small Quantity Generators, between 100 kg and 1000 kg of hazardous waste/month (Resource Conservation and Recovery Act (tracking hazardous waste))
MCPHERSON JUNIOR HIGH (333 S PROSPECT in ORANGE, CA)
Small Quantity Generators, between 100 kg and 1000 kg of hazardous waste/month (Resource Conservation and Recovery Act (tracking hazardous waste))
Housing units lacking complete plumbing facilities: 0.2% Housing units lacking complete kitchen facilities: 1.1%
79.3%Utility gas
15.7%Electricity
2.6%No fuel used
1.3%Solar energy
0.8%Bottled, tank, or LP gas
Place of birth for U.S.-born residents:
This state: 21,316
Northeast: 1,399
Midwest: 1,787
South: 1,370
West: 1,203
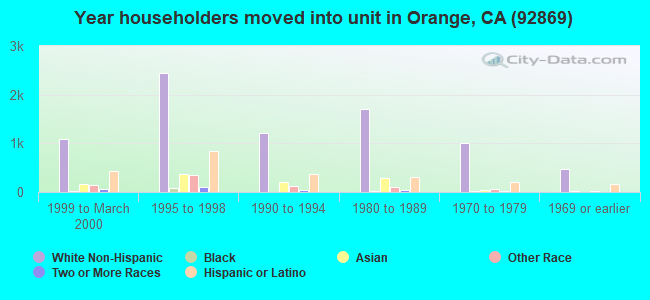
57% of the 92869 zip code residents lived in the same house 5 years ago. Out of people who lived in different houses, 79% lived in this county. Out of people who lived in different counties, 50% lived in California.
90% of the 92869 zip code residents lived in the same house 1 year ago. Out of people who lived in different houses, 60% moved from this county. Out of people who lived in different houses, 18% moved from different county within same state. Out of people who lived in different houses, 15% moved from different state. Out of people who lived in different houses, 8% moved from abroad.
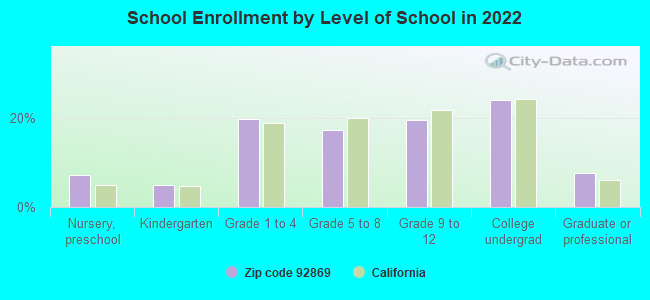
Private vs. public school enrollment:
Students in private schools in grades 1 to 8 (elementary and middle school): 653
Here:
19.4%
California:
10.5%
Students in private schools in grades 9 to 12 (high school): 196
Here:
11.2%
California:
8.5%
Students in private undergraduate colleges: 492
Here:
22.6%
California:
15.9%
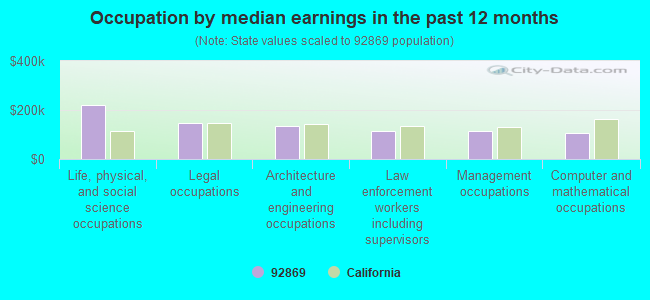
Occupation by median earnings in the past 12 months ($)
221,571Life, physical, and social science occupations
148,603Legal occupations
135,596Architecture and engineering occupations
113,265Law enforcement workers including supervisors
112,342Management occupations
104,840Computer and mathematical occupations
Companies with federal contracts located in this zip code (ORANGE, CA):
DEFENSE SPARES & CONTROL SYSTE (3538 E. BARRINGTON DRIVE; small business)
$98,336 with Defense Logistics Agency for Valves, Powered. Signed on 2000-06-30. Completion date: 2000-12-27.
PETERSON'S TREE WORKS INC (605 N RANCHO SANTIAGO BLVD; small business)
$26,645 with Air Force for Tree Thinning Services. Signed on 2006-05-15. Completion date: 2006-07-12.
GENARDINI, RICHARD B (8502 E CHAPMAN #230; small business) : $23,400 in 2 contractsin 2004
$11,700 with Army for Other Administrative Support Services. Signed on 2004-04-15. Completion date: 2004-09-30.
$11,700 with U.S. Army Corps of Engineers - civil program financing only for Other Administrative Support Services. Signed on 2004-04-15. Completion date: 2004-09-30.
CLEAN AIR SPECIALIST, INC (2440 E KARAN LN; small business)
$6,844 with Navy for Air Purification Equipment. Signed on 2004-11-04. Completion date: 2004-11-12.
YUREK, STEPHEN (129 S KATHLEEN LANE; small business)
$3,532 with Air Force for Miscellaneous Items. Signed on 2005-03-29. Completion date: 2004-08-27.
COMPUTERIZED ENGRAVING MAINTEN (2814 E CHAPMAN AVE; small business)
$3,487 with Navy for ADP Software. Signed on 2003-06-16. Completion date: 2003-06-30.
Top industries in this zip code by the number of employees in 2005:
Health Care and Social Assistance: Nursing Care Facilities (250-499 employees: 1 establishment)
Health Care and Social Assistance: General Medical and Surgical Hospitals (250-499: 1)
2005 - 2018 National Fire Incident Reporting System (NFIRS) incidents
According to the data from the years 2005 - 2018 the average number of fire incidents per year is 18. The highest number of fire incidents - 50 took place in 2007, and the least - 0 in 2015. The data has a declining trend.
When looking into fire subcategories, the most incidents belonged to: Outside Fires (41.4%), and Structure Fires (26.7%).
Fire incident types reported to NFIRS in Zip Code 92869


+$3,333
-$7,562
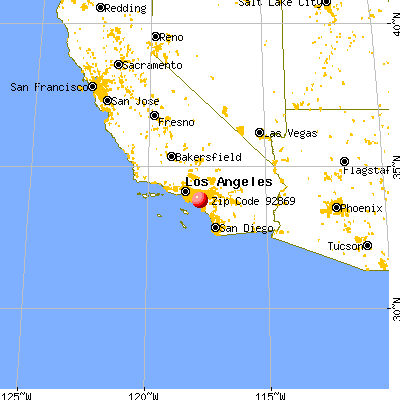
 Nearest zip codes: 92861, 92807, 92705, 92867, 92866, 92865.


 According to the data from the years 2005 - 2018 the average number of fire incidents per year is 18. The highest number of fire incidents - 50 took place in 2007, and the least - 0 in 2015. The data has a declining trend.
 When looking into fire subcategories, the most incidents belonged to: Outside Fires (41.4%), and Structure Fires (26.7%).