Estimated zip code population in 2022: 1,822 Zip code population in 2010: 2,031 Zip code population in 2000: 1,449
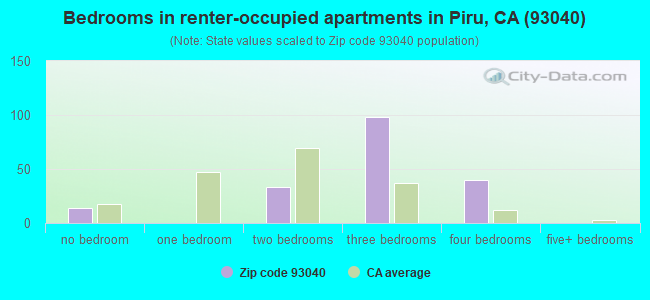
Houses and condos: 591 Renter-occupied apartments: 184
% of renters here:
34%
State:
44%
March 2022 cost of living index in zip code 93040: 74.7 (low, U.S. average is 100)
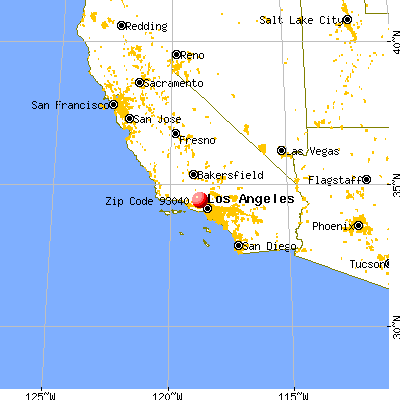
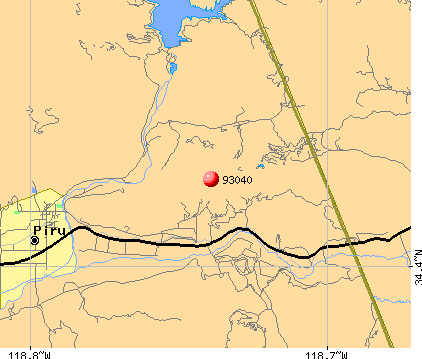
Land area: 70.6 sq. mi. Water area: 2.0 sq. mi.
Population density: 26 people per square mile
(very low).
OSM Map
General Map
Google Map
MSN Map
OSM Map
General Map
Google Map
MSN Map
OSM Map
General Map
Google Map
MSN Map
OSM Map
General Map
Google Map
MSN Map
Please wait while loading the map...
Real estate property taxes paid for housing units in 2022:
This zip code:
0.9% ($4,800)
California:
0.7% ($4,831)
Median real estate property taxes paid for housing units with mortgages in 2022: $5,135 (1.0%) Median real estate property taxes paid for housing units with no mortgage in 2022: $4,784 (0.6%)
Business Search- 14 Million verified businesses
Males: 844
(46.3%)
Females: 978
(53.7%)
For population 25 years and over in 93040:
High school or higher: 68.8%
Bachelor's degree or higher: 10.8%
Graduate or professional degree: 2.3%
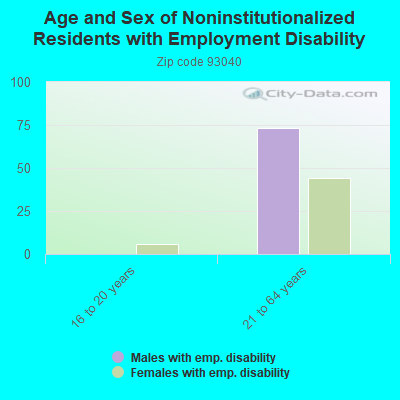
Unemployed: 6.9%
Mean travel time to work (commute): 29.1 minutes
For population 15 years and over in 93040:
Never married: 34.7%
Now married: 52.5%
Separated: 2.0%
Widowed: 7.2%
Divorced: 3.6%
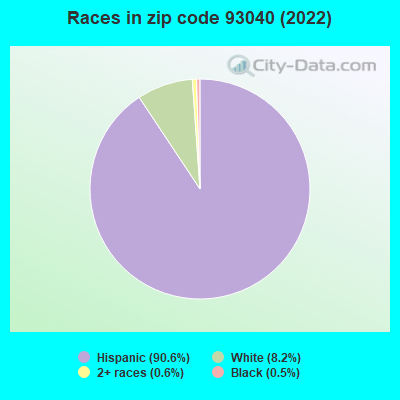
Zip code 93040 compared to state average:
Black race population percentage significantly below state average.
Hispanic race population percentage above state average.
Median age below state average.
Length of stay since moving in significantly above state average.
Percentage of population with a bachelor's degree or higher significantly below state average.
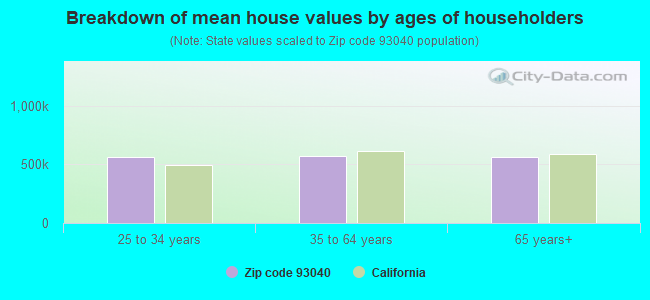
Estimated median house/condo value in 2022: $507,743
93040:
$507,743
California:
$715,900
According to our research of California and other state lists, there were 3 registered sex offenders living in 93040 zip code as of May 28, 2024. The ratio of all residents to sex offenders in zip code 93040 is 669 to 1. The ratio of registered sex offenders to all residents in this zip code is near the state average.
Median resident age:
This zip code:
33.0 years
California median age:
37.9 years
Average household size:
This zip code:
3.4 people
California:
2.8 people
Averages for the 2004 tax year for zip code 93040, filed in 2005:
Average Adjusted Gross Income (AGI) in 2004: $30,525 (Individual Income Tax Returns)
Here:
$30,525
State:
$58,600
Salary/wage: $28,993 (reported on 93.9% of returns)
Here:
$28,993
State:
$49,455
(% of AGI for various income ranges: 94.4% for AGIs below $10k, 87.0% for AGIs $10k-25k, 92.4% for AGIs $25k-50k, 88.7% for AGIs $50k-75k, 80.0% for AGIs $75k-100k, 92.6% for AGIs over 100k)
Taxable interest for individuals: $197 (reported on 27.5% of returns)
This zip code:
$197
California:
$2,365
(% of AGI for various income ranges: 0.5% for AGIs below $10k, 0.2% for AGIs $10k-25k, 0.2% for AGIs $25k-50k, 0.1% for AGIs $50k-75k, 0.1% for AGIs $75k-100k, 0.1% for AGIs over 100k)
Taxable dividends: $235 (reported on 4.4% of returns)
Here:
$235
State:
$4,746
Profit/loss from business: +$8,064 (reported on 10.1% of returns)
Here:
+$8,064
State:
+$16,826
Total itemized deductions: $20,178 (35% of AGI, reported on 22.5% of returns)
Here:
$20,178
State:
$28,113
Here:
35.4% of AGI
State:
25.3% of AGI
(% of AGI for various income ranges: 5.0% for AGIs $10k-25k, 13.3% for AGIs $25k-50k, 17.7% for AGIs $50k-75k, 27.6% for AGIs $75k-100k, 25.5% for AGIs over 100k)
Charity contributions deductions: $1,919 (3% of AGI, reported on 20.8% of returns)
Here:
$1,919
State:
$3,923
Here:
3.4% of AGI
State:
3.3% of AGI
(% of AGI for various income ranges: 0.3% for AGIs $10k-25k, 1.2% for AGIs $25k-50k, 1.9% for AGIs $50k-75k, 2.9% for AGIs $75k-100k, 1.0% for AGIs over 100k)
Total tax: $2,676 (reported on 57.5% of returns)
93040:
$2,676
State:
$10,761
(% of AGI for various income ranges: 1.5% for AGIs below $10k, 2.7% for AGIs $10k-25k, 3.8% for AGIs $25k-50k, 6.2% for AGIs $50k-75k, 8.6% for AGIs $75k-100k, 9.5% for AGIs over 100k)
Earned income credit: $1,992 (reported on 31.0% of returns)
Here:
$1,992
State:
$1,763
Percentage of individuals using paid preparers for their 2004 taxes: 82.9%
Here:
83%
State:
66%
(% for various income ranges: 75.8% for AGIs below $10k, 85.7% for AGIs $10k-25k, 86.0% for AGIs $25k-50k, 77.8% for AGIs $50k-75k, 83.3% for AGIs $75k-100k, 80.0% for AGIs over 100k)
Household received Food Stamps/SNAP in the past 12 months: 76 Household did not receive Food Stamps/SNAP in the past 12 months: 463
Women who had a birth in the past 12 months: 68 (56 now married, 11 unmarried) Women who did not have a birth in the past 12 months: 337 (83 now married, 255 unmarried)
Housing units in zip code 93040 with a mortgage: 271 Residents with income below the poverty level in 2022:
This zip code:
9.0%
Whole state:
12.2%
Residents with income below 50% of the poverty level in 2022:
This zip code:
7.3%
Whole state:
6.2%
Median number of rooms in houses and condos:
Here:
5.3
State:
6.0
Median number of rooms in apartments:
Here:
5.2
State:
3.9
Notable locations in this zip code not listed on our city pages
Size of family households: 132 2-persons, 129 3-persons, 111 4-persons, 27 5-persons, 31 6-persons, 22 7-or-more-persons
Size of nonfamily households: 56 1-person, 22 2-persons
256 married couples with children.
127 single-parent households (42 men, 85 women).
32.6% of residents of 93040 zip code speak English at home.
67.9% of residents speak Spanish at home (57% very well, 17% well, 14% not well, 11% not at all).
0.5% of residents speak other language at home (100% very well).
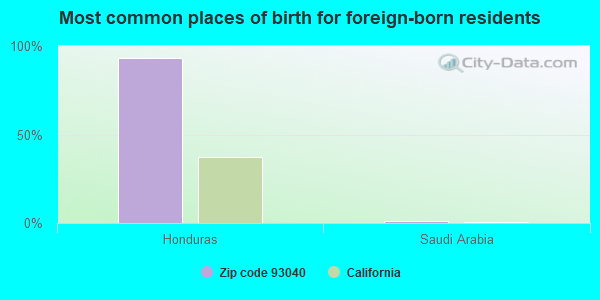
Foreign born population: 499 (27.4%) (44.0% of them are naturalized citizens)
This zip code:
27.4%
Whole state:
26.7%
93%Honduras
1%Saudi Arabia
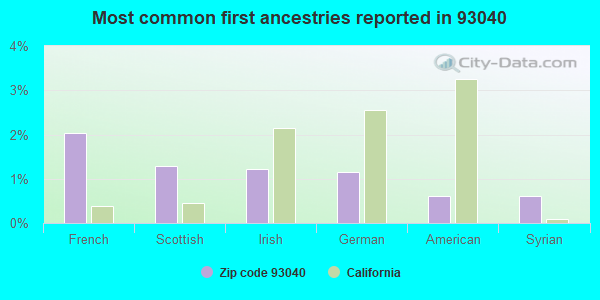
2%French
1%Scottish
1%Irish
1%German
1%American
1%Syrian
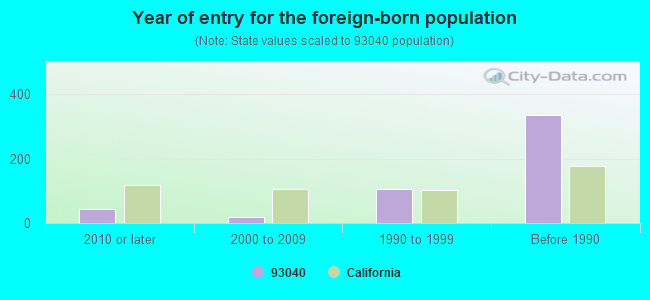
Year of entry for the foreign-born population
422010 or later
182000 to 2009
1041990 to 1999
335Before 1990
Facilities with environmental interests located in this zip code:
ENVIRONMENTAL RECOVERY SYSTEM (3981 TELEGRAPH ROAD in PIRU, CA)
(Resource Conservation and Recovery Act (tracking hazardous waste)) Organizations: WILLIAM KNOLLINGER (CONTACT/OPERATOR)
, WATSON BUSINESS PARK (CONTACT/OWNER)
HYDRO SPA (3741 E TELEGRAPH RD in PIRU, CA)
Small Quantity Generators, between 100 kg and 1000 kg of hazardous waste/month (Resource Conservation and Recovery Act (tracking hazardous waste)) Small Quantity Generators, between 100 kg and 1000 kg of hazardous waste/month (Resource Conservation and Recovery Act (tracking hazardous waste)) Organizations: MR BOB WILEY SR (CONTACT/OWNER)
Alternative names: HYDRA-SPA, INC
HRUBETZ OIL CO (5 MI N E OF in PIRU, CA)
Small Quantity Generators, between 100 kg and 1000 kg of hazardous waste/month (Resource Conservation and Recovery Act (tracking hazardous waste))
I T G ENERGY CORPORATION (SLOAN LEASE EUREKA CANYON in PIRU, CA)
CRITERIA AND HAZARDOUS AIR POLLUTANT INVENTORY (Inventory of air pollution sources) Business SIC and NAICS classification: CRUDE PETROLEUM AND NATURAL GAS Alternative names: PETRO RESOURCES
MCFARLAND ENERGY INC (BLACK LEASE RAMONA FIELD in PIRU, CA)
CRITERIA AND HAZARDOUS AIR POLLUTANT INVENTORY (Inventory of air pollution sources) Business SIC classification: CRUDE PETROLEUM AND NATURAL GAS Alternative names: CBASE CORPORATION
FORTUNE PETROLEUM CORPORATION (HOLSER LEASE HOLSER CANYON FIELD in PIRU, CA)
CRITERIA AND HAZARDOUS AIR POLLUTANT INVENTORY (Inventory of air pollution sources) Business SIC classification: CRUDE PETROLEUM AND NATURAL GAS
JORO INC (2480 HOPPER CANYON in PIRU, CA)
CRITERIA AND HAZARDOUS AIR POLLUTANT INVENTORY (Inventory of air pollution sources) Business SIC classification: CRUDE PETROLEUM AND NATURAL GAS Alternative names: FORTUNE PETROLEUM CORP.
MAVERICK OIL NORTH TAPO LEASE (TAPO CANYON OFF HIGHWAY 126 in PIRU, CA)
CRITERIA AND HAZARDOUS AIR POLLUTANT INVENTORY (Inventory of air pollution sources) Business SIC classification: CRUDE PETROLEUM AND NATURAL GAS
NUEVO ENERGY COMPANY (SO TAPO CYN-SANTA SUSANA FIELD in PIRU, CA)
CRITERIA AND HAZARDOUS AIR POLLUTANT INVENTORY (Inventory of air pollution sources) Business SIC classification: CRUDE PETROLEUM AND NATURAL GAS
NUEVO ENERGY COMPANY (OAKRIDGE AND TAPO RIDGE AND TORREY in PIRU, CA)
CRITERIA AND HAZARDOUS AIR POLLUTANT INVENTORY (Inventory of air pollution sources) Business SIC classification: CRUDE PETROLEUM AND NATURAL GAS
NUEVO ENERGY COMPANY (HOLSER CANYON BOOSTER PLANT in PIRU, CA)
CRITERIA AND HAZARDOUS AIR POLLUTANT INVENTORY (Inventory of air pollution sources) Business SIC classification: CRUDE PETROLEUM AND NATURAL GAS
CECIL BASENBERG (RAMONA FIELD AGUIRRE LEASE in PIRU, CA)
CRITERIA AND HAZARDOUS AIR POLLUTANT INVENTORY (Inventory of air pollution sources) Business SIC classification: CRUDE PETROLEUM AND NATURAL GAS
Housing units lacking complete plumbing facilities: 3.2% Housing units lacking complete kitchen facilities: 3.0%
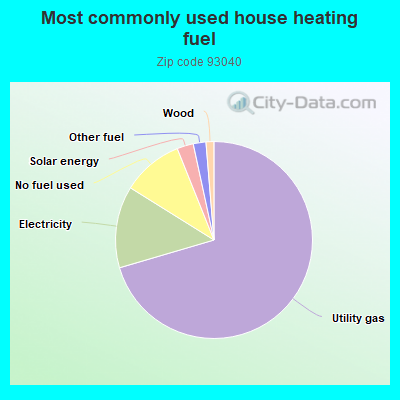
70.8%Utility gas
13.5%Electricity
10.1%No fuel used
2.7%Solar energy
2.1%Other fuel
1.3%Wood
Place of birth for U.S.-born residents:
This state: 1,252
Northeast: 19
Midwest: 16
South: 19
West: 4
46% of the 93040 zip code residents lived in the same house 5 years ago. Out of people who lived in different houses, 53% lived in this county. Out of people who lived in different counties, 50% lived in California.
98% of the 93040 zip code residents lived in the same house 1 year ago. Out of people who lived in different houses, 43% moved from this county. Out of people who lived in different houses, 81% moved from different county within same state.
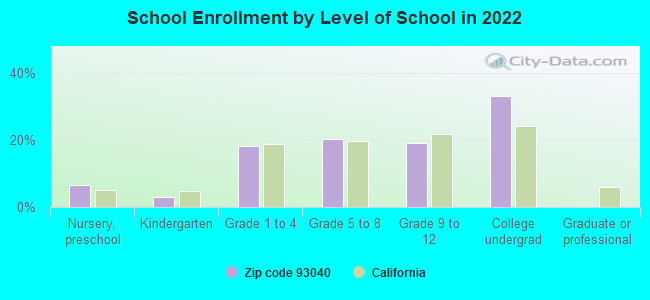
Private vs. public school enrollment:
Students in private schools in grades 1 to 8 (elementary and middle school): 33
Here:
22.2%
California:
10.5%
Students in private schools in grades 9 to 12 (high school):
Here:
0.0%
California:
8.5%
Students in private undergraduate colleges: 5
Here:
4.7%
California:
15.9%
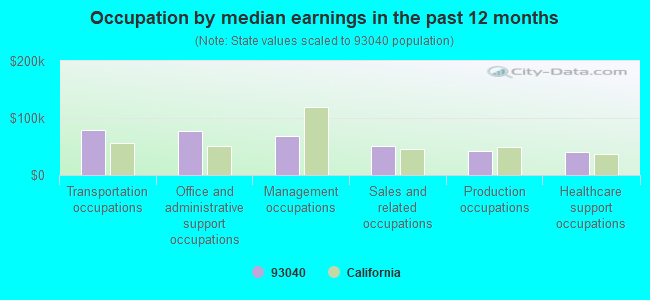
Occupation by median earnings in the past 12 months ($)
79,179Transportation occupations
78,038Office and administrative support occupations
69,180Management occupations
50,193Sales and related occupations
41,450Production occupations
41,056Healthcare support occupations
Top industries in this zip code by the number of employees in 2005:
Accommodation and Food Services: RV (Recreational Vehicle) Parks and Campgrounds (20-49 employees: 1 establishment, 10-19 employees: 1 establishment)
Arts, Entertainment, and Recreation: Racetracks (10-19: 1)
Other Services (except Public Administration): Civic and Social Organizations (5-9: 1)
Arts, Entertainment, and Recreation: Other Gambling Industries (5-9: 1)
Real Estate and Rental and Leasing: Lessors of Residential Buildings and Dwellings (1-4: 1)
People in group quarters in 2000:
83 people in other group homes
Fatal accident statistics in 2014:
Fatal accident count: 1
Vehicles involved in fatal accidents: 1
Fatal accidents caused by drunken drivers: 1
Fatalities: 1
Persons involved in fatal accidents: 1
Pedestrians involved in fatal accidents: 0
Fatal accident statistics in 2012:
Fatal accident count: 2
Vehicles involved in fatal accidents: 2
Fatal accidents caused by drunken drivers: 1
Fatalities: 2
Persons involved in fatal accidents: 3
Pedestrians involved in fatal accidents: 0
Home Mortgage Disclosure Act Aggregated Statistics For Year 2009 (Based on 2 partial tracts)
A) FHA, FSA/RHS & VA Home Purchase Loans
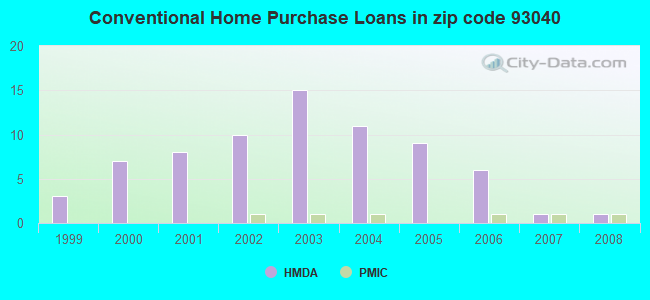
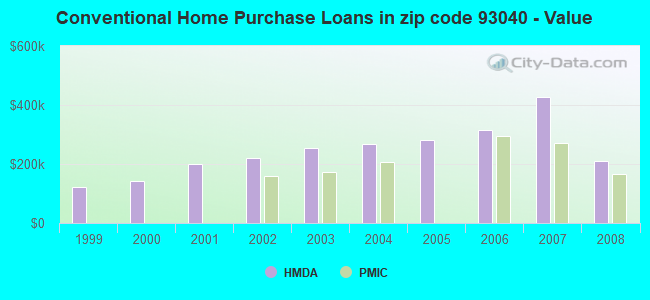
B) Conventional Home Purchase Loans
C) Refinancings
F) Non-occupant Loans on < 5 Family Dwellings (A B C & D)
G) Loans On Manufactured Home Dwelling (A B C & D)
Number
Average Value
Number
Average Value
Number
Average Value
Number
Average Value
Number
Average Value
LOANS ORIGINATED
3
$250,123
0
$0
1
$301,880
0
$0
1
$147,270
APPLICATIONS APPROVED, NOT ACCEPTED
0
$0
1
$155,270
0
$0
1
$155,270
0
$0
APPLICATIONS DENIED
0
$0
1
$76,640
2
$264,560
1
$76,640
0
$0
APPLICATIONS WITHDRAWN
0
$0
0
$0
1
$213,910
0
$0
1
$213,910
FILES CLOSED FOR INCOMPLETENESS
0
$0
0
$0
0
$0
0
$0
0
$0
Aggregated Statistics For Year 2008 (Based on 2 partial tracts)
A) FHA, FSA/RHS & VA Home Purchase Loans
B) Conventional Home Purchase Loans
C) Refinancings
D) Home Improvement Loans
F) Non-occupant Loans on < 5 Family Dwellings (A B C & D)
G) Loans On Manufactured Home Dwelling (A B C & D)
Number
Average Value
Number
Average Value
Number
Average Value
Number
Average Value
Number
Average Value
Number
Average Value
LOANS ORIGINATED
0
$0
1
$211,250
4
$248,900
1
$2,670
1
$142,610
1
$211,250
APPLICATIONS APPROVED, NOT ACCEPTED
0
$0
1
$76,640
1
$215,910
0
$0
1
$76,640
0
$0
APPLICATIONS DENIED
0
$0
1
$303,210
2
$298,215
0
$0
0
$0
0
$0
APPLICATIONS WITHDRAWN
0
$0
0
$0
0
$0
0
$0
0
$0
0
$0
FILES CLOSED FOR INCOMPLETENESS
1
$177,930
0
$0
1
$120,620
0
$0
1
$120,620
0
$0
Aggregated Statistics For Year 2007 (Based on 2 partial tracts)
B) Conventional Home Purchase Loans
C) Refinancings
D) Home Improvement Loans
F) Non-occupant Loans on < 5 Family Dwellings (A B C & D)
G) Loans On Manufactured Home Dwelling (A B C & D)
Number
Average Value
Number
Average Value
Number
Average Value
Number
Average Value
Number
Average Value
LOANS ORIGINATED
1
$426,500
11
$290,308
2
$277,555
2
$192,255
1
$146,610
APPLICATIONS APPROVED, NOT ACCEPTED
3
$195,257
1
$506,460
0
$0
0
$0
1
$33,320
APPLICATIONS DENIED
1
$616,420
9
$478,104
1
$513,130
1
$235,910
1
$86,630
APPLICATIONS WITHDRAWN
1
$158,600
5
$381,848
0
$0
0
$0
0
$0
FILES CLOSED FOR INCOMPLETENESS
1
$193,260
1
$277,220
0
$0
0
$0
0
$0
Aggregated Statistics For Year 2006 (Based on 2 partial tracts)
B) Conventional Home Purchase Loans
C) Refinancings
D) Home Improvement Loans
F) Non-occupant Loans on < 5 Family Dwellings (A B C & D)
G) Loans On Manufactured Home Dwelling (A B C & D)
Number
Average Value
Number
Average Value
Number
Average Value
Number
Average Value
Number
Average Value
LOANS ORIGINATED
6
$313,985
21
$293,946
1
$305,880
3
$365,853
1
$152,610
APPLICATIONS APPROVED, NOT ACCEPTED
3
$328,980
5
$266,694
0
$0
0
$0
1
$123,950
APPLICATIONS DENIED
4
$450,152
7
$315,397
1
$271,890
0
$0
0
$0
APPLICATIONS WITHDRAWN
3
$521,123
6
$495,802
1
$169,930
0
$0
1
$171,930
FILES CLOSED FOR INCOMPLETENESS
0
$0
1
$143,280
1
$53,980
0
$0
0
$0
Aggregated Statistics For Year 2005 (Based on 2 partial tracts)
A) FHA, FSA/RHS & VA Home Purchase Loans
B) Conventional Home Purchase Loans
C) Refinancings
D) Home Improvement Loans
F) Non-occupant Loans on < 5 Family Dwellings (A B C & D)
G) Loans On Manufactured Home Dwelling (A B C & D)
Number
Average Value
Number
Average Value
Number
Average Value
Number
Average Value
Number
Average Value
Number
Average Value
LOANS ORIGINATED
1
$211,920
9
$282,850
19
$269,682
4
$89,130
3
$441,157
1
$211,920
APPLICATIONS APPROVED, NOT ACCEPTED
0
$0
1
$751,030
1
$213,250
0
$0
0
$0
0
$0
APPLICATIONS DENIED
0
$0
3
$376,517
11
$300,062
2
$31,985
1
$614,420
1
$202,590
APPLICATIONS WITHDRAWN
0
$0
1
$299,880
12
$228,187
1
$113,950
1
$276,560
0
$0
FILES CLOSED FOR INCOMPLETENESS
0
$0
0
$0
1
$344,530
0
$0
0
$0
0
$0
Aggregated Statistics For Year 2004 (Based on 2 partial tracts)
B) Conventional Home Purchase Loans
C) Refinancings
D) Home Improvement Loans
F) Non-occupant Loans on < 5 Family Dwellings (A B C & D)
G) Loans On Manufactured Home Dwelling (A B C & D)
Number
Average Value
Number
Average Value
Number
Average Value
Number
Average Value
Number
Average Value
LOANS ORIGINATED
11
$267,832
19
$241,026
5
$161,402
3
$304,323
1
$61,310
APPLICATIONS APPROVED, NOT ACCEPTED
1
$173,260
8
$152,106
0
$0
0
$0
1
$68,640
APPLICATIONS DENIED
3
$213,027
9
$219,616
2
$150,275
1
$277,890
1
$66,640
APPLICATIONS WITHDRAWN
1
$319,870
8
$203,085
3
$228,130
0
$0
0
$0
FILES CLOSED FOR INCOMPLETENESS
0
$0
7
$234,191
1
$249,230
0
$0
1
$55,980
Aggregated Statistics For Year 2003 (Based on 2 partial tracts)
B) Conventional Home Purchase Loans
C) Refinancings
D) Home Improvement Loans
F) Non-occupant Loans on < 5 Family Dwellings (A B C & D)
Number
Average Value
Number
Average Value
Number
Average Value
Number
Average Value
LOANS ORIGINATED
15
$254,609
45
$208,020
1
$27,990
4
$172,265
APPLICATIONS APPROVED, NOT ACCEPTED
2
$179,260
6
$249,233
0
$0
0
$0
APPLICATIONS DENIED
6
$217,690
8
$186,675
2
$29,655
3
$179,927
APPLICATIONS WITHDRAWN
3
$340,973
11
$193,014
0
$0
1
$215,250
FILES CLOSED FOR INCOMPLETENESS
0
$0
1
$273,220
0
$0
0
$0
Aggregated Statistics For Year 2002 (Based on 2 partial tracts)
A) FHA, FSA/RHS & VA Home Purchase Loans
B) Conventional Home Purchase Loans
C) Refinancings
D) Home Improvement Loans
F) Non-occupant Loans on < 5 Family Dwellings (A B C & D)
Number
Average Value
Number
Average Value
Number
Average Value
Number
Average Value
Number
Average Value
LOANS ORIGINATED
1
$155,270
10
$221,112
29
$199,414
2
$27,320
2
$169,930
APPLICATIONS APPROVED, NOT ACCEPTED
0
$0
0
$0
4
$169,265
0
$0
1
$126,620
APPLICATIONS DENIED
0
$0
2
$221,910
13
$174,033
1
$170,600
0
$0
APPLICATIONS WITHDRAWN
0
$0
1
$385,180
15
$163,268
0
$0
1
$335,870
FILES CLOSED FOR INCOMPLETENESS
0
$0
1
$135,280
5
$171,532
0
$0
0
$0
Aggregated Statistics For Year 2001 (Based on 2 partial tracts)
A) FHA, FSA/RHS & VA Home Purchase Loans
B) Conventional Home Purchase Loans
C) Refinancings
D) Home Improvement Loans
E) Loans on Dwellings For 5+ Families
F) Non-occupant Loans on < 5 Family Dwellings (A B C & D)
Number
Average Value
Number
Average Value
Number
Average Value
Number
Average Value
Number
Average Value
Number
Average Value
LOANS ORIGINATED
2
$204,250
8
$199,088
23
$136,351
1
$2,000
1
$183,260
2
$125,285
APPLICATIONS APPROVED, NOT ACCEPTED
0
$0
0
$0
5
$160,602
0
$0
0
$0
0
$0
APPLICATIONS DENIED
0
$0
6
$317,095
9
$118,397
1
$23,320
0
$0
1
$48,650
APPLICATIONS WITHDRAWN
0
$0
3
$273,667
13
$167,625
1
$23,320
0
$0
1
$287,880
FILES CLOSED FOR INCOMPLETENESS
1
$119,950
0
$0
1
$129,950
1
$32,650
0
$0
0
$0
Aggregated Statistics For Year 2000 (Based on 2 partial tracts)
A) FHA, FSA/RHS & VA Home Purchase Loans
B) Conventional Home Purchase Loans
C) Refinancings
D) Home Improvement Loans
F) Non-occupant Loans on < 5 Family Dwellings (A B C & D)
Number
Average Value
Number
Average Value
Number
Average Value
Number
Average Value
Number
Average Value
LOANS ORIGINATED
3
$187,480
7
$144,037
3
$115,510
0
$0
1
$128,620
APPLICATIONS APPROVED, NOT ACCEPTED
0
$0
3
$110,177
1
$55,310
0
$0
1
$80,630
APPLICATIONS DENIED
0
$0
7
$136,231
5
$170,732
1
$33,320
1
$45,320
APPLICATIONS WITHDRAWN
1
$114,620
3
$254,120
5
$174,196
0
$0
0
$0
FILES CLOSED FOR INCOMPLETENESS
0
$0
1
$69,970
1
$459,820
0
$0
0
$0
Aggregated Statistics For Year 1999 (Based on 1 partial tract)
A) FHA, FSA/RHS & VA Home Purchase Loans
B) Conventional Home Purchase Loans
C) Refinancings
F) Non-occupant Loans on < 5 Family Dwellings (A B C & D)
Detailed PMIC statistics for the following Tracts:0002.00
2005 - 2018 National Fire Incident Reporting System (NFIRS) incidents
According to the data from the years 2005 - 2018 the average number of fire incidents per year is 14. The highest number of reported fire incidents - 28 took place in 2007, and the least - 7 in 2006. The data has an increasing trend.
When looking into fire subcategories, the most incidents belonged to: Outside Fires (52.3%), and Other (22.1%).
Fire incident types reported to NFIRS in Zip Code 93040


 Nearest zip codes: 91384, 93015, 91355, 91381, 93063, 93021.


 According to the data from the years 2005 - 2018 the average number of fire incidents per year is 14. The highest number of reported fire incidents - 28 took place in 2007, and the least - 7 in 2006. The data has an increasing trend.
 When looking into fire subcategories, the most incidents belonged to: Outside Fires (52.3%), and Other (22.1%).