Estimated zip code population in 2022: 22,916 Zip code population in 2010: 23,641 Zip code population in 2000: 25,617
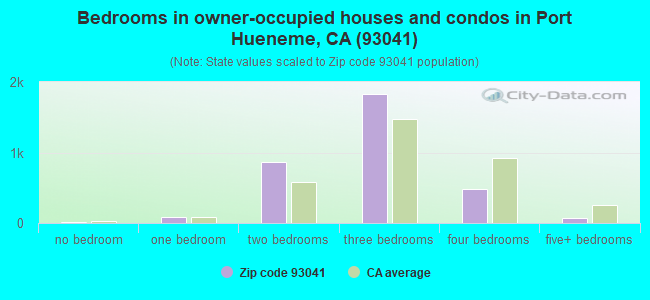
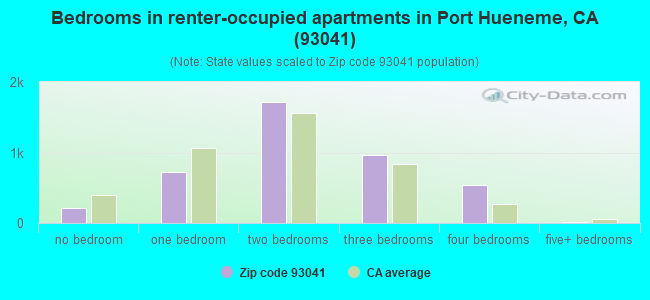
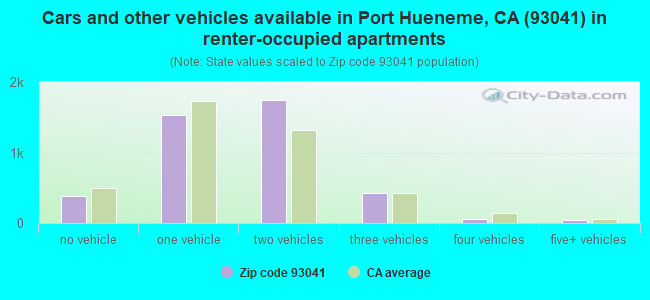
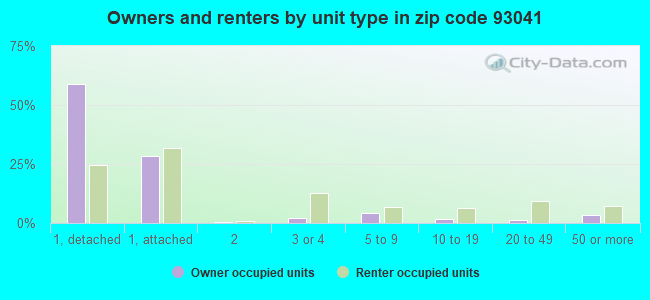
Houses and condos: 8,941 Renter-occupied apartments: 4,189
% of renters here:
55%
State:
44%
March 2022 cost of living index in zip code 93041: 92.6 (less than average, U.S. average is 100)
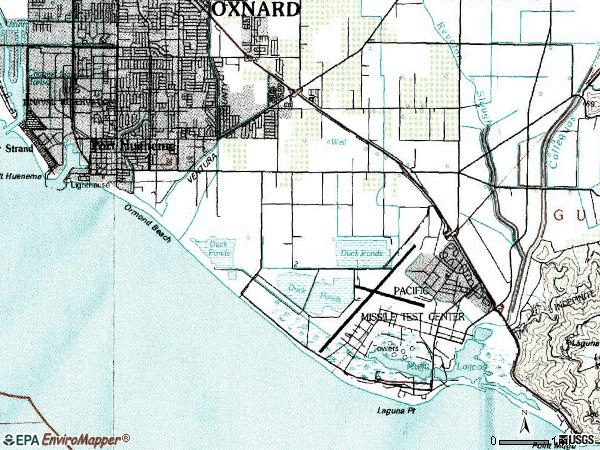
Land area: 11.2 sq. mi. Water area: 1.7 sq. mi.
Population density: 2,039 people per square mile
(low).
OSM Map
General Map
Google Map
MSN Map
OSM Map
General Map
Google Map
MSN Map
OSM Map
General Map
Google Map
MSN Map
OSM Map
General Map
Google Map
MSN Map
Please wait while loading the map...
Real estate property taxes paid for housing units in 2022:
This zip code:
0.8% ($4,191)
California:
0.7% ($4,831)
Median real estate property taxes paid for housing units with mortgages in 2022: $4,850 (0.8%) Median real estate property taxes paid for housing units with no mortgage in 2022: $2,917 (0.6%)
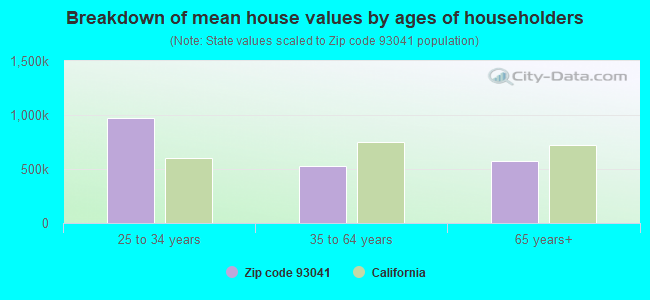
Estimated median house/condo value in 2022: $540,318
93041:
$540,318
California:
$715,900
According to our research of California and other state lists, there were 34 registered sex offenders living in 93041 zip code as of May 28, 2024. The ratio of all residents to sex offenders in zip code 93041 is 726 to 1. The ratio of registered sex offenders to all residents in this zip code is near the state average.
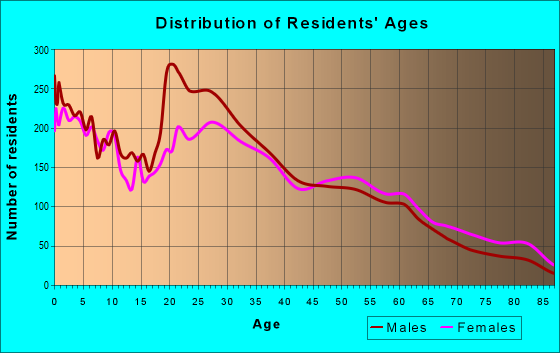
Median resident age:
This zip code:
34.2 years
California median age:
37.9 years
Average household size:
This zip code:
3.0 people
California:
2.8 people
Averages for the 2020 tax year for zip code 93041, filed in 2021:
Average Adjusted Gross Income (AGI) in 2020: $52,415 (Individual Income Tax Returns)
Here:
$52,415
State:
$95,910
Salary/wage: $47,133 (reported on 83.3% of returns)
Here:
$47,133
State:
$77,331
(% of AGI for various income ranges: 1373.4% for AGIs below $25k, 4253.6% for AGIs $25k-50k, 7146.8% for AGIs $50k-75k, 10637.1% for AGIs $75k-100k, 19055.6% for AGIs $100k-200k, 54767.5% for AGIs over 200k)
Taxable interest for individuals: $704 (reported on 27.9% of returns)
This zip code:
$704
California:
$2,294
(% of AGI for various income ranges: 11.8% for AGIs below $25k, 13.7% for AGIs $25k-50k, 39.2% for AGIs $50k-75k, 47.1% for AGIs $75k-100k, 99.6% for AGIs $100k-200k, 402.5% for AGIs over 200k)
Ordinary dividends: $3,449 (reported on 11.2% of returns)
Here:
$3,449
State:
$10,949
(% of AGI for various income ranges: 21.4% for AGIs below $25k, 19.3% for AGIs $25k-50k, 53.2% for AGIs $50k-75k, 100.8% for AGIs $75k-100k, 207.9% for AGIs $100k-200k, 1685.0% for AGIs over 200k)
Net capital gain/loss in AGI: +$9,931 (reported on 11.4% of returns)
Here:
+$9,931
State:
+$49,306
(% of AGI for various income ranges: 1.9% for AGIs below $25k, 6.7% for AGIs $25k-50k, 47.9% for AGIs $50k-75k, 127.8% for AGIs $75k-100k, 564.2% for AGIs $100k-200k, 17300.0% for AGIs over 200k)
Profit/loss from business: +$10,248 (reported on 13.0% of returns)
Here:
+$10,248
State:
+$15,671
(% of AGI for various income ranges: 118.0% for AGIs below $25k, 164.1% for AGIs $25k-50k, 153.2% for AGIs $50k-75k, 275.4% for AGIs $75k-100k, 411.6% for AGIs $100k-200k, 4515.0% for AGIs over 200k)
Taxable individual retirement arrangement distribution: $16,364 (reported on 5.6% of returns)
93041:
$16,364
California:
$23,505
(% of AGI for various income ranges: 40.7% for AGIs below $25k, 63.3% for AGIs $25k-50k, 151.5% for AGIs $50k-75k, 242.5% for AGIs $75k-100k, 504.7% for AGIs $100k-200k, 2520.0% for AGIs over 200k)
Total itemized deductions: $26,850 (reported on 10.5% of returns)
Here:
$26,850
State:
$39,517
(% of AGI for various income ranges: 83.8% for AGIs below $25k, 137.5% for AGIs $25k-50k, 480.7% for AGIs $50k-75k, 885.7% for AGIs $75k-100k, 1796.7% for AGIs $100k-200k, 7077.5% for AGIs over 200k)
Charity contributions: $4,377 (reported on 8.1% of returns)
Here:
$4,377
State:
$12,598
(% of AGI for various income ranges: 4.4% for AGIs below $25k, 12.9% for AGIs $25k-50k, 55.0% for AGIs $50k-75k, 99.1% for AGIs $75k-100k, 257.5% for AGIs $100k-200k, 1345.0% for AGIs over 200k)
Taxes paid: $7,721 (reported on 10.5% of returns)
93041:
$7,721
State:
$8,807
(% of AGI for various income ranges: 18.2% for AGIs below $25k, 34.3% for AGIs $25k-50k, 125.6% for AGIs $50k-75k, 274.9% for AGIs $75k-100k, 575.6% for AGIs $100k-200k, 1825.0% for AGIs over 200k)
Earned income credit: $2,097 (reported on 17.3% of returns)
Here:
$2,097
State:
$2,074
(% of AGI for various income ranges: 96.7% for AGIs below $25k, 80.4% for AGIs $25k-50k, 1.7% for AGIs $50k-75k)
Percentage of individuals using paid preparers for their 2020 taxes: 93.1%
Here:
93%
State:
92%
(% for various income ranges: 92.4% for AGIs below $25k, 93.7% for AGIs $25k-50k, 93.6% for AGIs $50k-75k, 93.2% for AGIs $75k-100k, 92.0% for AGIs $100k-200k, 93.3% for AGIs over 200k)
Averages for the 2012 tax year for zip code 93041, filed in 2013:
Average Adjusted Gross Income (AGI) in 2012: $41,869 (Individual Income Tax Returns)
Here:
$41,869
State:
$72,726
Salary/wage: $38,197 (reported on 85.8% of returns)
Here:
$38,197
State:
$59,079
(% of AGI for various income ranges: 79.8% for AGIs below $25k, 84.1% for AGIs $25k-50k, 78.4% for AGIs $50k-75k, 76.3% for AGIs $75k-100k, 75.5% for AGIs $100k-200k, 56.9% for AGIs over 200k)
Taxable interest for individuals: $781 (reported on 27.8% of returns)
This zip code:
$781
California:
$2,146
(% of AGI for various income ranges: 0.6% for AGIs below $25k, 0.5% for AGIs $25k-50k, 0.5% for AGIs $50k-75k, 0.3% for AGIs $75k-100k, 0.4% for AGIs $100k-200k, 1.5% for AGIs over 200k)
Ordinary dividends: $2,920 (reported on 10.6% of returns)
Here:
$2,920
State:
$9,308
(% of AGI for various income ranges: 0.8% for AGIs below $25k, 0.4% for AGIs $25k-50k, 0.7% for AGIs $50k-75k, 0.9% for AGIs $75k-100k, 1.0% for AGIs $100k-200k, 1.2% for AGIs over 200k)
Net capital gain/loss in AGI: +$2,392 (reported on 8.7% of returns)
Here:
+$2,392
State:
+$30,460
(% of AGI for various income ranges: 0.2% for AGIs $25k-50k, 0.2% for AGIs $50k-75k, 0.3% for AGIs $75k-100k, 1.2% for AGIs $100k-200k, 3.5% for AGIs over 200k)
Profit/loss from business: +$8,127 (reported on 11.9% of returns)
Here:
+$8,127
State:
+$17,064
(% of AGI for various income ranges: 5.0% for AGIs below $25k, 2.5% for AGIs $25k-50k, 1.8% for AGIs $50k-75k, 1.8% for AGIs $75k-100k, 1.7% for AGIs $100k-200k)
Taxable individual retirement arrangement distribution: $12,298 (reported on 6.2% of returns)
93041:
$12,298
California:
$19,557
(% of AGI for various income ranges: 1.6% for AGIs below $25k, 1.2% for AGIs $25k-50k, 1.6% for AGIs $50k-75k, 2.1% for AGIs $75k-100k, 3.1% for AGIs $100k-200k)
Total itemized deductions: $21,188 (28% of AGI, reported on 25.3% of returns)
Here:
$21,188
State:
$34,004
Here:
28.1% of AGI
State:
22.7% of AGI
(% of AGI for various income ranges: 7.6% for AGIs below $25k, 8.3% for AGIs $25k-50k, 14.0% for AGIs $50k-75k, 15.9% for AGIs $75k-100k, 17.4% for AGIs $100k-200k, 17.3% for AGIs over 200k)
Charity contributions: $2,222 (reported on 20.3% of returns)
Here:
$2,222
State:
$4,659
(% of AGI for various income ranges: 0.4% for AGIs below $25k, 0.6% for AGIs $25k-50k, 1.2% for AGIs $50k-75k, 1.4% for AGIs $75k-100k, 1.7% for AGIs $100k-200k, 1.6% for AGIs over 200k)
Taxes paid: $6,121 (reported on 25.2% of returns)
93041:
$6,121
State:
$14,448
(% of AGI for various income ranges: 1.4% for AGIs below $25k, 1.8% for AGIs $25k-50k, 3.7% for AGIs $50k-75k, 4.6% for AGIs $75k-100k, 6.2% for AGIs $100k-200k, 7.3% for AGIs over 200k)
Earned income credit: $2,253 (reported on 23.6% of returns)
Here:
$2,253
State:
$2,286
(% of AGI for various income ranges: 6.8% for AGIs below $25k, 1.4% for AGIs $25k-50k)
Percentage of individuals using paid preparers for their 2012 taxes: 63.2%
Here:
63%
State:
64%
(% for various income ranges: 61.5% for AGIs below $25k, 62.6% for AGIs $25k-50k, 65.5% for AGIs $50k-75k, 66.7% for AGIs $75k-100k, 66.7% for AGIs $100k-200k, 66.7% for AGIs over 200k)
Averages for the 2004 tax year for zip code 93041, filed in 2005:
Average Adjusted Gross Income (AGI) in 2004: $38,681 (Individual Income Tax Returns)
Here:
$38,681
State:
$58,600
Salary/wage: $36,092 (reported on 86.4% of returns)
Here:
$36,092
State:
$49,455
(% of AGI for various income ranges: 126.2% for AGIs below $10k, 81.6% for AGIs $10k-25k, 85.9% for AGIs $25k-50k, 83.9% for AGIs $50k-75k, 82.8% for AGIs $75k-100k, 62.2% for AGIs over 100k)
Taxable interest for individuals: $1,201 (reported on 38.1% of returns)
This zip code:
$1,201
California:
$2,365
(% of AGI for various income ranges: 5.7% for AGIs below $10k, 1.4% for AGIs $10k-25k, 0.9% for AGIs $25k-50k, 0.8% for AGIs $50k-75k, 1.4% for AGIs $75k-100k, 1.6% for AGIs over 100k)
Taxable dividends: $1,962 (reported on 14.9% of returns)
Here:
$1,962
State:
$4,746
(% of AGI for various income ranges: 4.5% for AGIs below $10k, 1.0% for AGIs $10k-25k, 0.5% for AGIs $25k-50k, 0.7% for AGIs $50k-75k, 0.7% for AGIs $75k-100k, 1.0% for AGIs over 100k)
Net capital gain/loss: +$6,192 (reported on 11.8% of returns)
Here:
+$6,192
State:
+$23,418
(% of AGI for various income ranges: -3.8% for AGIs below $10k, -0.0% for AGIs $10k-25k, -0.0% for AGIs $25k-50k, 0.5% for AGIs $50k-75k, 0.8% for AGIs $75k-100k, 9.5% for AGIs over 100k)
Profit/loss from business: +$10,540 (reported on 11.3% of returns)
Here:
+$10,540
State:
+$16,826
(% of AGI for various income ranges: 3.4% for AGIs below $10k, 4.1% for AGIs $10k-25k, 2.2% for AGIs $25k-50k, 1.8% for AGIs $50k-75k, 0.9% for AGIs $75k-100k, 7.1% for AGIs over 100k)
IRA payment deduction: $2,542 (reported on 2.4% of returns)
93041:
$2,542
California:
$3,192
(% of AGI for various income ranges: 0.2% for AGIs $10k-25k, 0.2% for AGIs $25k-50k, 0.2% for AGIs $50k-75k, 0.2% for AGIs $75k-100k, 0.1% for AGIs over 100k)
Self-employed pension: $18,351 (reported on 0.4% of returns)
Here:
$18,351
California:
$17,688
Total itemized deductions: $19,810 (31% of AGI, reported on 31.5% of returns)
Here:
$19,810
State:
$28,113
Here:
31.3% of AGI
State:
25.3% of AGI
(% of AGI for various income ranges: 24.5% for AGIs below $10k, 11.2% for AGIs $10k-25k, 13.6% for AGIs $25k-50k, 18.4% for AGIs $50k-75k, 19.3% for AGIs $75k-100k, 17.6% for AGIs over 100k)
Charity contributions deductions: $2,088 (3% of AGI, reported on 27.7% of returns)
Here:
$2,088
State:
$3,923
Here:
3.2% of AGI
State:
3.3% of AGI
(% of AGI for various income ranges: 1.5% for AGIs below $10k, 0.8% for AGIs $10k-25k, 1.1% for AGIs $25k-50k, 1.7% for AGIs $50k-75k, 1.9% for AGIs $75k-100k, 2.0% for AGIs over 100k)
Total tax: $4,709 (reported on 68.0% of returns)
93041:
$4,709
State:
$10,761
(% of AGI for various income ranges: 3.1% for AGIs below $10k, 3.0% for AGIs $10k-25k, 5.2% for AGIs $25k-50k, 8.0% for AGIs $50k-75k, 10.4% for AGIs $75k-100k, 16.2% for AGIs over 100k)
Earned income credit: $1,771 (reported on 20.2% of returns)
Here:
$1,771
State:
$1,763
Percentage of individuals using paid preparers for their 2004 taxes: 70.1%
Here:
70%
State:
66%
(% for various income ranges: 63.5% for AGIs below $10k, 73.9% for AGIs $10k-25k, 70.3% for AGIs $25k-50k, 69.4% for AGIs $50k-75k, 68.2% for AGIs $75k-100k, 69.2% for AGIs over 100k)
Household received Food Stamps/SNAP in the past 12 months: 1,055 Household did not receive Food Stamps/SNAP in the past 12 months: 6,525
Women who had a birth in the past 12 months: 606 (404 now married, 202 unmarried) Women who did not have a birth in the past 12 months: 4,832 (2,163 now married, 2,658 unmarried)
Housing units in zip code 93041 with a mortgage: 2,337 (113 second mortgage, 4 home equity loan, 100 both second mortgage and home equity loan) Median monthly owner costs for units with a mortgage: $2,262 Median monthly owner costs for units without a mortgage: $704
Residents with income below the poverty level in 2022:
This zip code:
12.6%
Whole state:
12.2%
Residents with income below 50% of the poverty level in 2022:
This zip code:
6.2%
Whole state:
6.2%
Median number of rooms in houses and condos:
Here:
5.5
State:
6.0
Median number of rooms in apartments:
Here:
4.4
State:
3.9
Notable locations in this zip code not listed on our city pages
2,543 married couples with children.
1,997 single-parent households (589 men, 1,408 women).
54.7% of residents of 93041 zip code speak English at home.
41.0% of residents speak Spanish at home (58% very well, 12% well, 18% not well, 11% not at all).
0.6% of residents speak other Indo-European language at home (47% very well, 21% well, 26% not well, 6% not at all).
1.5% of residents speak Asian or Pacific Island language at home (53% very well, 42% well, 5% not well).
2.0% of residents speak other language at home (87% very well, 1% well, 1% not well, 11% not at all).
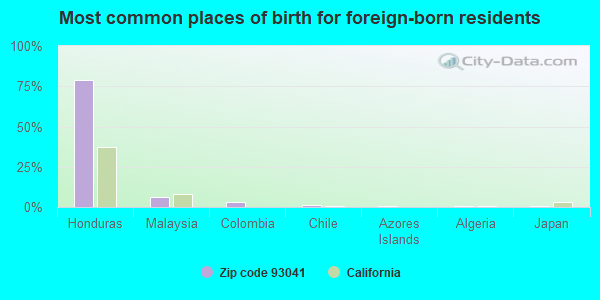
Foreign born population: 5,458 (23.8%) (54.5% of them are naturalized citizens)
This zip code:
23.8%
Whole state:
26.7%
79%Honduras
6%Malaysia
3%Colombia
1%Chile
1%Azores Islands
1%Algeria
1%Japan
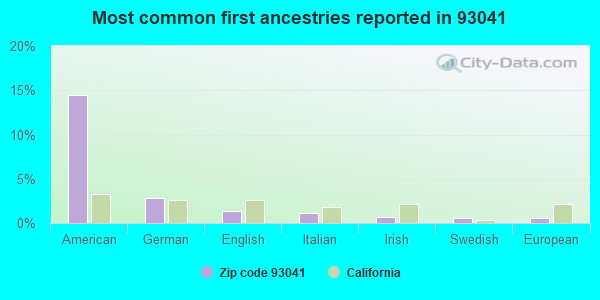
14%American
3%German
1%English
1%Italian
1%Irish
1%Swedish
1%European
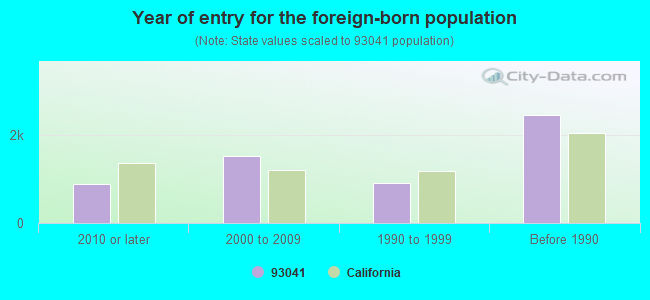
Year of entry for the foreign-born population
8932010 or later
1,5362000 to 2009
9151990 to 1999
2,465Before 1990
Major facilities with environmental interests located in this zip code:
MANDALAY VILLAGE CLEANERS (633 W CHANNEL ISLAND BLVD in PORT HUENEME, CA)
STATE MASTER (California - Hazardous Waste Tracking) - HAZARDOU WASTE PROGRAM Small Quantity Generators, between 100 kg and 1000 kg of hazardous waste/month (Resource Conservation and Recovery Act (tracking hazardous waste)) - notification Organizations: RAUL KHANTZIS (CONTACT/OWNER)
CALIFORNIA AIR NATIONAL GUARD (4146 NAVALAIR ROAD in PORT HUENEME, CA) . Federal Facility. U.S. AIR FORCE
STATE MASTER (California - Hazardous Waste Tracking) - HAZARDOU WASTE PROGRAM CRITERIA AND HAZARDOUS AIR POLLUTANT INVENTORY (Inventory of air pollution sources) Small Quantity Generators, between 100 kg and 1000 kg of hazardous waste/month (Resource Conservation and Recovery Act (tracking hazardous waste)) - notification Business SIC classification: NATIONAL SECURITY Organizations: USAF (CONTACT/OWNER)
Alternative names: AIR NATIONAL GUARD , CALIFORNIA AIR NATIONAL GUARD-CHANNEL ISLANDS, USAF CHANNEL ISLANDS A N G B
HUENEME ELEMENTARY (344 N. THIRD ST. in PORT HUENEME, CA)
(National Center for Education Statistics) - STATE ID-6055073
BARD (RICHARD) ELEMENTARY (622 E. PLEASANT VALLEY ROAD in PORT HUENEME, CA)
(National Center for Education Statistics) - STATE ID-6055107 Organizations: HUENEME ELEMENTARY (SCHOOL DISTRICT)
APS SYSTEMS (130 W CLARA ST in PORT HUENEME, CA)
Small Quantity Generators, between 100 kg and 1000 kg of hazardous waste/month (Resource Conservation and Recovery Act (tracking hazardous waste)) Small Quantity Generators, between 100 kg and 1000 kg of hazardous waste/month (Resource Conservation and Recovery Act (tracking hazardous waste)) Alternative names: KTI MILLER INC
HUENEME BOAT WORKS (751 INDUSTRIAL WAY in PORT HUENEME, CA)
CRITERIA AND HAZARDOUS AIR POLLUTANT INVENTORY (Inventory of air pollution sources) TRANSPORTER (Resource Conservation and Recovery Act (tracking hazardous waste)) Business SIC classification: BOAT BUILDING AND REPAIRING Organizations: WITHERSPOON GRANT (CONTACT/OWNER)
Alternative names: HOBBS DROP BOX SERVICE INC
CHANNEL ISLAND MARINE RESOURCE (432 W PORT HUENEME RD in PORT HUENEME, CA)
National Pollutant Discharge Elimination System NON-MAJOR (Tracking pollutant discharge elimination systems) - permit Business SIC classification: MISCELLANEOUS MARINE PRODUCTS (PLANT AQUACULTURE)
JIM DANDY DISCOUNT (715 W CHANNEL IS in PORT HUENEME, CA)
Small Quantity Generators, between 100 kg and 1000 kg of hazardous waste/month (Resource Conservation and Recovery Act (tracking hazardous waste)) - notification Organizations: CHARLES AND BRENDA IRVING (CONTACT/OWNER)
MARINE SPILL RESPONSE CORP (319 PONOMA ST in PORT HUENEME, CA)
Small Quantity Generators, between 100 kg and 1000 kg of hazardous waste/month (Resource Conservation and Recovery Act (tracking hazardous waste)) - notification
CHANNEL ISLAND OCEAN FARMS (SW JELLY OF PORT HUENEME in PORT HUENEME, CA)
National Pollutant Discharge Elimination System MAJOR (Tracking pollutant discharge elimination systems) - permit Business SIC classification: ANIMAL AQUACULTURE Organizations: AQUA DULCE PARTNERS, INC (CONTACT/OWNER)
Alternative names: AQUA DULCE PARTNERS, INC
NL BAROID PORT HUENEME SERVICE CENTER (PORT HUENEME COMMERCIAL DOCK in PORT HUENEME, CA)
Small Quantity Generators, between 100 kg and 1000 kg of hazardous waste/month (Resource Conservation and Recovery Act (tracking hazardous waste))
MANSON CONSTRUCTION & ENGINEERING (VENTURA CHANNEL ISLAND in PORT HUENEME, CA)
CRITERIA AND HAZARDOUS AIR POLLUTANT INVENTORY (Inventory of air pollution sources) Business SIC classification: HEAVY CONSTRUCTION Alternative names: MANSON CONSTRUCTION & ENG., MASON CONSTUCT & ENGINEER CO.
CHEVRON #9-3513 (351 E. CHANNEL ISLANDS BLVD. in PORT HUENEME, CA)
CRITERIA AND HAZARDOUS AIR POLLUTANT INVENTORY (Inventory of air pollution sources) Business SIC classification: GASOLINE SERVICE STATIONS
Housing units lacking complete plumbing facilities: 0.4% Housing units lacking complete kitchen facilities: 2.6%
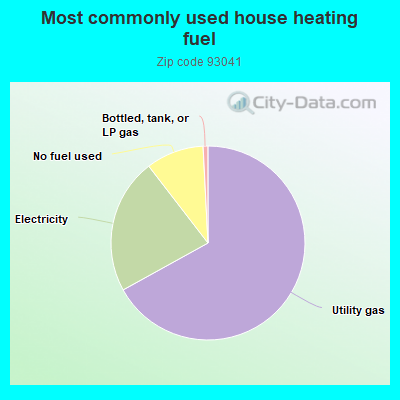
66.7%Utility gas
22.5%Electricity
9.6%No fuel used
0.8%Bottled, tank, or LP gas
Population in 1990: 17,337. Population change in the 1990s: +8,280 (+47.8%).
Place of birth for U.S.-born residents:
This state: 12,405
Northeast: 828
Midwest: 916
South: 1,710
West: 1,109
38% of the 93041 zip code residents lived in the same house 5 years ago. Out of people who lived in different houses, 53% lived in this county. Out of people who lived in different counties, 50% lived in California.
90% of the 93041 zip code residents lived in the same house 1 year ago. Out of people who lived in different houses, 40% moved from this county. Out of people who lived in different houses, 32% moved from different county within same state. Out of people who lived in different houses, 22% moved from different state. Out of people who lived in different houses, 8% moved from abroad.
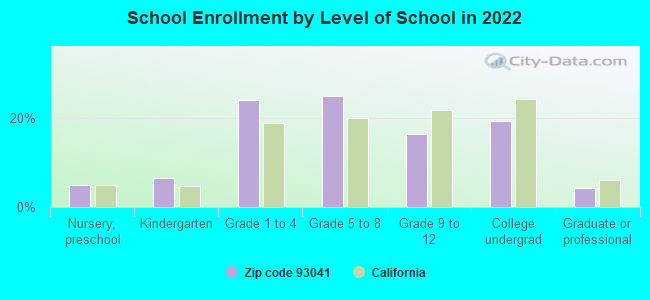
Private vs. public school enrollment:
Students in private schools in grades 1 to 8 (elementary and middle school): 173
Here:
6.8%
California:
10.5%
Students in private schools in grades 9 to 12 (high school): 68
Here:
8.0%
California:
8.5%
Students in private undergraduate colleges: 111
Here:
11.0%
California:
15.9%
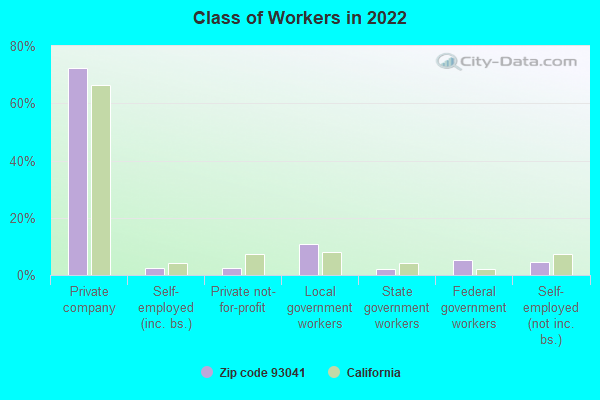
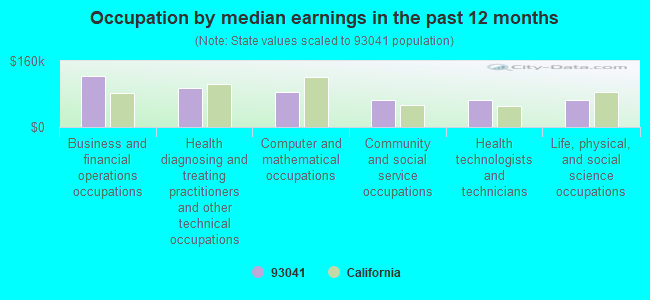
Occupation by median earnings in the past 12 months ($)
124,072Business and financial operations occupations
93,359Health diagnosing and treating practitioners and other technical occupations
84,090Computer and mathematical occupations
66,107Community and social service occupations
65,111Health technologists and technicians
65,107Life, physical, and social science occupations
Companies with biggest federal contracts located in this zip code (PORT HUENEME, CA):
ADVANTEDGE TECHNOLOGY INC (2675 N VENTURA ROAD, STE) : $6,197,268 in 60 contractsfrom 2004 to 2006
Contracts for Engineering and Technical Services, Systems Engineering Services, Telecommunications Network Management Services by Navy Signed by year:2000: $0; 2001: $0; 2002: $0; 2003: $0; 2004: $598,191; 2005: $3,043,076; 2006: $2,556,001.
Biggest contracts:
$720,000 with Navy for Engineering and Technical Services. Signed on 2006-03-27. Completion date: 2006-08-05.
$502,750 with Navy for Systems Engineering Services. Signed on 2005-05-13. Completion date: 2005-11-14.
$433,048 with Navy for Engineering and Technical Services. Signed on 2006-05-17. Completion date: 2008-04-30.
$420,000, same as above.Signed on 2006-02-13. Completion date: 2006-08-05.
CITY OF PORT HUENEME (250 NORTH VENTURA ROAD) : $5,333,018 in 30 contractsfrom 2003 to 2006
Contracts for Waste Treatment and Storage, Maintenance, Repair or Alteration of Real Property -- Other Non-Building Facilities, Trash/Garbage Collection Services - Including Portable Sanitation Services, Water Services, and moreby Navy Signed by year:2000: $0; 2001: $0; 2002: $0; 2003: $1,251,072; 2004: $2,303,532; 2005: $1,493,803; 2006: $284,611.
Biggest contracts:
$1,266,264 with Navy for Waste Treatment and Storage. Signed on 2004-10-25. Completion date: 2004-10-31.
$1,251,072 with Navy for Maintenance, Repair or Alteration of Real Property -- Other Non-Building Facilities. Signed on 2003-10-31. Completion date: 2004-10-31.
$484,775 with Navy for Trash/Garbage Collection Services - Including Portable Sanitation Services. Signed on 2005-03-10. Completion date: 2005-09-30.
$345,000 with Navy for Water Services. Signed on 2005-03-22. Completion date: 2005-10-31.
PORT HUENEME, CITY OF (700 E HUENEME RD BLDG B) : $3,353,826 in 45 contractsfrom 1999 to 2003
Contracts for Maintenance, Repair or Alteration of Real Property -- Other Non-Building Facilities, Trash/Garbage Collection Services - Including Portable Sanitation Services by Navy Signed by year:2000: $622,080; 2001: $1,018,108; 2002: $1,112,367; 2003: $542,192; 2004: $0; 2005: $0; 2006: $0.
Biggest contracts:
$515,827 with Navy for Maintenance, Repair or Alteration of Real Property -- Other Non-Building Facilities. Signed on 2001-06-05. Completion date: 2002-04-30.
$502,073, same as above.Signed on 2002-03-26. Completion date: 2003-04-30.
$370,583, same as above.Signed on 2000-05-01. Completion date: 2001-04-30.
$282,984, same as above.Signed on 2003-09-23. Completion date: 2004-06-01.
JOHN J MCMULLEN ASSOCIATES, IN (266 E SCOTT ST; small business) : $2,967,504 in 10 contractsfrom 2002 to 2005
Contracts for Engineering and Technical Services by Navy Signed by year:2000: $0; 2001: $0; 2002: $49,983; 2003: $0; 2004: $1,145,914; 2005: $1,771,607; 2006: $0.
Biggest contracts:
$441,957 with Navy for Engineering and Technical Services. Signed on 2005-11-23. Completion date: 2006-02-28.
$382,031, same as above.Signed on 2004-07-07. Completion date: 2005-04-06.
$382,031, same as above.Signed on 2004-09-27. Completion date: 2005-04-06.
$381,852, same as above.Signed on 2005-01-06. Completion date: 2005-04-06.
RECP/WINDSOR HUENEME VENTURE L (350 E HUENEME RD; small business) : $609,019 in 167 contractsfrom 2003 to 2006
Contracts for Lodging - Hotel/Motel, Lease or Rental of Facilities -- Troop Housing Facilities, Other Professional Services by Army, Navy Signed by year:2000: $0; 2001: $0; 2002: $0; 2003: $35,351; 2004: $205,444; 2005: $246,953; 2006: $121,271.
Biggest contracts:
$33,858 with Army for Lodging - Hotel/Motel. Signed on 2005-06-22. Completion date: 2005-07-05.
$27,648, same as above.Signed on 2006-01-23. Completion date: 2006-02-04.
$21,804, same as above.Signed on 2004-09-09. Completion date: 2004-09-22.
$18,810 with Navy for Lease or Rental of Facilities -- Troop Housing Facilities. Signed on 2005-02-02. Completion date: 2005-02-10.
MAYCO FABRICATION (1616 5TH PLACE; small business) : $518,507 in 13 contractsfrom 2000 to 2003
Contracts for Maintenance, Repair and Rebuilding of Equipment -- Miscellaneous, Maintenance, Repair and Rebuilding of Equipment -- Ships, Small Craft, Pontoons, and Floating Docks, Facilities Operations Support Services, Maintenance, Repair or Alteration of Real Property -- Fuel Supply Facilities, and moreby Navy Signed by year:2000: $121,355; 2001: $73,255; 2002: $259,576; 2003: $64,321; 2004: $0; 2005: $0; 2006: $0.
Biggest contracts:
$213,617 with Navy for Maintenance, Repair and Rebuilding of Equipment -- Miscellaneous. Signed on 2002-05-21. Completion date: 2002-09-20.
$57,700 with Navy for Maintenance, Repair and Rebuilding of Equipment -- Ships, Small Craft, Pontoons, and Floating Docks. Signed on 2000-06-30. Completion date: 2000-07-21.
$43,695 with Navy for Facilities Operations Support Services. Signed on 2001-03-22. Completion date: 2001-05-02.
$39,670 with Navy for Maintenance, Repair or Alteration of Real Property -- Fuel Supply Facilities. Signed on 2000-09-22. Completion date: 2000-11-24.
V RENEE MACK CONSULTING (567 W CHANNEL ISLANDS BLV; small business) : $159,274 in 5 contractsfrom 2000 to 2004
Contracts for Other Professional Services, Other Management Support Services by Navy Signed by year:2000: $149,624; 2001: $0; 2002: $0; 2003: $9,650; 2004: $0; 2005: $0; 2006: $0.
Biggest contracts:
$149,624 with Navy for Other Professional Services. Signed on 2000-02-29. Completion date: 2001-03-14.
$3,941, same as above.Signed on 2003-01-29. Completion date: 2003-02-28.
$3,409, same as above.Signed on 2003-02-26. Completion date: 2003-02-28.
$2,300, same as above.Signed on 2003-04-17. Completion date: 2003-02-28.
SOUTH COAST MARINE SERVICES (417 EAST PORT HUENEME RD ,; small business) : $105,000 in 4 contractsfrom 1999 to 2004
$65,000 with Navy for Navigational Aid and Pilotage Services. Signed on 1999-10-01. Completion date: 2000-09-30.
$15,000 with Navy for Other Professional Services. Signed on 2003-09-29. Completion date: 2004-09-30.
$15,000, same as above.Signed on 2002-10-01. Completion date: 2003-09-30.
$10,000 with Navy for Navigational Aid and Pilotage Services. Signed on 2004-10-15. Completion date: 2005-09-30.
B & C WELDING INC (800 INDUSTRIAL AVE; small business)
$25,597 with Navy for Engineering and Technical Services. Signed on 2002-05-17. Completion date: 2002-07-31.
WALTER W CARD INC (241 E HUENEME RD; small business) : $23,479 in 13 contractsfrom 2003 to 2005
Contracts for Gases: Compressed and Liquefied, Gas Services by Navy Signed by year:2000: $0; 2001: $0; 2002: $0; 2003: $7,503; 2004: $330; 2005: $15,646; 2006: $0.
Biggest contracts:
$10,080 with Navy for Gases: Compressed and Liquefied. Signed on 2005-07-07. Completion date: 2005-07-18.
$4,680 with Navy for Gas Services. Signed on 2005-09-30. Completion date: 2006-09-30.
$4,250, same as above.Signed on 2003-11-05. Completion date: 2003-11-06.
$2,952, same as above.Signed on 2003-12-30. Completion date: 2004-09-30.
Top industries in this zip code by the number of employees in 2005:
2005 - 2018 National Fire Incident Reporting System (NFIRS) incidents
Based on the data from the years 2005 - 2018 the average number of fire incidents per year is 49. The highest number of reported fires - 78 took place in 2018, and the least - 23 in 2006. The data has an increasing trend.
When looking into fire subcategories, the most incidents belonged to: Outside Fires (42.3%), and Structure Fires (33.9%).
Fire incident types reported to NFIRS in Zip Code 93041


 Nearest zip codes: 93033, 93043, 93010, 93030, 93012, 93035.
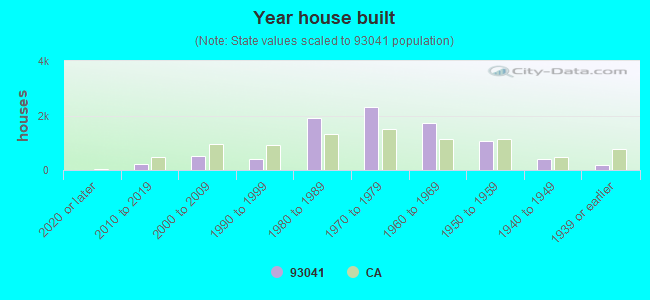


 Based on the data from the years 2005 - 2018 the average number of fire incidents per year is 49. The highest number of reported fires - 78 took place in 2018, and the least - 23 in 2006. The data has an increasing trend.
 When looking into fire subcategories, the most incidents belonged to: Outside Fires (42.3%), and Structure Fires (33.9%).