Estimated zip code population in 2022: 1,198 Zip code population in 2010: 1,348 Zip code population in 2000: 1,048
Houses and condos: 361 Renter-occupied apartments: 192
% of renters here:
64%
State:
44%
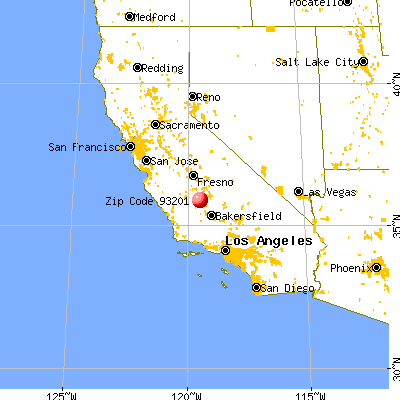
March 2022 cost of living index in zip code 93201: 91.6 (less than average, U.S. average is 100)
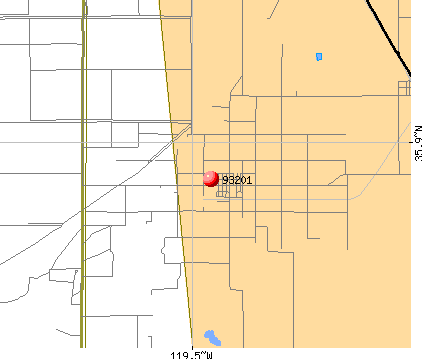
Land area: 77.4 sq. mi. Water area: 0.0 sq. mi.
Population density: 15 people per square mile
(very low).
OSM Map
General Map
Google Map
MSN Map
OSM Map
General Map
Google Map
MSN Map
OSM Map
General Map
Google Map
MSN Map
OSM Map
General Map
Google Map
MSN Map
Please wait while loading the map...
Real estate property taxes paid for housing units in 2022:
This zip code:
0.9% ($892)
California:
0.7% ($4,831)
Median real estate property taxes paid for housing units with mortgages in 2022: $1,291 (1.0%) Median real estate property taxes paid for housing units with no mortgage in 2022: $522 (0.6%)
Business Search- 14 Million verified businesses
Males: 558
(46.5%)
Females: 640
(53.5%)
For population 25 years and over in 93201:
High school or higher: 48.7%
Bachelor's degree or higher: 1.5%
Graduate or professional degree: 0.0%
Unemployed: 14.7%
Mean travel time to work (commute): 30.5 minutes
For population 15 years and over in 93201:
Never married: 35.3%
Now married: 54.1%
Separated: 2.2%
Widowed: 2.1%
Divorced: 6.3%
Zip code 93201 compared to state average:
Median household income below state average.
Median house value significantly below state average.
Unemployed percentage above state average.
Black race population percentage significantly below state average.
Hispanic race population percentage above state average.
Median age significantly below state average.
Length of stay since moving in significantly above state average.
Number of college students below state average.
Percentage of population with a bachelor's degree or higher significantly below state average.
Estimated median house/condo value in 2022: $96,206
93201:
$96,206
California:
$715,900
According to our research of California and other state lists, there was 1 registered sex offender living in 93201 zip code as of May 28, 2024. The ratio of all residents to sex offenders in zip code 93201 is 1,332 to 1. The ratio of registered sex offenders to all residents in this zip code is lower than the state average.
Median resident age:
This zip code:
24.4 years
California median age:
37.9 years
Average household size:
This zip code:
4.0 people
California:
2.8 people
Averages for the 2004 tax year for zip code 93201, filed in 2005:
Average Adjusted Gross Income (AGI) in 2004: $27,837 (Individual Income Tax Returns)
Here:
$27,837
State:
$58,600
Salary/wage: $21,131 (reported on 89.6% of returns)
Here:
$21,131
State:
$49,455
(% of AGI for various income ranges: 87.5% for AGIs below $10k, 80.2% for AGIs $10k-25k, 81.8% for AGIs $25k-50k, 85.7% for AGIs $50k-75k, 32.2% for AGIs $75k-100k)
Taxable interest for individuals: $280 (reported on 17.3% of returns)
This zip code:
$280
California:
$2,365
Profit/loss from business: +$9,190 (reported on 7.3% of returns)
Here:
+$9,190
State:
+$16,826
Profit/loss from farming: +$1,667 (reported on 4.2% of returns)
Here:
+$1,667
State:
-$7,562
Total itemized deductions: $18,760 (30% of AGI, reported on 8.7% of returns)
Here:
$18,760
State:
$28,113
Here:
29.9% of AGI
State:
25.3% of AGI
Charity contributions deductions: $2,000 (3% of AGI, reported on 5.2% of returns)
Here:
$2,000
State:
$3,923
Here:
3.0% of AGI
State:
3.3% of AGI
Total tax: $4,197 (reported on 47.4% of returns)
93201:
$4,197
State:
$10,761
(% of AGI for various income ranges: 1.4% for AGIs below $10k, 2.9% for AGIs $10k-25k, 3.9% for AGIs $25k-50k, 8.5% for AGIs $50k-75k, 14.9% for AGIs $75k-100k)
Earned income credit: $2,250 (reported on 44.3% of returns)
Here:
$2,250
State:
$1,763
Percentage of individuals using paid preparers for their 2004 taxes: 74.7%
Here:
75%
State:
66%
(% for various income ranges: 75.4% for AGIs below $10k, 78.3% for AGIs $10k-25k, 67.1% for AGIs $25k-50k, 71.4% for AGIs $50k-75k, 85.7% for AGIs $75k-100k)
Household received Food Stamps/SNAP in the past 12 months: 84 Household did not receive Food Stamps/SNAP in the past 12 months: 228
Women who had a birth in the past 12 months: 34 (24 now married, 10 unmarried) Women who did not have a birth in the past 12 months: 220 (134 now married, 84 unmarried)
Housing units in zip code 93201 with a mortgage: 40 Median monthly owner costs for units with a mortgage: $1,514 Median monthly owner costs for units without a mortgage: $496
Residents with income below the poverty level in 2022:
This zip code:
37.1%
Whole state:
12.2%
Residents with income below 50% of the poverty level in 2022:
This zip code:
35.3%
Whole state:
6.2%
Median number of rooms in houses and condos:
Here:
4.9
State:
6.0
Median number of rooms in apartments:
Here:
4.3
State:
3.9
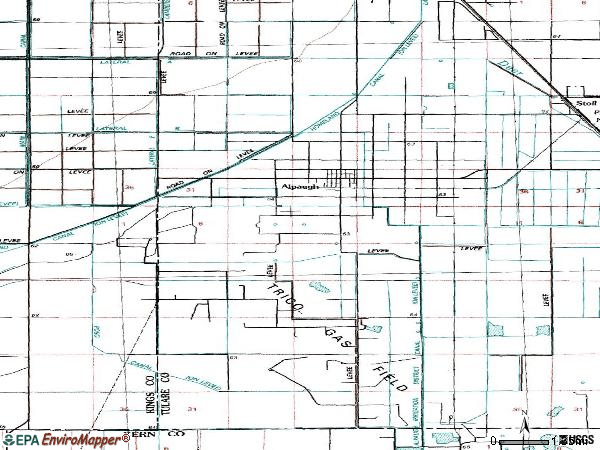
Notable locations in this zip code not listed on our city pages
Notable locations in zip code 93201: Bent Ranch (A), Tulare County Fire Department Battalion 2 Alpaugh Fire Station 9 (B). Display/hide their locations on the map
Size of family households: 47 2-persons, 26 3-persons, 52 4-persons, 22 5-persons, 60 6-persons, 28 7-or-more-persons
Size of nonfamily households: 50 1-person, 11 2-persons
330 married couples with children.
52 single-parent households (52 women).
20.5% of residents of 93201 zip code speak English at home.
79.3% of residents speak Spanish at home (17% very well, 47% well, 18% not well, 18% not at all).
0.4% of residents speak other Indo-European language at home (100% well).
0.5% of residents speak Asian or Pacific Island language at home (100% well).
Foreign born population: 403 (33.7%) (15.0% of them are naturalized citizens)
This zip code:
33.7%
Whole state:
26.7%
96%Honduras
1%Indonesia
1%Costa Rica
2%English
1%German
1%Irish
1%Italian
0%Danish
0%American
Year of entry for the foreign-born population
1272010 or later
1322000 to 2009
781990 to 1999
76Before 1990
Facilities with environmental interests located in this zip code:
ALPAUGH ELEMENTARY (5 CENTER & WILBUR in ALPAUGH, CA)
(National Center for Education Statistics) - STATE ID-6053847 Organizations: ALPAUGH UNIFIED (SCHOOL DISTRICT)
ALPAUGH JUNIOR-SENIOR HIGH (5313 ROAD 39 in ALPAUGH, CA)
(National Center for Education Statistics) - STATE ID-5430301 Organizations: ALPAUGH UNIFIED (SCHOOL DISTRICT)
Housing units lacking complete plumbing facilities: 2.5% Housing units lacking complete kitchen facilities: 3.4%
60.7%Utility gas
25.3%Bottled, tank, or LP gas
13.1%Electricity
1.3%No fuel used
Place of birth for U.S.-born residents:
This state: 739
Northeast: 5
Midwest: 14
South: 8
West: 28
56% of the 93201 zip code residents lived in the same house 5 years ago. Out of people who lived in different houses, 60% lived in this county. Out of people who lived in different counties, 50% lived in California.
98% of the 93201 zip code residents lived in the same house 1 year ago. Out of people who lived in different houses, 40% moved from this county. Out of people who lived in different houses, 30% moved from different county within same state. Out of people who lived in different houses, 40% moved from abroad.
Private vs. public school enrollment:
Students in private schools in grades 1 to 8 (elementary and middle school):
Here:
0.0%
California:
10.5%
Students in private schools in grades 9 to 12 (high school):
Here:
0.0%
California:
8.5%
Students in private undergraduate colleges:
Here:
0.0%
California:
15.9%
Occupation by median earnings in the past 12 months ($)
53,621Transportation occupations
51,794Construction and extraction occupations
41,765Production occupations
30,618Office and administrative support occupations
25,312Farming, fishing, and forestry occupations
23,019Healthcare support occupations
Top industries in this zip code by the number of employees in 2005:
Utilities: Water Supply and Irrigation Systems (5-9 employees: 1 establishment)
Fatal accident statistics in 2014:
Fatal accident count: 1
Vehicles involved in fatal accidents: 1
Fatal accidents caused by drunken drivers: 0
Fatalities: 1
Persons involved in fatal accidents: 1
Pedestrians involved in fatal accidents: 0
Fatal accident statistics in 2012:
Fatal accident count: 2
Vehicles involved in fatal accidents: 3
Fatal accidents caused by drunken drivers: 0
Fatalities: 2
Persons involved in fatal accidents: 9
Pedestrians involved in fatal accidents: 0
Home Mortgage Disclosure Act Aggregated Statistics For Year 2009 (Based on 2 partial tracts)
A) FHA, FSA/RHS & VA Home Purchase Loans
C) Refinancings
F) Non-occupant Loans on < 5 Family Dwellings (A B C & D)
Number
Average Value
Number
Average Value
Number
Average Value
LOANS ORIGINATED
2
$130,620
3
$92,767
0
$0
APPLICATIONS APPROVED, NOT ACCEPTED
0
$0
1
$54,650
0
$0
APPLICATIONS DENIED
1
$130,620
9
$172,138
0
$0
APPLICATIONS WITHDRAWN
0
$0
3
$107,237
1
$65,120
FILES CLOSED FOR INCOMPLETENESS
0
$0
0
$0
0
$0
Aggregated Statistics For Year 2008 (Based on 2 partial tracts)
A) FHA, FSA/RHS & VA Home Purchase Loans
B) Conventional Home Purchase Loans
C) Refinancings
D) Home Improvement Loans
F) Non-occupant Loans on < 5 Family Dwellings (A B C & D)
Number
Average Value
Number
Average Value
Number
Average Value
Number
Average Value
Number
Average Value
LOANS ORIGINATED
5
$223,180
3
$252,070
5
$143,102
2
$101,940
1
$121,710
APPLICATIONS APPROVED, NOT ACCEPTED
0
$0
1
$260,080
3
$60,853
0
$0
1
$48,060
APPLICATIONS DENIED
2
$123,255
2
$217,635
9
$115,591
2
$92,830
2
$79,650
APPLICATIONS WITHDRAWN
1
$171,320
1
$22,090
3
$142,767
0
$0
0
$0
FILES CLOSED FOR INCOMPLETENESS
0
$0
1
$146,900
1
$153,880
0
$0
0
$0
Aggregated Statistics For Year 2007 (Based on 2 partial tracts)
B) Conventional Home Purchase Loans
C) Refinancings
D) Home Improvement Loans
F) Non-occupant Loans on < 5 Family Dwellings (A B C & D)
G) Loans On Manufactured Home Dwelling (A B C & D)
Number
Average Value
Number
Average Value
Number
Average Value
Number
Average Value
Number
Average Value
LOANS ORIGINATED
6
$177,520
26
$124,986
5
$85,970
3
$123,517
0
$0
APPLICATIONS APPROVED, NOT ACCEPTED
3
$145,480
6
$127,650
1
$106,200
1
$162,790
0
$0
APPLICATIONS DENIED
3
$165,633
23
$128,852
5
$89,148
3
$104,137
2
$98,840
APPLICATIONS WITHDRAWN
2
$161,825
11
$144,257
2
$179,070
1
$85,270
0
$0
FILES CLOSED FOR INCOMPLETENESS
1
$184,110
4
$179,168
0
$0
0
$0
0
$0
Aggregated Statistics For Year 2006 (Based on 2 partial tracts)
A) FHA, FSA/RHS & VA Home Purchase Loans
B) Conventional Home Purchase Loans
C) Refinancings
D) Home Improvement Loans
F) Non-occupant Loans on < 5 Family Dwellings (A B C & D)
G) Loans On Manufactured Home Dwelling (A B C & D)
Number
Average Value
Number
Average Value
Number
Average Value
Number
Average Value
Number
Average Value
Number
Average Value
LOANS ORIGINATED
0
$0
18
$122,632
25
$131,241
3
$95,607
5
$123,412
1
$73,640
APPLICATIONS APPROVED, NOT ACCEPTED
0
$0
5
$93,490
7
$132,006
0
$0
1
$140,700
0
$0
APPLICATIONS DENIED
0
$0
14
$123,506
23
$170,106
12
$65,472
5
$92,792
2
$36,820
APPLICATIONS WITHDRAWN
1
$51,160
3
$131,527
20
$153,451
2
$109,885
2
$65,505
1
$51,160
FILES CLOSED FOR INCOMPLETENESS
0
$0
2
$123,450
3
$180,103
0
$0
0
$0
0
$0
Aggregated Statistics For Year 2005 (Based on 2 partial tracts)
B) Conventional Home Purchase Loans
C) Refinancings
D) Home Improvement Loans
F) Non-occupant Loans on < 5 Family Dwellings (A B C & D)
G) Loans On Manufactured Home Dwelling (A B C & D)
Number
Average Value
Number
Average Value
Number
Average Value
Number
Average Value
Number
Average Value
LOANS ORIGINATED
12
$89,600
31
$106,665
3
$110,080
4
$111,435
2
$79,070
APPLICATIONS APPROVED, NOT ACCEPTED
5
$106,048
11
$109,726
1
$97,680
2
$162,600
0
$0
APPLICATIONS DENIED
9
$159,648
34
$103,455
14
$103,434
4
$147,675
3
$131,783
APPLICATIONS WITHDRAWN
7
$121,761
24
$139,342
3
$166,023
2
$206,010
1
$78,680
FILES CLOSED FOR INCOMPLETENESS
0
$0
4
$108,335
0
$0
0
$0
0
$0
Aggregated Statistics For Year 2004 (Based on 2 partial tracts)
A) FHA, FSA/RHS & VA Home Purchase Loans
B) Conventional Home Purchase Loans
C) Refinancings
D) Home Improvement Loans
F) Non-occupant Loans on < 5 Family Dwellings (A B C & D)
G) Loans On Manufactured Home Dwelling (A B C & D)
Number
Average Value
Number
Average Value
Number
Average Value
Number
Average Value
Number
Average Value
Number
Average Value
LOANS ORIGINATED
2
$70,350
10
$114,575
19
$79,581
2
$30,815
3
$121,447
1
$42,640
APPLICATIONS APPROVED, NOT ACCEPTED
0
$0
3
$143,930
9
$86,478
1
$46,510
2
$67,440
1
$111,630
APPLICATIONS DENIED
0
$0
6
$124,548
34
$86,549
9
$44,230
4
$110,562
3
$67,700
APPLICATIONS WITHDRAWN
0
$0
1
$58,140
14
$92,387
2
$30,235
1
$47,290
1
$103,100
FILES CLOSED FOR INCOMPLETENESS
0
$0
2
$114,535
4
$84,592
0
$0
2
$68,220
0
$0
Aggregated Statistics For Year 2003 (Based on 2 partial tracts)
A) FHA, FSA/RHS & VA Home Purchase Loans
B) Conventional Home Purchase Loans
C) Refinancings
D) Home Improvement Loans
F) Non-occupant Loans on < 5 Family Dwellings (A B C & D)
Number
Average Value
Number
Average Value
Number
Average Value
Number
Average Value
Number
Average Value
LOANS ORIGINATED
3
$98,450
8
$85,272
26
$77,401
1
$12,790
5
$76,590
APPLICATIONS APPROVED, NOT ACCEPTED
1
$81,400
3
$111,757
4
$78,490
0
$0
3
$80,490
APPLICATIONS DENIED
0
$0
3
$100,260
21
$79,126
2
$11,045
4
$76,260
APPLICATIONS WITHDRAWN
0
$0
1
$74,420
11
$100,459
0
$0
1
$207,370
FILES CLOSED FOR INCOMPLETENESS
0
$0
0
$0
2
$64,730
0
$0
0
$0
Aggregated Statistics For Year 2002 (Based on 2 partial tracts)
A) FHA, FSA/RHS & VA Home Purchase Loans
B) Conventional Home Purchase Loans
C) Refinancings
D) Home Improvement Loans
F) Non-occupant Loans on < 5 Family Dwellings (A B C & D)
Number
Average Value
Number
Average Value
Number
Average Value
Number
Average Value
Number
Average Value
LOANS ORIGINATED
5
$73,178
5
$78,062
16
$77,060
3
$11,757
2
$49,805
APPLICATIONS APPROVED, NOT ACCEPTED
0
$0
1
$37,210
2
$66,280
0
$0
0
$0
APPLICATIONS DENIED
1
$77,910
3
$67,570
19
$65,790
2
$11,820
2
$39,340
APPLICATIONS WITHDRAWN
1
$61,240
0
$0
7
$101,274
1
$14,340
0
$0
FILES CLOSED FOR INCOMPLETENESS
0
$0
0
$0
2
$64,730
0
$0
0
$0
Aggregated Statistics For Year 2001 (Based on 2 partial tracts)
A) FHA, FSA/RHS & VA Home Purchase Loans
B) Conventional Home Purchase Loans
C) Refinancings
D) Home Improvement Loans
F) Non-occupant Loans on < 5 Family Dwellings (A B C & D)
Number
Average Value
Number
Average Value
Number
Average Value
Number
Average Value
Number
Average Value
LOANS ORIGINATED
8
$76,406
5
$69,690
21
$64,341
7
$13,179
2
$78,875
APPLICATIONS APPROVED, NOT ACCEPTED
0
$0
0
$0
1
$7,750
1
$12,400
0
$0
APPLICATIONS DENIED
1
$75,190
3
$94,317
28
$57,462
10
$11,473
1
$13,950
APPLICATIONS WITHDRAWN
2
$67,635
1
$50,780
15
$65,453
3
$17,570
1
$43,800
FILES CLOSED FOR INCOMPLETENESS
0
$0
0
$0
3
$81,653
0
$0
0
$0
Aggregated Statistics For Year 2000 (Based on 2 partial tracts)
A) FHA, FSA/RHS & VA Home Purchase Loans
B) Conventional Home Purchase Loans
C) Refinancings
D) Home Improvement Loans
F) Non-occupant Loans on < 5 Family Dwellings (A B C & D)
Number
Average Value
Number
Average Value
Number
Average Value
Number
Average Value
Number
Average Value
LOANS ORIGINATED
10
$78,722
6
$57,235
6
$66,022
3
$19,380
2
$46,705
APPLICATIONS APPROVED, NOT ACCEPTED
0
$0
1
$31,010
3
$70,283
1
$22,480
0
$0
APPLICATIONS DENIED
2
$61,045
7
$71,761
19
$45,267
2
$22,285
1
$34,880
APPLICATIONS WITHDRAWN
1
$68,220
1
$101,940
5
$47,752
1
$11,630
0
$0
FILES CLOSED FOR INCOMPLETENESS
0
$0
0
$0
2
$58,530
0
$0
0
$0
Aggregated Statistics For Year 1999 (Based on 1 partial tract)
A) FHA, FSA/RHS & VA Home Purchase Loans
B) Conventional Home Purchase Loans
C) Refinancings
D) Home Improvement Loans
F) Non-occupant Loans on < 5 Family Dwellings (A B C & D)
Detailed PMIC statistics for the following Tracts:0043.00
2005 - 2018 National Fire Incident Reporting System (NFIRS) incidents
Based on the data from the years 2005 - 2018 the average number of fire incidents per year is 16. The highest number of reported fires - 36 took place in 2005, and the least - 2 in 2009. The data has a decreasing trend.
When looking into fire subcategories, the most incidents belonged to: Outside Fires (54.2%), and Mobile Property/Vehicle Fires (28.0%).
Fire incident types reported to NFIRS in Zip Code 93201


+$1,667
-$7,562
 Nearest zip codes: 93212, 93280, 93256, 93219, 93272, 93215.


 Based on the data from the years 2005 - 2018 the average number of fire incidents per year is 16. The highest number of reported fires - 36 took place in 2005, and the least - 2 in 2009. The data has a decreasing trend.
 When looking into fire subcategories, the most incidents belonged to: Outside Fires (54.2%), and Mobile Property/Vehicle Fires (28.0%).