Averages for the 2020 tax year for zip code 93202, filed in 2021:
Average Adjusted Gross Income (AGI) in 2020: $40,215 (Individual Income Tax Returns)
Here:
$40,215
State:
$95,910
Salary/wage: $36,793 (reported on 86.4% of returns)
Here:
$36,793
State:
$77,331
(% of AGI for various income ranges: 1321.9% for AGIs below $25k, 4323.8% for AGIs $25k-50k, 7793.9% for AGIs $50k-75k, 11633.8% for AGIs $75k-100k, 18950.0% for AGIs $100k-200k)
Taxable interest for individuals: $291 (reported on 19.9% of returns)
This zip code:
$291
California:
$2,294
(% of AGI for various income ranges: 3.1% for AGIs below $25k, 1.8% for AGIs $25k-50k, 37.8% for AGIs $50k-75k, 10.0% for AGIs $75k-100k, 12.5% for AGIs $100k-200k)
Ordinary dividends: $300 (reported on 2.3% of returns)
Here:
$300
State:
$10,949
(% of AGI for various income ranges: 1.9% for AGIs below $25k, 2.2% for AGIs $50k-75k)
Profit/loss from business: +$11,235 (reported on 9.7% of returns)
Here:
+$11,235
State:
+$15,671
(% of AGI for various income ranges: 130.7% for AGIs below $25k, 78.4% for AGIs $25k-50k, 272.2% for AGIs $50k-75k, 647.5% for AGIs $75k-100k)
Taxable individual retirement arrangement distribution: $10,150 (reported on 2.3% of returns)
93202:
$10,150
California:
$23,505
(% of AGI for various income ranges: 225.6% for AGIs $50k-75k)
Total itemized deductions: $30,000 (reported on 2.3% of returns)
Here:
$30,000
State:
$39,517
(% of AGI for various income ranges: 107.1% for AGIs $25k-50k, 897.5% for AGIs $75k-100k)
Charity contributions: $7,350 (reported on 2.3% of returns)
Here:
$7,350
State:
$12,598
(% of AGI for various income ranges: 163.3% for AGIs $50k-75k)
Taxes paid: $5,825 (reported on 2.3% of returns)
93202:
$5,825
State:
$8,807
(% of AGI for various income ranges: 18.7% for AGIs $25k-50k, 186.2% for AGIs $75k-100k)
Earned income credit: $2,472 (reported on 28.4% of returns)
Here:
$2,472
State:
$2,074
(% of AGI for various income ranges: 150.0% for AGIs below $25k, 134.7% for AGIs $25k-50k)
Percentage of individuals using paid preparers for their 2020 taxes: 96.0%
Here:
96%
State:
92%
(% for various income ranges: 95.1% for AGIs below $25k, 95.4% for AGIs $25k-50k, 96.6% for AGIs $50k-75k, 100.0% for AGIs $75k-100k, 100.0% for AGIs $100k-200k)
Averages for the 2012 tax year for zip code 93202, filed in 2013:
Average Adjusted Gross Income (AGI) in 2012: $32,023 (Individual Income Tax Returns)
Here:
$32,023
State:
$72,726
Salary/wage: $28,712 (reported on 91.6% of returns)
Here:
$28,712
State:
$59,079
(% of AGI for various income ranges: 81.8% for AGIs below $25k, 87.3% for AGIs $25k-50k, 80.1% for AGIs $50k-75k, 83.5% for AGIs $75k-100k, 62.3% for AGIs $100k-200k)
Taxable interest for individuals: $190 (reported on 18.8% of returns)
This zip code:
$190
California:
$2,146
(% of AGI for various income ranges: 0.1% for AGIs below $25k, 0.1% for AGIs $25k-50k, 0.1% for AGIs $50k-75k, 0.2% for AGIs $75k-100k)
Ordinary dividends: $525 (reported on 2.6% of returns)
Here:
$525
State:
$9,308
Profit/loss from business: +$6,782 (reported on 7.1% of returns)
Here:
+$6,782
State:
+$17,064
Taxable individual retirement arrangement distribution: $8,375 (reported on 2.6% of returns)
93202:
$8,375
California:
$19,557
Total itemized deductions: $16,587 (29% of AGI, reported on 14.9% of returns)
Here:
$16,587
State:
$34,004
Here:
29.0% of AGI
State:
22.7% of AGI
(% of AGI for various income ranges: 2.7% for AGIs below $25k, 7.2% for AGIs $25k-50k, 9.1% for AGIs $50k-75k, 12.4% for AGIs $75k-100k, 13.8% for AGIs $100k-200k)
Charity contributions: $2,500 (reported on 11.7% of returns)
Here:
$2,500
State:
$4,659
(% of AGI for various income ranges: 0.8% for AGIs $25k-50k, 1.3% for AGIs $50k-75k, 3.4% for AGIs $75k-100k)
Taxes paid: $3,917 (reported on 14.9% of returns)
93202:
$3,917
State:
$14,448
(% of AGI for various income ranges: 0.4% for AGIs below $25k, 1.3% for AGIs $25k-50k, 2.1% for AGIs $50k-75k, 3.5% for AGIs $75k-100k, 5.0% for AGIs $100k-200k)
Earned income credit: $2,553 (reported on 40.3% of returns)
Here:
$2,553
State:
$2,286
(% of AGI for various income ranges: 10.8% for AGIs below $25k, 2.5% for AGIs $25k-50k)
Percentage of individuals using paid preparers for their 2012 taxes: 61.7%
Here:
62%
State:
64%
(% for various income ranges: 59.7% for AGIs below $25k, 62.5% for AGIs $25k-50k, 64.7% for AGIs $50k-75k, 66.7% for AGIs $75k-100k, 66.7% for AGIs $100k-200k)
Averages for the 2004 tax year for zip code 93202, filed in 2005:
Average Adjusted Gross Income (AGI) in 2004: $28,037 (Individual Income Tax Returns)
Here:
$28,037
State:
$58,600
Salary/wage: $25,477 (reported on 92.1% of returns)
Here:
$25,477
State:
$49,455
(% of AGI for various income ranges: 115.6% for AGIs below $10k, 81.2% for AGIs $10k-25k, 89.3% for AGIs $25k-50k, 84.3% for AGIs $50k-75k, 89.8% for AGIs $75k-100k, 45.7% for AGIs over 100k)
Taxable interest for individuals: $557 (reported on 21.7% of returns)
This zip code:
$557
California:
$2,365
(% of AGI for various income ranges: 3.7% for AGIs below $10k, 0.8% for AGIs $10k-25k, 0.1% for AGIs $25k-50k, 0.4% for AGIs $50k-75k, 0.1% for AGIs $75k-100k, 0.2% for AGIs over 100k)
Taxable dividends: $214 (reported on 4.0% of returns)
Here:
$214
State:
$4,746
(% of AGI for various income ranges: 0.0% for AGIs $10k-25k, 0.0% for AGIs $25k-50k, 0.0% for AGIs $50k-75k, 0.1% for AGIs $75k-100k)
Net capital gain/loss: +$7,088 (reported on 2.5% of returns)
Here:
+$7,088
State:
+$23,418
Profit/loss from business: +$6,970 (reported on 7.3% of returns)
Here:
+$6,970
State:
+$16,826
(% of AGI for various income ranges: 2.0% for AGIs below $10k, 3.6% for AGIs $10k-25k, 1.6% for AGIs $25k-50k, 1.4% for AGIs $50k-75k)
Total itemized deductions: $15,014 (28% of AGI, reported on 16.0% of returns)
Here:
$15,014
State:
$28,113
Here:
28.4% of AGI
State:
25.3% of AGI
(% of AGI for various income ranges: 4.0% for AGIs $10k-25k, 7.3% for AGIs $25k-50k, 13.2% for AGIs $50k-75k, 12.7% for AGIs $75k-100k, 15.6% for AGIs over 100k)
Charity contributions deductions: $2,202 (4% of AGI, reported on 13.6% of returns)
Here:
$2,202
State:
$3,923
Here:
4.2% of AGI
State:
3.3% of AGI
(% of AGI for various income ranges: 0.4% for AGIs $10k-25k, 0.8% for AGIs $25k-50k, 2.0% for AGIs $50k-75k, 1.4% for AGIs $75k-100k, 2.0% for AGIs over 100k)
Total tax: $2,728 (reported on 56.7% of returns)
93202:
$2,728
State:
$10,761
(% of AGI for various income ranges: 2.9% for AGIs below $10k, 2.7% for AGIs $10k-25k, 3.9% for AGIs $25k-50k, 7.3% for AGIs $50k-75k, 9.5% for AGIs $75k-100k, 15.4% for AGIs over 100k)
Earned income credit: $1,897 (reported on 36.4% of returns)
Here:
$1,897
State:
$1,763
Percentage of individuals using paid preparers for their 2004 taxes: 66.4%
Here:
66%
State:
66%
(% for various income ranges: 59.7% for AGIs below $10k, 66.6% for AGIs $10k-25k, 68.9% for AGIs $25k-50k, 67.6% for AGIs $50k-75k, 70.0% for AGIs $75k-100k, 75.0% for AGIs over 100k)
Household received Food Stamps/SNAP in the past 12 months: 337 Household did not receive Food Stamps/SNAP in the past 12 months: 745
Women who had a birth in the past 12 months: 29 (14 now married, 15 unmarried) Women who did not have a birth in the past 12 months: 978 (396 now married, 581 unmarried)
Housing units in zip code 93202 with a mortgage: 644 (26 second mortgage) Residents with income below the poverty level in 2022:
This zip code:
14.2%
Whole state:
12.2%
Residents with income below 50% of the poverty level in 2022:
This zip code:
8.7%
Whole state:
6.2%
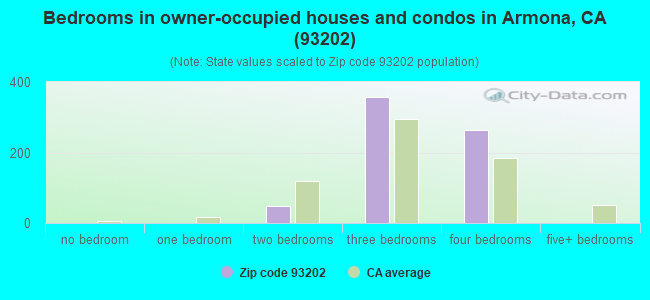
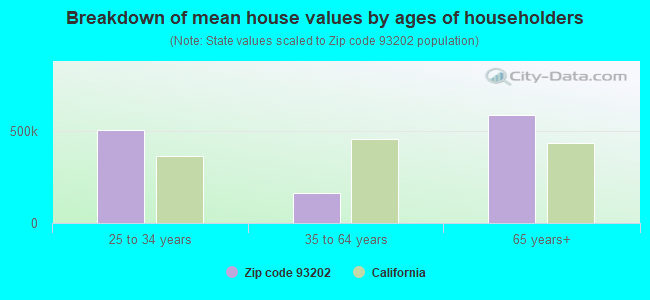
Median number of rooms in houses and condos:
Here:
5.5
State:
6.0
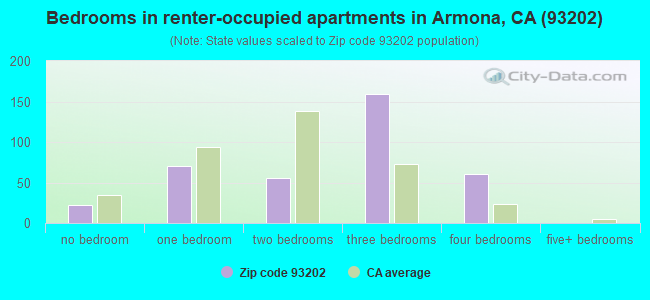
Median number of rooms in apartments:
Here:
4.8
State:
3.9
Notable locations in this zip code not listed on our city pages
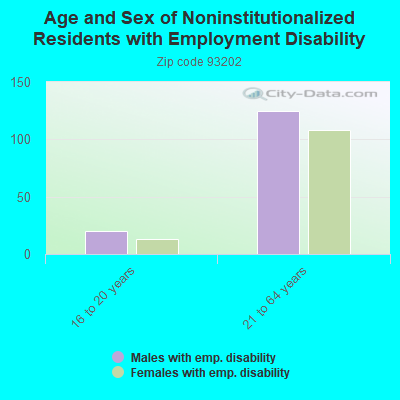
In group quarters: 2 (-1 institutionalized population)
Size of family households: 51 2-persons, 187 3-persons, 163 4-persons, 199 5-persons, 129 6-persons, 101 7-or-more-persons
Size of nonfamily households: 160 1-person, 33 2-persons
1,010 married couples with children.
81 single-parent households (81 women).
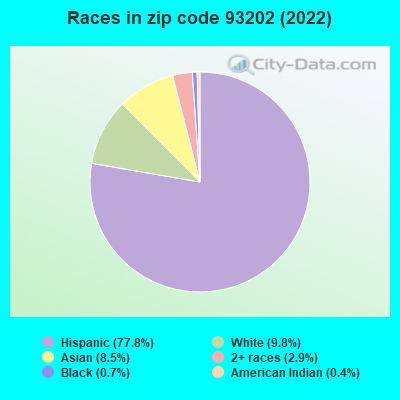
38.1% of residents of 93202 zip code speak English at home.
53.2% of residents speak Spanish at home (36% very well, 34% well, 17% not well, 13% not at all).
0.5% of residents speak other Indo-European language at home (100% well).
8.3% of residents speak Asian or Pacific Island language at home (56% very well, 23% well, 22% not well).
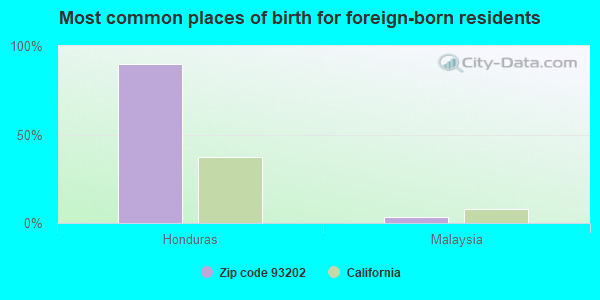
Foreign born population: 1,303 (30.5%) (30.1% of them are naturalized citizens)
This zip code:
30.5%
Whole state:
26.7%
90%Honduras
3%Malaysia
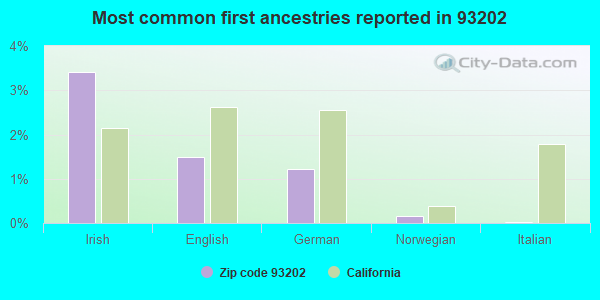
3%Irish
1%English
1%German
0%Norwegian
0%Italian
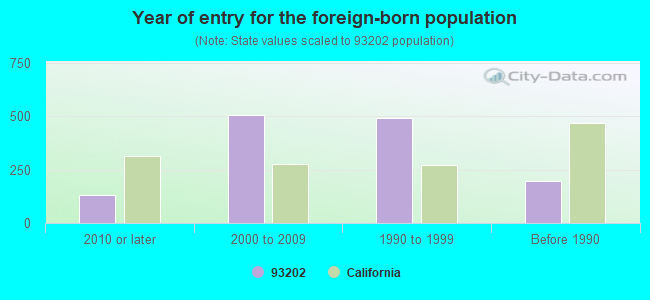
Year of entry for the foreign-born population
1302010 or later
5052000 to 2009
4901990 to 1999
198Before 1990
Housing units lacking complete plumbing facilities: 1.4%
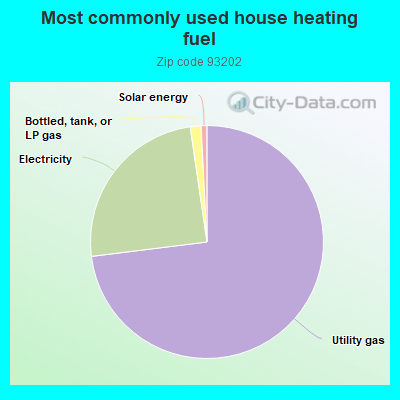
73.1%Utility gas
24.7%Electricity
1.5%Bottled, tank, or LP gas
0.8%Solar energy
Population in 1990: 752. Population change in the 1990s: +2,110 (+280.6%).
Place of birth for U.S.-born residents:
This state: 2,538
Northeast: 33
Midwest: 148
South: 100
West: 109
47% of the 93202 zip code residents lived in the same house 5 years ago. Out of people who lived in different houses, 81% lived in this county. Out of people who lived in different counties, 50% lived in California.
95% of the 93202 zip code residents lived in the same house 1 year ago. Out of people who lived in different houses, 92% moved from this county. Out of people who lived in different houses, 9% moved from different county within same state.
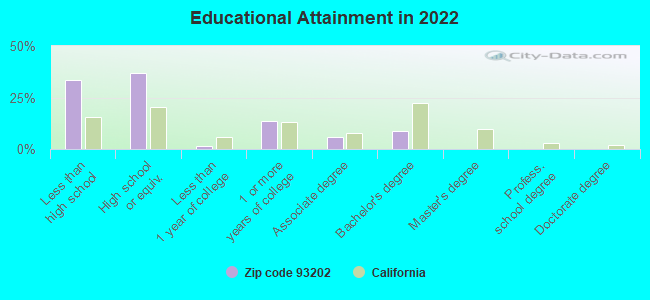
Private vs. public school enrollment:
Students in private schools in grades 1 to 8 (elementary and middle school):
Here:
0.0%
California:
10.5%
Students in private schools in grades 9 to 12 (high school): 15
Here:
4.2%
California:
8.5%
Students in private undergraduate colleges:
Here:
0.0%
California:
15.9%
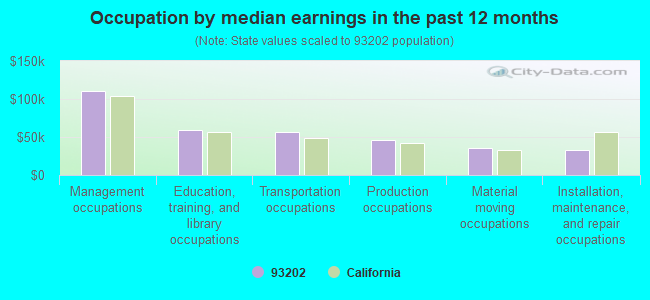
Occupation by median earnings in the past 12 months ($)
110,606Management occupations
59,849Education, training, and library occupations
56,184Transportation occupations
45,508Production occupations
36,131Material moving occupations
32,409Installation, maintenance, and repair occupations
Top industries in this zip code by the number of employees in 2005:
Other Services (except Public Administration): Automotive Body, Paint, and Interior Repair and Maintenance (10-19 employees: 2 establishments)
Finance and Insurance: Credit Unions (10-19: 1)
Construction: Other Heavy and Civil Engineering Construction (10-19: 1)
Wholesale Trade: Petroleum Bulk Stations and Terminals (5-9: 1)
Health Care and Social Assistance: Offices of Dentists (5-9: 1)
Fatal accident statistics in 2013:
Fatal accident count: 1
Vehicles involved in fatal accidents: 1
Fatal accidents caused by drunken drivers: 0
Fatalities: 1
Persons involved in fatal accidents: 2
Pedestrians involved in fatal accidents: 1
Home Mortgage Disclosure Act Aggregated Statistics For Year 2009 (Based on 2 partial tracts)
A) FHA, FSA/RHS & VA Home Purchase Loans
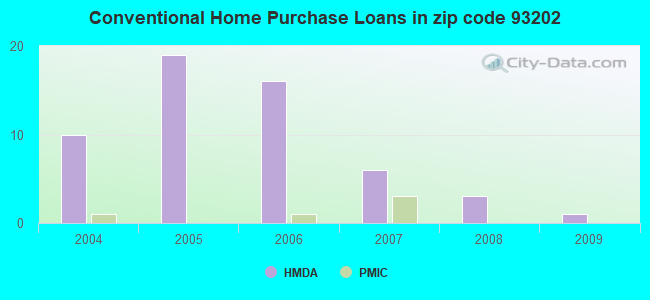
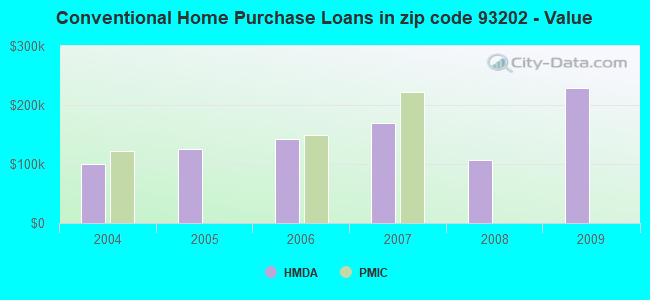
B) Conventional Home Purchase Loans
C) Refinancings
D) Home Improvement Loans
F) Non-occupant Loans on < 5 Family Dwellings (A B C & D)
Number
Average Value
Number
Average Value
Number
Average Value
Number
Average Value
Number
Average Value
LOANS ORIGINATED
3
$136,050
1
$228,180
4
$174,852
1
$63,230
1
$73,990
APPLICATIONS APPROVED, NOT ACCEPTED
0
$0
0
$0
1
$288,610
0
$0
0
$0
APPLICATIONS DENIED
0
$0
0
$0
4
$168,772
0
$0
0
$0
APPLICATIONS WITHDRAWN
1
$68,980
0
$0
2
$207,910
0
$0
0
$0
FILES CLOSED FOR INCOMPLETENESS
0
$0
0
$0
1
$96,100
0
$0
0
$0
Aggregated Statistics For Year 2008 (Based on 2 partial tracts)
A) FHA, FSA/RHS & VA Home Purchase Loans
B) Conventional Home Purchase Loans
C) Refinancings
D) Home Improvement Loans
F) Non-occupant Loans on < 5 Family Dwellings (A B C & D)
Number
Average Value
Number
Average Value
Number
Average Value
Number
Average Value
Number
Average Value
LOANS ORIGINATED
3
$153,887
3
$106,423
5
$156,568
1
$55,130
1
$133,840
APPLICATIONS APPROVED, NOT ACCEPTED
0
$0
1
$116,590
1
$159,340
0
$0
0
$0
APPLICATIONS DENIED
0
$0
2
$147,990
16
$165,742
1
$110,260
1
$139,740
APPLICATIONS WITHDRAWN
0
$0
0
$0
3
$168,183
0
$0
0
$0
FILES CLOSED FOR INCOMPLETENESS
0
$0
0
$0
0
$0
0
$0
0
$0
Aggregated Statistics For Year 2007 (Based on 2 partial tracts)
A) FHA, FSA/RHS & VA Home Purchase Loans
B) Conventional Home Purchase Loans
C) Refinancings
D) Home Improvement Loans
F) Non-occupant Loans on < 5 Family Dwellings (A B C & D)
Number
Average Value
Number
Average Value
Number
Average Value
Number
Average Value
Number
Average Value
LOANS ORIGINATED
1
$186,170
6
$169,437
18
$166,022
1
$106,720
3
$136,690
APPLICATIONS APPROVED, NOT ACCEPTED
0
$0
2
$151,895
5
$140,000
1
$102,150
1
$270,480
APPLICATIONS DENIED
0
$0
2
$221,025
20
$171,508
3
$72,620
3
$139,980
APPLICATIONS WITHDRAWN
0
$0
2
$158,750
7
$182,819
1
$86,380
1
$95,070
FILES CLOSED FOR INCOMPLETENESS
0
$0
0
$0
2
$196,630
0
$0
1
$86,080
Aggregated Statistics For Year 2006 (Based on 2 partial tracts)
B) Conventional Home Purchase Loans
C) Refinancings
D) Home Improvement Loans
F) Non-occupant Loans on < 5 Family Dwellings (A B C & D)
Number
Average Value
Number
Average Value
Number
Average Value
Number
Average Value
LOANS ORIGINATED
16
$142,020
23
$160,012
5
$76,088
4
$126,985
APPLICATIONS APPROVED, NOT ACCEPTED
4
$160,592
6
$153,443
1
$143,420
2
$99,790
APPLICATIONS DENIED
10
$156,244
16
$151,582
3
$90,257
2
$122,490
APPLICATIONS WITHDRAWN
5
$153,414
13
$152,525
1
$73,550
2
$149,390
FILES CLOSED FOR INCOMPLETENESS
1
$80,780
3
$164,843
0
$0
0
$0
Aggregated Statistics For Year 2005 (Based on 2 partial tracts)
A) FHA, FSA/RHS & VA Home Purchase Loans
B) Conventional Home Purchase Loans
C) Refinancings
D) Home Improvement Loans
F) Non-occupant Loans on < 5 Family Dwellings (A B C & D)
Number
Average Value
Number
Average Value
Number
Average Value
Number
Average Value
Number
Average Value
LOANS ORIGINATED
1
$163,470
19
$124,770
24
$129,743
4
$89,288
6
$127,623
APPLICATIONS APPROVED, NOT ACCEPTED
0
$0
3
$155,950
4
$140,215
0
$0
1
$76,210
APPLICATIONS DENIED
0
$0
6
$133,742
17
$116,299
2
$82,765
2
$102,075
APPLICATIONS WITHDRAWN
1
$96,400
5
$124,996
14
$131,081
1
$175,550
1
$94,930
FILES CLOSED FOR INCOMPLETENESS
0
$0
1
$87,560
3
$104,557
0
$0
0
$0
Aggregated Statistics For Year 2004 (Based on 2 partial tracts)
A) FHA, FSA/RHS & VA Home Purchase Loans
B) Conventional Home Purchase Loans
C) Refinancings
D) Home Improvement Loans
F) Non-occupant Loans on < 5 Family Dwellings (A B C & D)
Detailed PMIC statistics for the following Tracts:0005.00
2005 - 2018 National Fire Incident Reporting System (NFIRS) incidents
Based on the data from the years 2005 - 2018 the average number of fire incidents per year is 20. The highest number of reported fires - 33 took place in 2013, and the least - 10 in 2015. The data has a decreasing trend.
When looking into fire subcategories, the most incidents belonged to: Outside Fires (57.1%), and Structure Fires (24.9%).
Fire incident types reported to NFIRS in Zip Code 93202

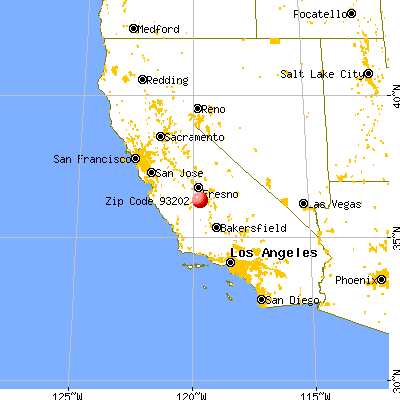


 Nearest zip codes: 93230, 93245, 93242, 93266, 93662, 93631.


 Based on the data from the years 2005 - 2018 the average number of fire incidents per year is 20. The highest number of reported fires - 33 took place in 2013, and the least - 10 in 2015. The data has a decreasing trend.
 When looking into fire subcategories, the most incidents belonged to: Outside Fires (57.1%), and Structure Fires (24.9%).