Estimated zip code population in 2022: 2,019 Zip code population in 2010: 2,099 Zip code population in 2000: 1,520
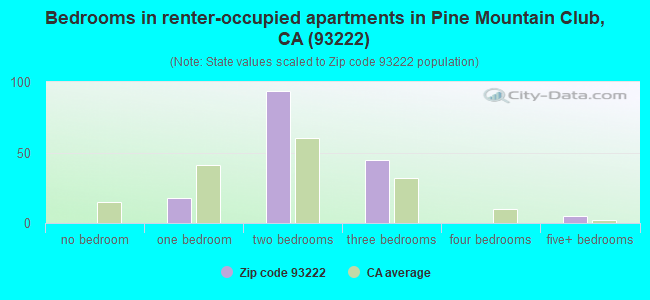
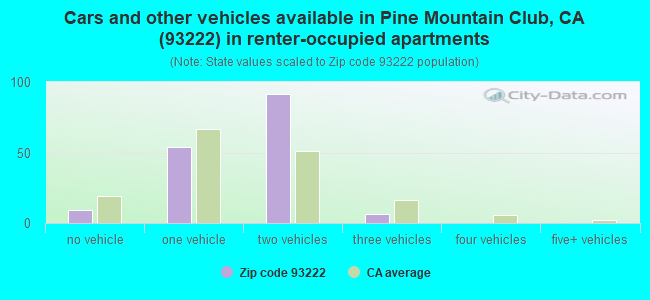
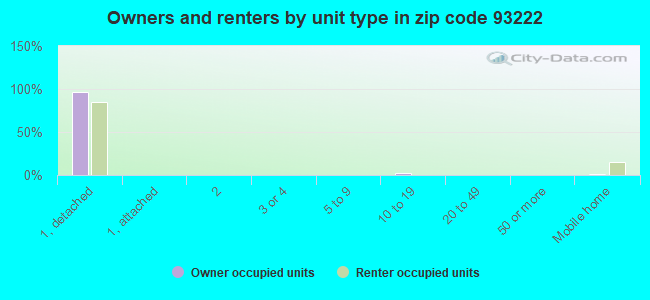
Houses and condos: 2,223 Renter-occupied apartments: 162
% of renters here:
15%
State:
44%
March 2022 cost of living index in zip code 93222: 99.0 (near average, U.S. average is 100)
Land area: 28.7 sq. mi. Water area: 0.0 sq. mi.
Population density: 70 people per square mile
(very low).
OSM Map
General Map
Google Map
MSN Map
OSM Map
General Map
Google Map
MSN Map
OSM Map
General Map
Google Map
MSN Map
OSM Map
General Map
Google Map
MSN Map
Please wait while loading the map...
Real estate property taxes paid for housing units in 2022:
This zip code:
0.7% ($2,748)
California:
0.7% ($4,831)
Median real estate property taxes paid for housing units with mortgages in 2022: $2,796 (0.7%) Median real estate property taxes paid for housing units with no mortgage in 2022: $2,748 (0.7%)
Estimated median house/condo value in 2022: $376,029
93222:
$376,029
California:
$715,900
According to our research of California and other state lists, there were 2 registered sex offenders living in 93222 zip code as of May 28, 2024. The ratio of all residents to sex offenders in zip code 93222 is 782 to 1. The ratio of registered sex offenders to all residents in this zip code is near the state average.
Median resident age:
This zip code:
59.0 years
California median age:
37.9 years
Average household size:
This zip code:
1.9 people
California:
2.8 people
Averages for the 2004 tax year for zip code 93222, filed in 2005:
Average Adjusted Gross Income (AGI) in 2004: $52,504 (Individual Income Tax Returns)
Here:
$52,504
State:
$58,600
Salary/wage: $50,070 (reported on 68.6% of returns)
Here:
$50,070
State:
$49,455
(% of AGI for various income ranges: 48.3% for AGIs below $10k, 46.6% for AGIs $10k-25k, 63.1% for AGIs $25k-50k, 72.2% for AGIs $50k-75k, 70.2% for AGIs $75k-100k, 62.3% for AGIs over 100k)
Taxable interest for individuals: $1,345 (reported on 64.3% of returns)
This zip code:
$1,345
California:
$2,365
(% of AGI for various income ranges: 5.8% for AGIs below $10k, 3.9% for AGIs $10k-25k, 2.8% for AGIs $25k-50k, 1.2% for AGIs $50k-75k, 1.1% for AGIs $75k-100k, 1.3% for AGIs over 100k)
Taxable dividends: $1,702 (reported on 28.3% of returns)
Here:
$1,702
State:
$4,746
(% of AGI for various income ranges: 4.5% for AGIs below $10k, 2.7% for AGIs $10k-25k, 1.8% for AGIs $25k-50k, 0.5% for AGIs $50k-75k, 1.1% for AGIs $75k-100k, 0.4% for AGIs over 100k)
Net capital gain/loss: +$10,192 (reported on 28.9% of returns)
Here:
+$10,192
State:
+$23,418
(% of AGI for various income ranges: -11.0% for AGIs below $10k, 0.1% for AGIs $10k-25k, 0.1% for AGIs $25k-50k, 1.2% for AGIs $50k-75k, 0.9% for AGIs $75k-100k, 15.0% for AGIs over 100k)
Profit/loss from business: +$15,046 (reported on 31.7% of returns)
Here:
+$15,046
State:
+$16,826
(% of AGI for various income ranges: 32.7% for AGIs below $10k, 17.6% for AGIs $10k-25k, 12.6% for AGIs $25k-50k, 3.8% for AGIs $50k-75k, 6.6% for AGIs $75k-100k, 10.7% for AGIs over 100k)
IRA payment deduction: $3,270 (reported on 4.5% of returns)
93222:
$3,270
California:
$3,192
Total itemized deductions: $20,981 (31% of AGI, reported on 64.9% of returns)
Here:
$20,981
State:
$28,113
Here:
30.8% of AGI
State:
25.3% of AGI
(% of AGI for various income ranges: 112.1% for AGIs below $10k, 37.0% for AGIs $10k-25k, 30.1% for AGIs $25k-50k, 26.8% for AGIs $50k-75k, 25.3% for AGIs $75k-100k, 19.6% for AGIs over 100k)
Charity contributions deductions: $2,658 (4% of AGI, reported on 57.3% of returns)
Here:
$2,658
State:
$3,923
Here:
3.7% of AGI
State:
3.3% of AGI
(% of AGI for various income ranges: 6.1% for AGIs below $10k, 3.0% for AGIs $10k-25k, 3.1% for AGIs $25k-50k, 2.8% for AGIs $50k-75k, 2.9% for AGIs $75k-100k, 2.8% for AGIs over 100k)
Total tax: $6,922 (reported on 82.3% of returns)
93222:
$6,922
State:
$10,761
(% of AGI for various income ranges: 7.8% for AGIs below $10k, 5.7% for AGIs $10k-25k, 7.6% for AGIs $25k-50k, 8.7% for AGIs $50k-75k, 10.2% for AGIs $75k-100k, 15.0% for AGIs over 100k)
Earned income credit: $1,307 (reported on 9.0% of returns)
Here:
$1,307
State:
$1,763
Percentage of individuals using paid preparers for their 2004 taxes: 70.0%
Here:
70%
State:
66%
(% for various income ranges: 69.1% for AGIs below $10k, 71.0% for AGIs $10k-25k, 66.9% for AGIs $25k-50k, 69.5% for AGIs $50k-75k, 74.7% for AGIs $75k-100k, 71.3% for AGIs over 100k)
Notable locations in zip code 93222: Campo Alto Campground (A), Camp Condor (B), Pine Mountain Club Golf Course (C), Mil Potrero Organization Campground (D), Happy Gulch Campground (E), Toad Springs Campground (F), Camp Alto Campground (G), United States Forest Service Los Padres National Forest Station 73 - Apache Saddle (H), Kern County Fire Department Station 58 - Pine Mountain Club (I). Display/hide their locations on the map
Size of family households: 374 2-persons, 158 3-persons, 35 4-persons, 8 5-persons, 28 7-or-more-persons
Size of nonfamily households: 387 1-person, 86 2-persons
283 married couples with children.
0 single-parent households ().
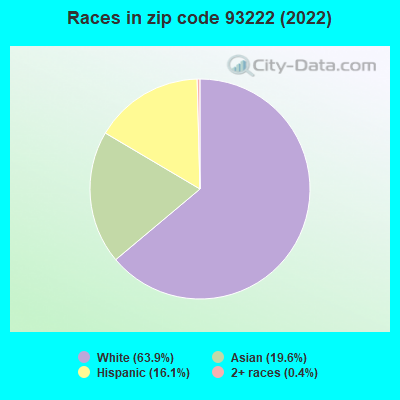
69.9% of residents of 93222 zip code speak English at home.
10.2% of residents speak Spanish at home (84% very well, 16% well).
1.9% of residents speak other Indo-European language at home (100% very well).
18.2% of residents speak Asian or Pacific Island language at home (92% very well, 8% well).
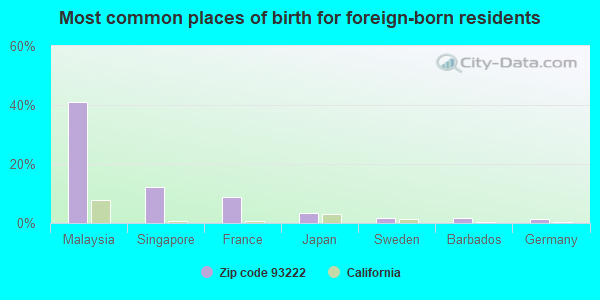
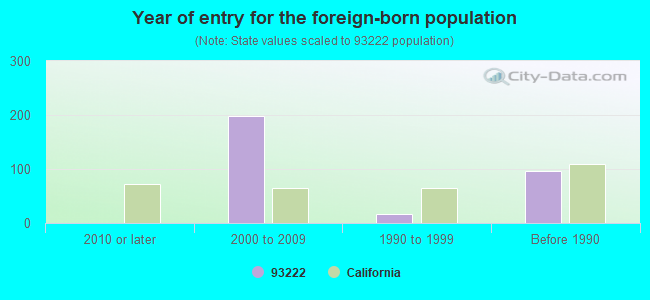
Foreign born population: 232 (11.5%) (75.8% of them are naturalized citizens)
This zip code:
11.5%
Whole state:
26.7%
41%Malaysia
12%Singapore
9%France
3%Japan
2%Sweden
2%Barbados
1%Germany
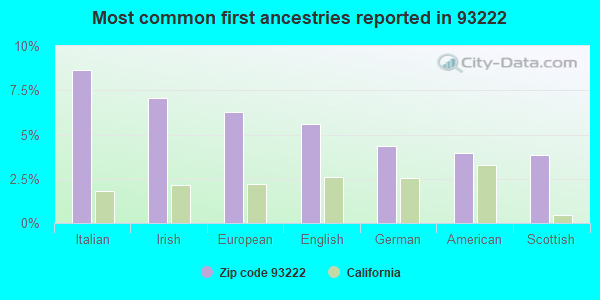
9%Italian
7%Irish
6%European
6%English
4%German
4%American
4%Scottish
Year of entry for the foreign-born population
02010 or later
1992000 to 2009
171990 to 1999
97Before 1990
Housing units lacking complete kitchen facilities: 1.0%
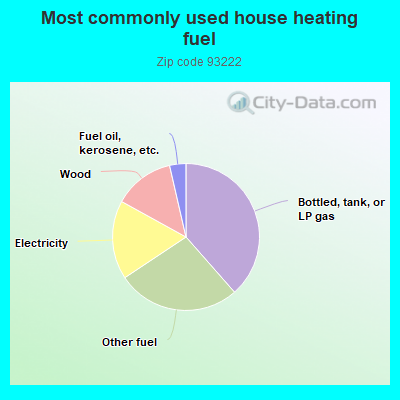
38.6%Bottled, tank, or LP gas
27.2%Other fuel
17.4%Electricity
13.4%Wood
3.6%Fuel oil, kerosene, etc.
Place of birth for U.S.-born residents:
This state: 958
Northeast: 123
Midwest: 178
South: 211
West: 203
53% of the 93222 zip code residents lived in the same house 5 years ago. Out of people who lived in different houses, 18% lived in this county. Out of people who lived in different counties, 50% lived in California.
96% of the 93222 zip code residents lived in the same house 1 year ago. Out of people who lived in different houses, 40% moved from this county. Out of people who lived in different houses, 66% moved from different county within same state. Out of people who lived in different houses, 1% moved from different state.
Private vs. public school enrollment:
Students in private schools in grades 1 to 8 (elementary and middle school): 79
Here:
48.6%
California:
10.5%
Students in private schools in grades 9 to 12 (high school):
Here:
0.0%
California:
8.5%
Students in private undergraduate colleges:
Here:
0.0%
California:
15.9%
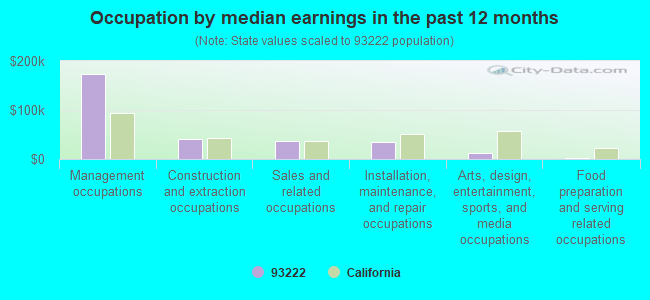
Occupation by median earnings in the past 12 months ($)
174,075Management occupations
41,152Construction and extraction occupations
36,980Sales and related occupations
34,147Installation, maintenance, and repair occupations
11,850Arts, design, entertainment, sports, and media occupations
2,501Food preparation and serving related occupations
Companies with federal contracts located in this zip code (FRAZIER PARK, CA):
BLUE RIDGE DEVELOPMENT (16308 ASKIN DR; small business) 4 employees, $300000 revenue. : $314,933 in 8 contractsfrom 2000 to 2001
Contracts for Other Natural Resources and Conservation Services by Forest Service (disused code: now 12C2), Forest Service Signed by year:2000: $113,000; 2001: $201,933; 2002: $0; 2003: $0; 2004: $0; 2005: $0; 2006: $0.
Biggest contracts:
$105,000 with Forest Service (disused code: now 12C2) for Other Natural Resources and Conservation Services. Signed on 2000-04-15. Completion date: 2000-09-15.
$98,000, same as above.Signed on 2001-04-15. Completion date: 2001-09-15.
$98,000, same as above.Signed on 2001-04-15. Completion date: 2001-09-15.
$8,000, same as above.Signed on 2000-04-15. Completion date: 2000-09-15.
HIGH COUNTRY ENGINEERING INC. (No data from D and B; small business) : $311,903 in 7 contractsfrom 2003 to 2004
Contracts for Other Natural Resources and Conservation Services, Maintenance, Repair or Alteration of Real Property -- Highways, Roads, Streets, Bridges, and Railways (includes resurfacing) by Forest Service Signed by year:2000: $0; 2001: $0; 2002: $0; 2003: $213,601; 2004: $98,302; 2005: $0; 2006: $0.
Biggest contracts:
$111,486 with Forest Service for Other Natural Resources and Conservation Services. Signed on 2003-05-15. Completion date: 2003-09-15.
$87,186, same as above.Signed on 2004-04-12. Completion date: 2004-09-30.
$64,689 with Forest Service for Maintenance, Repair or Alteration of Real Property -- Highways, Roads, Streets, Bridges, and Railways (includes resurfacing). Signed on 2003-03-15. Completion date: 2003-04-15.
$36,895, same as above.Signed on 2003-06-15. Completion date: 2003-09-15.
SCHILLING PRECISION ENGINEERIN (1908 ST ANTON DR; small business) : $284,188 in 11 contractsfrom 2001 to 2006
Contracts for Aircraft Wheel and Brake Systems, Bearings, Plain, Unmounted, Nuts and Washers by Air Force Signed by year:2000: $0; 2001: $45,358; 2002: $86,784; 2003: $102,577; 2004: $7,906; 2005: $38,633; 2006: $2,930.
Biggest contracts:
$86,784 with Air Force for Aircraft Wheel and Brake Systems. Signed on 2002-09-12. Completion date: 2003-12-31.
$55,229, same as above.Signed on 2003-01-07. Completion date: 2003-11-30.
$47,348, same as above.Signed on 2003-12-08. Completion date: 2004-12-31.
$45,358, same as above.Signed on 2001-08-01. Completion date: 2002-08-30.
FAILURE ANALYSIS SERVICE TECHN (2305 ST BERNARD DR; small business)
$7,425 with Navy for Other Quality Control, Testing and Inspection Services -- Engines, Turbines, and Components. Taking place in WA. Signed on 2005-04-06. Completion date: 2005-09-30.
Top industries in this zip code by the number of employees in 2005:
Other Services (except Public Administration): Other Similar Organizations (except Business, Professional, Labor, and Political Organizations) (50-99 employees: 1 establishment)
Accommodation and Food Services: Full-Service Restaurants (5-9: 2)
Other Services (except Public Administration): Religious Organizations (5-9: 1, 1-4: 1)
Wholesale Trade: Other Miscellaneous Nondurable Goods Merchant Wholesalers (5-9: 1)
Utilities: Water Supply and Irrigation Systems (5-9: 1)
Professional, Scientific, and Technical Services: Offices of Lawyers (5-9: 1)
Construction: Electrical Contractors (5-9: 1)
Construction: New Single-Family Housing Construction (except Operative Builders) (1-4: 3)
Finance and Insurance: Insurance Agencies and Brokerages (1-4: 2)
Fatal accident statistics in 2012:
Fatal accident count: 1
Vehicles involved in fatal accidents: 2
Fatal accidents caused by drunken drivers: 0
Fatalities: 1
Persons involved in fatal accidents: 2
Pedestrians involved in fatal accidents: 0
Home Mortgage Disclosure Act Aggregated Statistics For Year 2009 (Based on 2 partial tracts)
A) FHA, FSA/RHS & VA Home Purchase Loans
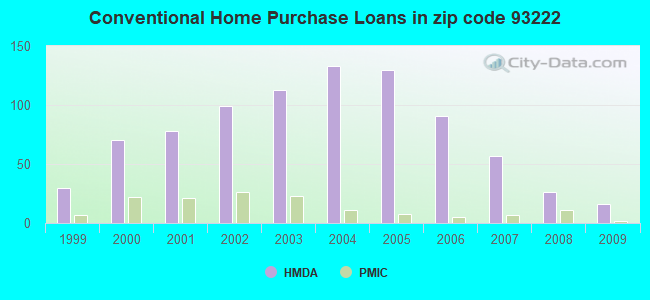
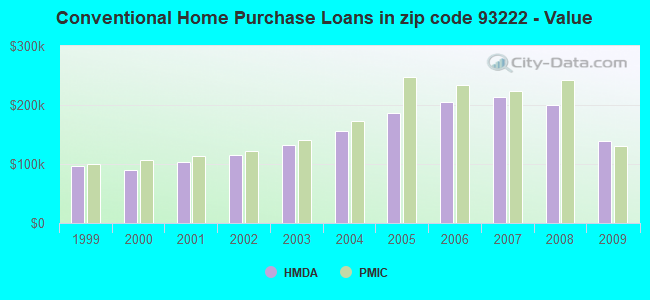
B) Conventional Home Purchase Loans
C) Refinancings
D) Home Improvement Loans
F) Non-occupant Loans on < 5 Family Dwellings (A B C & D)
G) Loans On Manufactured Home Dwelling (A B C & D)
Number
Average Value
Number
Average Value
Number
Average Value
Number
Average Value
Number
Average Value
Number
Average Value
LOANS ORIGINATED
12
$172,907
16
$139,686
41
$174,261
1
$195,000
20
$150,174
3
$143,620
APPLICATIONS APPROVED, NOT ACCEPTED
1
$210,820
3
$169,640
6
$177,272
0
$0
4
$154,570
1
$144,610
APPLICATIONS DENIED
3
$180,620
6
$171,123
36
$189,661
2
$77,905
12
$185,754
2
$181,665
APPLICATIONS WITHDRAWN
1
$168,650
4
$139,912
15
$184,113
0
$0
4
$142,218
1
$69,170
FILES CLOSED FOR INCOMPLETENESS
1
$236,510
2
$153,170
2
$172,605
1
$55,340
1
$153,830
0
$0
Aggregated Statistics For Year 2008 (Based on 2 partial tracts)
A) FHA, FSA/RHS & VA Home Purchase Loans
B) Conventional Home Purchase Loans
C) Refinancings
D) Home Improvement Loans
F) Non-occupant Loans on < 5 Family Dwellings (A B C & D)
G) Loans On Manufactured Home Dwelling (A B C & D)
Number
Average Value
Number
Average Value
Number
Average Value
Number
Average Value
Number
Average Value
Number
Average Value
LOANS ORIGINATED
5
$218,788
26
$200,288
41
$193,944
7
$119,526
24
$184,231
6
$144,882
APPLICATIONS APPROVED, NOT ACCEPTED
1
$158,440
5
$142,630
12
$228,027
1
$20,420
2
$127,150
2
$178,370
APPLICATIONS DENIED
2
$279,495
11
$217,105
43
$220,805
5
$86,698
9
$224,029
4
$112,738
APPLICATIONS WITHDRAWN
1
$177,550
5
$216,482
16
$204,990
2
$39,035
5
$161,868
1
$116,280
FILES CLOSED FOR INCOMPLETENESS
0
$0
2
$312,105
5
$245,468
0
$0
3
$189,733
1
$106,400
Aggregated Statistics For Year 2007 (Based on 2 partial tracts)
A) FHA, FSA/RHS & VA Home Purchase Loans
B) Conventional Home Purchase Loans
C) Refinancings
D) Home Improvement Loans
F) Non-occupant Loans on < 5 Family Dwellings (A B C & D)
G) Loans On Manufactured Home Dwelling (A B C & D)
Number
Average Value
Number
Average Value
Number
Average Value
Number
Average Value
Number
Average Value
Number
Average Value
LOANS ORIGINATED
2
$234,860
57
$213,203
97
$211,400
14
$160,206
38
$207,383
11
$125,531
APPLICATIONS APPROVED, NOT ACCEPTED
0
$0
11
$206,085
25
$230,698
2
$102,610
6
$148,175
2
$147,570
APPLICATIONS DENIED
0
$0
22
$187,623
94
$259,834
11
$131,071
11
$207,253
6
$138,677
APPLICATIONS WITHDRAWN
0
$0
8
$155,559
36
$227,652
3
$205,327
5
$222,214
2
$113,645
FILES CLOSED FOR INCOMPLETENESS
0
$0
1
$227,290
18
$256,053
0
$0
2
$277,850
0
$0
Aggregated Statistics For Year 2006 (Based on 2 partial tracts)
A) FHA, FSA/RHS & VA Home Purchase Loans
B) Conventional Home Purchase Loans
C) Refinancings
D) Home Improvement Loans
F) Non-occupant Loans on < 5 Family Dwellings (A B C & D)
G) Loans On Manufactured Home Dwelling (A B C & D)
Number
Average Value
Number
Average Value
Number
Average Value
Number
Average Value
Number
Average Value
Number
Average Value
LOANS ORIGINATED
1
$170,300
91
$205,285
132
$221,966
19
$163,348
43
$203,554
8
$148,600
APPLICATIONS APPROVED, NOT ACCEPTED
0
$0
14
$209,286
23
$189,520
3
$208,070
4
$208,510
1
$132,420
APPLICATIONS DENIED
1
$107,050
32
$213,770
70
$217,964
13
$97,072
11
$198,568
6
$136,152
APPLICATIONS WITHDRAWN
0
$0
15
$187,758
55
$217,027
7
$143,007
5
$180,314
3
$188,197
FILES CLOSED FOR INCOMPLETENESS
0
$0
5
$164,634
12
$210,377
1
$149,550
3
$191,600
1
$142,300
Aggregated Statistics For Year 2005 (Based on 2 partial tracts)
A) FHA, FSA/RHS & VA Home Purchase Loans
B) Conventional Home Purchase Loans
C) Refinancings
D) Home Improvement Loans
F) Non-occupant Loans on < 5 Family Dwellings (A B C & D)
G) Loans On Manufactured Home Dwelling (A B C & D)
Number
Average Value
Number
Average Value
Number
Average Value
Number
Average Value
Number
Average Value
Number
Average Value
LOANS ORIGINATED
1
$229,920
130
$186,630
170
$194,478
21
$135,964
55
$182,500
10
$148,395
APPLICATIONS APPROVED, NOT ACCEPTED
0
$0
23
$163,354
27
$193,639
1
$56,330
8
$169,024
5
$132,682
APPLICATIONS DENIED
0
$0
32
$159,491
68
$186,683
14
$82,491
13
$167,588
10
$109,097
APPLICATIONS WITHDRAWN
0
$0
23
$171,976
79
$180,895
10
$161,801
11
$153,021
6
$153,280
FILES CLOSED FOR INCOMPLETENESS
0
$0
3
$281,087
12
$229,345
1
$43,810
2
$199,120
0
$0
Aggregated Statistics For Year 2004 (Based on 2 partial tracts)
A) FHA, FSA/RHS & VA Home Purchase Loans
B) Conventional Home Purchase Loans
C) Refinancings
D) Home Improvement Loans
F) Non-occupant Loans on < 5 Family Dwellings (A B C & D)
G) Loans On Manufactured Home Dwelling (A B C & D)
Number
Average Value
Number
Average Value
Number
Average Value
Number
Average Value
Number
Average Value
Number
Average Value
LOANS ORIGINATED
4
$130,113
133
$155,900
165
$159,352
17
$93,588
62
$154,292
14
$113,408
APPLICATIONS APPROVED, NOT ACCEPTED
0
$0
17
$163,557
32
$157,556
4
$89,185
7
$119,054
3
$94,210
APPLICATIONS DENIED
0
$0
25
$146,583
72
$159,668
18
$66,758
10
$135,877
6
$127,642
APPLICATIONS WITHDRAWN
0
$0
19
$161,215
54
$140,623
5
$106,726
8
$147,078
4
$90,172
FILES CLOSED FOR INCOMPLETENESS
0
$0
2
$135,715
15
$145,463
3
$62,807
3
$147,023
1
$51,390
Aggregated Statistics For Year 2003 (Based on 2 partial tracts)
A) FHA, FSA/RHS & VA Home Purchase Loans
B) Conventional Home Purchase Loans
C) Refinancings
D) Home Improvement Loans
F) Non-occupant Loans on < 5 Family Dwellings (A B C & D)
Number
Average Value
Number
Average Value
Number
Average Value
Number
Average Value
Number
Average Value
LOANS ORIGINATED
4
$156,960
113
$131,597
218
$126,579
9
$55,924
69
$118,937
APPLICATIONS APPROVED, NOT ACCEPTED
0
$0
14
$131,831
41
$133,415
2
$76,585
7
$125,454
APPLICATIONS DENIED
1
$89,270
26
$116,988
65
$119,304
6
$56,767
10
$108,142
APPLICATIONS WITHDRAWN
2
$108,045
12
$124,596
65
$132,687
1
$36,560
5
$71,612
FILES CLOSED FOR INCOMPLETENESS
1
$78,400
4
$124,185
11
$118,465
2
$92,230
2
$121,550
Aggregated Statistics For Year 2002 (Based on 2 partial tracts)
A) FHA, FSA/RHS & VA Home Purchase Loans
B) Conventional Home Purchase Loans
C) Refinancings
D) Home Improvement Loans
F) Non-occupant Loans on < 5 Family Dwellings (A B C & D)
Number
Average Value
Number
Average Value
Number
Average Value
Number
Average Value
Number
Average Value
LOANS ORIGINATED
9
$105,079
99
$114,585
144
$122,743
3
$47,763
48
$102,430
APPLICATIONS APPROVED, NOT ACCEPTED
1
$79,390
13
$99,149
25
$116,726
2
$52,375
5
$72,534
APPLICATIONS DENIED
1
$209,170
14
$97,267
48
$109,224
4
$43,975
6
$101,290
APPLICATIONS WITHDRAWN
1
$113,970
12
$102,388
39
$115,096
0
$0
6
$109,635
FILES CLOSED FOR INCOMPLETENESS
0
$0
2
$83,670
10
$109,657
0
$0
3
$68,843
Aggregated Statistics For Year 2001 (Based on 2 partial tracts)
A) FHA, FSA/RHS & VA Home Purchase Loans
B) Conventional Home Purchase Loans
C) Refinancings
D) Home Improvement Loans
F) Non-occupant Loans on < 5 Family Dwellings (A B C & D)
Number
Average Value
Number
Average Value
Number
Average Value
Number
Average Value
Number
Average Value
LOANS ORIGINATED
14
$110,702
78
$103,592
81
$109,170
4
$23,800
36
$94,968
APPLICATIONS APPROVED, NOT ACCEPTED
2
$83,830
9
$133,114
13
$116,304
1
$58,300
3
$198,520
APPLICATIONS DENIED
2
$98,160
18
$98,381
39
$92,502
4
$32,200
8
$78,109
APPLICATIONS WITHDRAWN
2
$90,420
10
$81,658
31
$121,952
4
$24,128
5
$88,872
FILES CLOSED FOR INCOMPLETENESS
0
$0
1
$114,960
10
$109,591
0
$0
1
$70,490
Aggregated Statistics For Year 2000 (Based on 2 partial tracts)
A) FHA, FSA/RHS & VA Home Purchase Loans
B) Conventional Home Purchase Loans
C) Refinancings
D) Home Improvement Loans
F) Non-occupant Loans on < 5 Family Dwellings (A B C & D)
Number
Average Value
Number
Average Value
Number
Average Value
Number
Average Value
Number
Average Value
LOANS ORIGINATED
24
$93,453
70
$90,176
23
$97,932
3
$24,597
27
$84,021
APPLICATIONS APPROVED, NOT ACCEPTED
2
$52,870
8
$82,761
9
$88,572
3
$33,927
4
$70,985
APPLICATIONS DENIED
2
$104,915
16
$86,323
28
$110,055
7
$29,693
4
$62,585
APPLICATIONS WITHDRAWN
2
$121,385
7
$96,844
19
$88,608
2
$28,820
3
$85,973
FILES CLOSED FOR INCOMPLETENESS
0
$0
2
$86,795
4
$109,442
0
$0
1
$79,390
Aggregated Statistics For Year 1999 (Based on 1 partial tract)
A) FHA, FSA/RHS & VA Home Purchase Loans
B) Conventional Home Purchase Loans
C) Refinancings
D) Home Improvement Loans
F) Non-occupant Loans on < 5 Family Dwellings (A B C & D)

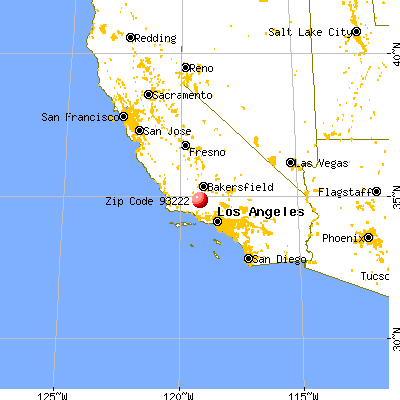


 Nearest zip codes: 93252, 93225, 93023, 93311, 93313, 93268.