Estimated zip code population in 2022: 4,323 Zip code population in 2010: 4,559 Zip code population in 2000: 4,507
Houses and condos: 1,313 Renter-occupied apartments: 557
% of renters here:
44%
State:
44%
March 2022 cost of living index in zip code 93235: 87.6 (less than average, U.S. average is 100)
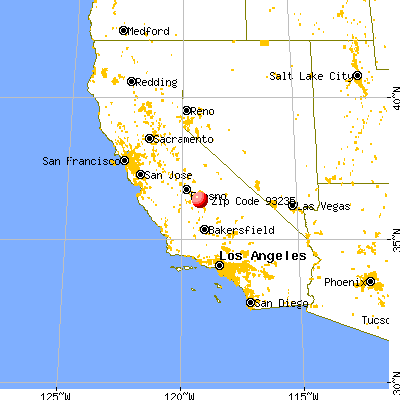
Land area: 2.9 sq. mi. Water area: 0.0 sq. mi.
Population density: 1,500 people per square mile
(low).
OSM Map
General Map
Google Map
MSN Map
OSM Map
General Map
Google Map
MSN Map
OSM Map
General Map
Google Map
MSN Map
OSM Map
General Map
Google Map
MSN Map
Please wait while loading the map...
Real estate property taxes paid for housing units in 2022:
This zip code:
0.7% ($1,529)
California:
0.7% ($4,831)
Median real estate property taxes paid for housing units with mortgages in 2022: $1,607 (0.7%) Median real estate property taxes paid for housing units with no mortgage in 2022: $1,506 (0.7%)
Business Search- 14 Million verified businesses
Males: 2,223
(51.4%)
Females: 2,100
(48.6%)
For population 25 years and over in 93235:
High school or higher: 46.4%
Bachelor's degree or higher: 8.6%
Graduate or professional degree: 2.2%
Unemployed: 3.8%
Mean travel time to work (commute): 18.8 minutes
For population 15 years and over in 93235:
Never married: 30.3%
Now married: 52.2%
Separated: 4.2%
Widowed: 3.8%
Divorced: 9.5%
Zip code 93235 compared to state average:
Median household income below state average.
Median house value significantly below state average.
Black race population percentage significantly below state average.
Hispanic race population percentage above state average.
Length of stay since moving in significantly above state average.
Percentage of population with a bachelor's degree or higher significantly below state average.
Averages for the 2020 tax year for zip code 93235, filed in 2021:
Average Adjusted Gross Income (AGI) in 2020: $33,021 (Individual Income Tax Returns)
Here:
$33,021
State:
$95,910
Salary/wage: $30,067 (reported on 88.5% of returns)
Here:
$30,067
State:
$77,331
(% of AGI for various income ranges: 1561.1% for AGIs below $25k, 4570.2% for AGIs $25k-50k, 9567.7% for AGIs $50k-75k, 14767.5% for AGIs $75k-100k, 25725.0% for AGIs $100k-200k)
Taxable interest for individuals: $168 (reported on 11.5% of returns)
This zip code:
$168
California:
$2,294
(% of AGI for various income ranges: 2.7% for AGIs below $25k, 2.9% for AGIs $25k-50k, 3.8% for AGIs $50k-75k, 2.5% for AGIs $75k-100k, 20.0% for AGIs $100k-200k)
Ordinary dividends: $300 (reported on 1.6% of returns)
Here:
$300
State:
$10,949
(% of AGI for various income ranges: 2.2% for AGIs $25k-50k)
Profit/loss from business: +$10,372 (reported on 9.4% of returns)
Here:
+$10,372
State:
+$15,671
(% of AGI for various income ranges: 104.2% for AGIs below $25k, 140.2% for AGIs $25k-50k, 553.1% for AGIs $50k-75k)
Taxable individual retirement arrangement distribution: $6,700 (reported on 1.6% of returns)
93235:
$6,700
California:
$23,505
(% of AGI for various income ranges: 36.5% for AGIs below $25k)
Total itemized deductions: $22,767 (reported on 1.6% of returns)
Here:
$22,767
State:
$39,517
(% of AGI for various income ranges: 166.6% for AGIs $25k-50k)
Taxes paid: $5,000 (reported on 1.6% of returns)
93235:
$5,000
State:
$8,807
(% of AGI for various income ranges: 36.6% for AGIs $25k-50k)
Earned income credit: $2,541 (reported on 31.9% of returns)
Here:
$2,541
State:
$2,074
(% of AGI for various income ranges: 177.1% for AGIs below $25k, 140.5% for AGIs $25k-50k)
Percentage of individuals using paid preparers for their 2020 taxes: 92.1%
Here:
92%
State:
92%
(% for various income ranges: 88.9% for AGIs below $25k, 93.8% for AGIs $25k-50k, 95.8% for AGIs $50k-75k, 100.0% for AGIs $75k-100k, 100.0% for AGIs $100k-200k)
Averages for the 2012 tax year for zip code 93235, filed in 2013:
Average Adjusted Gross Income (AGI) in 2012: $26,519 (Individual Income Tax Returns)
Here:
$26,519
State:
$72,726
Salary/wage: $23,723 (reported on 91.3% of returns)
Here:
$23,723
State:
$59,079
(% of AGI for various income ranges: 81.3% for AGIs below $25k, 85.6% for AGIs $25k-50k, 87.8% for AGIs $50k-75k, 62.9% for AGIs $75k-100k)
Taxable interest for individuals: $294 (reported on 10.6% of returns)
This zip code:
$294
California:
$2,146
(% of AGI for various income ranges: 0.1% for AGIs below $25k, 0.4% for AGIs $75k-100k)
Ordinary dividends: $1,125 (reported on 2.5% of returns)
Here:
$1,125
State:
$9,308
Profit/loss from business: +$10,267 (reported on 9.3% of returns)
Here:
+$10,267
State:
+$17,064
(% of AGI for various income ranges: 5.6% for AGIs below $25k, 3.5% for AGIs $25k-50k, 3.0% for AGIs $50k-75k)
Taxable individual retirement arrangement distribution: $4,767 (reported on 1.9% of returns)
93235:
$4,767
California:
$19,557
Total itemized deductions: $15,025 (30% of AGI, reported on 9.9% of returns)
Here:
$15,025
State:
$34,004
Here:
30.0% of AGI
State:
22.7% of AGI
(% of AGI for various income ranges: 6.0% for AGIs $25k-50k, 8.5% for AGIs $50k-75k, 14.7% for AGIs $75k-100k)
Charity contributions: $1,727 (reported on 6.8% of returns)
Here:
$1,727
State:
$4,659
(% of AGI for various income ranges: 0.4% for AGIs $25k-50k, 0.6% for AGIs $50k-75k, 1.4% for AGIs $75k-100k)
Taxes paid: $3,394 (reported on 9.9% of returns)
93235:
$3,394
State:
$14,448
(% of AGI for various income ranges: 1.2% for AGIs $25k-50k, 1.9% for AGIs $50k-75k, 3.9% for AGIs $75k-100k)
Earned income credit: $2,706 (reported on 44.7% of returns)
Here:
$2,706
State:
$2,286
(% of AGI for various income ranges: 10.9% for AGIs below $25k, 2.9% for AGIs $25k-50k)
Percentage of individuals using paid preparers for their 2012 taxes: 75.2%
Here:
75%
State:
64%
(% for various income ranges: 73.4% for AGIs below $25k, 79.6% for AGIs $25k-50k, 75.0% for AGIs $50k-75k, 66.7% for AGIs $75k-100k)
Averages for the 2004 tax year for zip code 93235, filed in 2005:
Average Adjusted Gross Income (AGI) in 2004: $24,331 (Individual Income Tax Returns)
Here:
$24,331
State:
$58,600
Salary/wage: $22,898 (reported on 92.6% of returns)
Here:
$22,898
State:
$49,455
(% of AGI for various income ranges: 107.9% for AGIs below $10k, 87.5% for AGIs $10k-25k, 89.8% for AGIs $25k-50k, 91.5% for AGIs $50k-75k, 79.6% for AGIs $75k-100k, 61.0% for AGIs over 100k)
Taxable interest for individuals: $441 (reported on 18.0% of returns)
This zip code:
$441
California:
$2,365
(% of AGI for various income ranges: 0.5% for AGIs below $10k, 0.6% for AGIs $10k-25k, 0.2% for AGIs $25k-50k, 0.2% for AGIs $50k-75k, 0.2% for AGIs $75k-100k, 0.2% for AGIs over 100k)
Taxable dividends: $1,593 (reported on 3.6% of returns)
Here:
$1,593
State:
$4,746
Net capital gain/loss: +$5,581 (reported on 2.9% of returns)
Here:
+$5,581
State:
+$23,418
Profit/loss from business: +$5,214 (reported on 7.4% of returns)
Here:
+$5,214
State:
+$16,826
(% of AGI for various income ranges: 8.3% for AGIs below $10k, 2.7% for AGIs $10k-25k, 1.1% for AGIs $25k-50k, 0.1% for AGIs $50k-75k)
Total itemized deductions: $15,102 (27% of AGI, reported on 11.1% of returns)
Here:
$15,102
State:
$28,113
Here:
26.8% of AGI
State:
25.3% of AGI
(% of AGI for various income ranges: 1.5% for AGIs $10k-25k, 6.7% for AGIs $25k-50k, 13.0% for AGIs $50k-75k, 18.8% for AGIs $75k-100k, 13.5% for AGIs over 100k)
Charity contributions deductions: $2,417 (4% of AGI, reported on 10.0% of returns)
Here:
$2,417
State:
$3,923
Here:
4.3% of AGI
State:
3.3% of AGI
(% of AGI for various income ranges: 0.2% for AGIs $10k-25k, 1.0% for AGIs $25k-50k, 1.7% for AGIs $50k-75k, 2.1% for AGIs $75k-100k, 2.5% for AGIs over 100k)
Total tax: $2,500 (reported on 47.1% of returns)
93235:
$2,500
State:
$10,761
(% of AGI for various income ranges: 1.8% for AGIs below $10k, 2.2% for AGIs $10k-25k, 3.7% for AGIs $25k-50k, 6.5% for AGIs $50k-75k, 10.9% for AGIs $75k-100k, 15.6% for AGIs over 100k)
Earned income credit: $2,056 (reported on 44.2% of returns)
Here:
$2,056
State:
$1,763
Percentage of individuals using paid preparers for their 2004 taxes: 72.1%
Here:
72%
State:
66%
(% for various income ranges: 69.6% for AGIs below $10k, 73.5% for AGIs $10k-25k, 72.7% for AGIs $25k-50k, 67.9% for AGIs $50k-75k, 69.6% for AGIs $75k-100k, 72.7% for AGIs over 100k)
Household received Food Stamps/SNAP in the past 12 months: 576 Household did not receive Food Stamps/SNAP in the past 12 months: 787
Women who did not have a birth in the past 12 months: 774 (449 now married, 318 unmarried)
Housing units in zip code 93235 with a mortgage: 352 Median monthly owner costs for units with a mortgage: $1,224 Median monthly owner costs for units without a mortgage: $413
Residents with income below the poverty level in 2022:
This zip code:
11.9%
Whole state:
12.2%
Residents with income below 50% of the poverty level in 2022:
This zip code:
3.4%
Whole state:
6.2%
Median number of rooms in houses and condos:
Here:
5.3
State:
6.0
Median number of rooms in apartments:
Here:
4.9
State:
3.9
Notable locations in this zip code not listed on our city pages
Size of family households: 240 2-persons, 239 3-persons, 113 4-persons, 170 5-persons, 222 6-persons, 70 7-or-more-persons
Size of nonfamily households: 130 1-person, 78 2-persons
445 married couples with children.
573 single-parent households (224 men, 349 women).
23.7% of residents of 93235 zip code speak English at home.
78.3% of residents speak Spanish at home (31% very well, 32% well, 25% not well, 12% not at all).
Foreign born population: 1,366 (31.6%) (36.3% of them are naturalized citizens)
This zip code:
31.6%
Whole state:
26.7%
99%Honduras
1%English
0%Irish
0%Arab
Year of entry for the foreign-born population
512010 or later
2572000 to 2009
4421990 to 1999
570Before 1990
Facilities with environmental interests located in this zip code:
IVANHOE ELEMENTARY (16030 AVE. 332 in IVANHOE, CA)
(National Center for Education Statistics) - STATE ID-6054639 Organizations: VISALIA UNIFIED (SCHOOL DISTRICT)
LEFFINGWELL AG SALES (MAIN & DEPOT in IVANHOE, CA)
COMPLIANCE ACTIVITY (Tracking inspections of insecticide, fungicide, and rodenticide, and toxic substances)
LEFFINGWELL AG SALES CO., INC. (32889 ROAD 159 in IVANHOE, CA)
COMPLIANCE ACTIVITY (Tracking inspections of insecticide, fungicide, and rodenticide, and toxic substances)
64.7%Utility gas
31.1%Electricity
3.1%Other fuel
0.8%Bottled, tank, or LP gas
Population in 1990: 3,326. Population change in the 1990s: +1,181 (+35.5%).
Place of birth for U.S.-born residents:
This state: 2,712
Midwest: 20
South: 171
West: 62
63% of the 93235 zip code residents lived in the same house 5 years ago. Out of people who lived in different houses, 86% lived in this county. Out of people who lived in different counties, 50% lived in California.
100% of the 93235 zip code residents lived in the same house 1 year ago. Out of people who lived in different houses, 320% moved from this county.
Private vs. public school enrollment:
Students in private schools in grades 1 to 8 (elementary and middle school): 10
Here:
1.4%
California:
10.5%
Students in private schools in grades 9 to 12 (high school):
Here:
0.0%
California:
8.5%
Students in private undergraduate colleges:
Here:
0.0%
California:
15.9%
Occupation by median earnings in the past 12 months ($)
53,463Construction and extraction occupations
44,072Transportation occupations
34,045Farming, fishing, and forestry occupations
29,125Production occupations
28,691Health technologists and technicians
28,132Healthcare support occupations
Top industries in this zip code by the number of employees in 2005:
Health Care and Social Assistance: All Other Outpatient Care Centers (10-19 employees: 1 establishment)
Construction: Commercial and Institutional Building Construction (10-19: 1)
Construction: Power and Communication Line and Related Structures Construction (10-19: 1)
Other Services (except Public Administration): Religious Organizations (5-9: 1, 1-4: 1)
Real Estate and Rental and Leasing: Offices of Real Estate Agents and Brokers (5-9: 1)
Construction: Highway, Street, and Bridge Construction (5-9: 1)
Fatal accident statistics in 2014:
Fatal accident count: 1
Vehicles involved in fatal accidents: 1
Fatal accidents caused by drunken drivers: 0
Fatalities: 1
Persons involved in fatal accidents: 1
Pedestrians involved in fatal accidents: 1
Fatal accident statistics in 2010:
Fatal accident count: 1
Vehicles involved in fatal accidents: 2
Fatal accidents caused by drunken drivers: 0
Fatalities: 1
Persons involved in fatal accidents: 5
Pedestrians involved in fatal accidents: 0
Home Mortgage Disclosure Act Aggregated Statistics For Year 2009 (Based on 2 partial tracts)
A) FHA, FSA/RHS & VA Home Purchase Loans
B) Conventional Home Purchase Loans
C) Refinancings
D) Home Improvement Loans
F) Non-occupant Loans on < 5 Family Dwellings (A B C & D)
Number
Average Value
Number
Average Value
Number
Average Value
Number
Average Value
Number
Average Value
LOANS ORIGINATED
16
$126,663
8
$132,886
18
$156,722
0
$0
5
$74,080
APPLICATIONS APPROVED, NOT ACCEPTED
2
$124,340
1
$88,130
2
$167,695
0
$0
1
$59,550
APPLICATIONS DENIED
2
$121,125
2
$136,250
10
$194,085
1
$96,710
0
$0
APPLICATIONS WITHDRAWN
3
$131,567
1
$94,800
7
$162,384
0
$0
1
$73,600
FILES CLOSED FOR INCOMPLETENESS
0
$0
0
$0
2
$186,270
0
$0
0
$0
Aggregated Statistics For Year 2008 (Based on 2 partial tracts)
A) FHA, FSA/RHS & VA Home Purchase Loans
B) Conventional Home Purchase Loans
C) Refinancings
D) Home Improvement Loans
F) Non-occupant Loans on < 5 Family Dwellings (A B C & D)
Number
Average Value
Number
Average Value
Number
Average Value
Number
Average Value
Number
Average Value
LOANS ORIGINATED
6
$164,755
8
$151,734
21
$158,278
2
$86,705
6
$103,538
APPLICATIONS APPROVED, NOT ACCEPTED
1
$95,990
2
$166,980
6
$140,697
0
$0
2
$111,835
APPLICATIONS DENIED
4
$156,498
3
$174,680
20
$189,202
4
$98,435
2
$161,975
APPLICATIONS WITHDRAWN
2
$214,025
3
$121,243
8
$181,509
0
$0
2
$120,290
FILES CLOSED FOR INCOMPLETENESS
0
$0
0
$0
2
$267,140
0
$0
0
$0
Aggregated Statistics For Year 2007 (Based on 2 partial tracts)
A) FHA, FSA/RHS & VA Home Purchase Loans
B) Conventional Home Purchase Loans
C) Refinancings
D) Home Improvement Loans
F) Non-occupant Loans on < 5 Family Dwellings (A B C & D)
Number
Average Value
Number
Average Value
Number
Average Value
Number
Average Value
Number
Average Value
LOANS ORIGINATED
1
$268,210
25
$174,696
42
$160,093
9
$125,293
13
$157,743
APPLICATIONS APPROVED, NOT ACCEPTED
0
$0
5
$189,036
13
$178,174
2
$122,195
2
$205,925
APPLICATIONS DENIED
0
$0
10
$186,296
47
$202,161
7
$110,763
10
$217,477
APPLICATIONS WITHDRAWN
0
$0
4
$197,705
22
$185,450
2
$65,385
1
$122,910
FILES CLOSED FOR INCOMPLETENESS
0
$0
2
$168,050
6
$182,382
1
$112,430
1
$100,520
Aggregated Statistics For Year 2006 (Based on 2 partial tracts)
A) FHA, FSA/RHS & VA Home Purchase Loans
B) Conventional Home Purchase Loans
C) Refinancings
D) Home Improvement Loans
F) Non-occupant Loans on < 5 Family Dwellings (A B C & D)
G) Loans On Manufactured Home Dwelling (A B C & D)
Number
Average Value
Number
Average Value
Number
Average Value
Number
Average Value
Number
Average Value
Number
Average Value
LOANS ORIGINATED
1
$272,500
58
$153,224
71
$177,848
13
$99,495
14
$164,375
1
$221,760
APPLICATIONS APPROVED, NOT ACCEPTED
0
$0
9
$158,614
18
$194,146
5
$64,172
5
$160,832
0
$0
APPLICATIONS DENIED
0
$0
12
$161,837
44
$190,008
5
$107,380
7
$148,977
0
$0
APPLICATIONS WITHDRAWN
1
$156,970
10
$177,388
33
$197,598
1
$135,770
1
$247,250
0
$0
FILES CLOSED FOR INCOMPLETENESS
0
$0
1
$166,260
9
$201,359
1
$131,250
0
$0
0
$0
Aggregated Statistics For Year 2005 (Based on 2 partial tracts)
A) FHA, FSA/RHS & VA Home Purchase Loans
B) Conventional Home Purchase Loans
C) Refinancings
D) Home Improvement Loans
F) Non-occupant Loans on < 5 Family Dwellings (A B C & D)
Number
Average Value
Number
Average Value
Number
Average Value
Number
Average Value
Number
Average Value
LOANS ORIGINATED
2
$186,870
61
$152,468
108
$161,103
15
$116,178
26
$145,925
APPLICATIONS APPROVED, NOT ACCEPTED
0
$0
7
$135,706
18
$170,816
2
$102,070
5
$151,590
APPLICATIONS DENIED
0
$0
15
$150,765
48
$157,341
10
$104,403
7
$160,343
APPLICATIONS WITHDRAWN
0
$0
13
$161,023
59
$158,359
7
$142,376
5
$148,494
FILES CLOSED FOR INCOMPLETENESS
0
$0
1
$297,510
5
$167,074
1
$65,030
0
$0
Aggregated Statistics For Year 2004 (Based on 2 partial tracts)
A) FHA, FSA/RHS & VA Home Purchase Loans
B) Conventional Home Purchase Loans
C) Refinancings
D) Home Improvement Loans
F) Non-occupant Loans on < 5 Family Dwellings (A B C & D)
G) Loans On Manufactured Home Dwelling (A B C & D)
Number
Average Value
Number
Average Value
Number
Average Value
Number
Average Value
Number
Average Value
Number
Average Value
LOANS ORIGINATED
4
$127,258
51
$129,712
99
$127,512
6
$66,855
24
$108,917
0
$0
APPLICATIONS APPROVED, NOT ACCEPTED
0
$0
6
$123,547
20
$134,154
4
$69,615
3
$87,023
0
$0
APPLICATIONS DENIED
0
$0
12
$111,239
47
$123,965
15
$96,535
5
$131,200
1
$117,190
APPLICATIONS WITHDRAWN
1
$101,240
8
$114,366
49
$126,771
3
$65,347
3
$111,160
0
$0
FILES CLOSED FOR INCOMPLETENESS
0
$0
1
$122,200
7
$153,230
0
$0
1
$84,080
0
$0
Aggregated Statistics For Year 2003 (Based on 2 partial tracts)
A) FHA, FSA/RHS & VA Home Purchase Loans
B) Conventional Home Purchase Loans
C) Refinancings
D) Home Improvement Loans
F) Non-occupant Loans on < 5 Family Dwellings (A B C & D)
Detailed PMIC statistics for the following Tracts:0013.01
2005 - 2018 National Fire Incident Reporting System (NFIRS) incidents
According to the data from the years 2005 - 2018 the average number of fire incidents per year is 13. The highest number of reported fire incidents - 31 took place in 2014, and the least - 0 in 2009. The data has a dropping trend.
When looking into fire subcategories, the most incidents belonged to: Outside Fires (52.4%), and Mobile Property/Vehicle Fires (25.4%).
Fire incident types reported to NFIRS in Zip Code 93235


 Nearest zip codes: 93292, 93223, 93615, 93286, 93291, 93277.


 According to the data from the years 2005 - 2018 the average number of fire incidents per year is 13. The highest number of reported fire incidents - 31 took place in 2014, and the least - 0 in 2009. The data has a dropping trend.
 When looking into fire subcategories, the most incidents belonged to: Outside Fires (52.4%), and Mobile Property/Vehicle Fires (25.4%).