Averages for the 2020 tax year for zip code 93238, filed in 2021:
Average Adjusted Gross Income (AGI) in 2020: $66,349 (Individual Income Tax Returns)
Here:
$66,349
State:
$95,910
Salary/wage: $52,449 (reported on 58.9% of returns)
Here:
$52,449
State:
$77,331
(% of AGI for various income ranges: 918.0% for AGIs below $25k, 3348.9% for AGIs $25k-50k, 6296.0% for AGIs $50k-75k, 7763.3% for AGIs $75k-100k, 18784.0% for AGIs $100k-200k)
Taxable interest for individuals: $1,510 (reported on 42.5% of returns)
This zip code:
$1,510
California:
$2,294
(% of AGI for various income ranges: 34.0% for AGIs below $25k, 113.3% for AGIs $25k-50k, 66.0% for AGIs $50k-75k, 46.7% for AGIs $75k-100k, 312.0% for AGIs $100k-200k)
Ordinary dividends: $6,341 (reported on 23.3% of returns)
Here:
$6,341
State:
$10,949
(% of AGI for various income ranges: 49.3% for AGIs below $25k, 225.6% for AGIs $25k-50k, 286.7% for AGIs $75k-100k, 876.0% for AGIs $100k-200k)
Net capital gain/loss in AGI: +$21,087 (reported on 20.5% of returns)
Here:
+$21,087
State:
+$49,306
(% of AGI for various income ranges: 24.0% for AGIs below $25k, 37.8% for AGIs $25k-50k, 124.0% for AGIs $50k-75k, 686.0% for AGIs $100k-200k)
Profit/loss from business: +$13,625 (reported on 16.4% of returns)
Here:
+$13,625
State:
+$15,671
(% of AGI for various income ranges: 86.0% for AGIs below $25k, 221.1% for AGIs $25k-50k, 480.0% for AGIs $50k-75k, 2134.0% for AGIs $100k-200k)
Taxable individual retirement arrangement distribution: $19,082 (reported on 15.1% of returns)
93238:
$19,082
California:
$23,505
(% of AGI for various income ranges: 102.0% for AGIs below $25k, 368.9% for AGIs $25k-50k, 834.0% for AGIs $50k-75k, 2394.0% for AGIs $100k-200k)
Total itemized deductions: $29,014 (reported on 9.6% of returns)
Here:
$29,014
State:
$39,517
(% of AGI for various income ranges: 352.0% for AGIs below $25k, 978.0% for AGIs $50k-75k, 2028.0% for AGIs $100k-200k)
Charity contributions: $9,425 (reported on 5.5% of returns)
Here:
$9,425
State:
$12,598
(% of AGI for various income ranges: 57.3% for AGIs below $25k, 582.0% for AGIs $100k-200k)
Taxes paid: $7,029 (reported on 9.6% of returns)
93238:
$7,029
State:
$8,807
(% of AGI for various income ranges: 414.0% for AGIs $50k-75k, 570.0% for AGIs $100k-200k)
Earned income credit: $1,814 (reported on 9.6% of returns)
Here:
$1,814
State:
$2,074
(% of AGI for various income ranges: 84.7% for AGIs below $25k)
Percentage of individuals using paid preparers for their 2020 taxes: 90.4%
Here:
90%
State:
92%
(% for various income ranges: 84.6% for AGIs below $25k, 93.3% for AGIs $25k-50k, 90.0% for AGIs $50k-75k, 100.0% for AGIs $75k-100k, 91.7% for AGIs $100k-200k, 100.0% for AGIs over 200k)
Averages for the 2012 tax year for zip code 93238, filed in 2013:
Average Adjusted Gross Income (AGI) in 2012: $49,804 (Individual Income Tax Returns)
Here:
$49,804
State:
$72,726
Salary/wage: $39,346 (reported on 65.7% of returns)
Here:
$39,346
State:
$59,079
(% of AGI for various income ranges: 49.4% for AGIs below $25k, 53.2% for AGIs $25k-50k, 46.1% for AGIs $50k-75k, 55.2% for AGIs $75k-100k, 53.0% for AGIs $100k-200k)
Taxable interest for individuals: $1,597 (reported on 45.7% of returns)
This zip code:
$1,597
California:
$2,146
(% of AGI for various income ranges: 4.7% for AGIs below $25k, 1.3% for AGIs $25k-50k, 2.4% for AGIs $50k-75k, 1.3% for AGIs $75k-100k, 0.4% for AGIs $100k-200k)
Ordinary dividends: $4,406 (reported on 24.3% of returns)
Here:
$4,406
State:
$9,308
(% of AGI for various income ranges: 4.6% for AGIs below $25k, 2.1% for AGIs $25k-50k, 1.3% for AGIs $50k-75k, 3.0% for AGIs $75k-100k, 1.6% for AGIs $100k-200k)
Net capital gain/loss in AGI: +$7,847 (reported on 21.4% of returns)
Here:
+$7,847
State:
+$30,460
(% of AGI for various income ranges: 4.0% for AGIs $50k-75k, 0.2% for AGIs $75k-100k, 6.8% for AGIs $100k-200k)
Profit/loss from business: +$10,917 (reported on 17.1% of returns)
Here:
+$10,917
State:
+$17,064
(% of AGI for various income ranges: 12.9% for AGIs below $25k, 5.9% for AGIs $50k-75k, 3.6% for AGIs $100k-200k)
Taxable individual retirement arrangement distribution: $14,415 (reported on 18.6% of returns)
93238:
$14,415
California:
$19,557
(% of AGI for various income ranges: 8.7% for AGIs below $25k, 5.6% for AGIs $25k-50k, 8.8% for AGIs $50k-75k, 5.3% for AGIs $100k-200k)
Total itemized deductions: $22,317 (26% of AGI, reported on 34.3% of returns)
Here:
$22,317
State:
$34,004
Here:
25.6% of AGI
State:
22.7% of AGI
(% of AGI for various income ranges: 23.4% for AGIs below $25k, 12.8% for AGIs $25k-50k, 11.3% for AGIs $50k-75k, 13.1% for AGIs $75k-100k, 16.9% for AGIs $100k-200k)
Charity contributions: $2,540 (reported on 28.6% of returns)
Here:
$2,540
State:
$4,659
(% of AGI for various income ranges: 0.6% for AGIs below $25k, 0.8% for AGIs $25k-50k, 0.8% for AGIs $50k-75k, 1.3% for AGIs $75k-100k, 2.2% for AGIs $100k-200k)
Taxes paid: $7,521 (reported on 34.3% of returns)
93238:
$7,521
State:
$14,448
(% of AGI for various income ranges: 3.8% for AGIs below $25k, 2.9% for AGIs $25k-50k, 3.5% for AGIs $50k-75k, 5.3% for AGIs $75k-100k, 7.0% for AGIs $100k-200k)
Earned income credit: $1,618 (reported on 15.7% of returns)
Here:
$1,618
State:
$2,286
(% of AGI for various income ranges: 3.7% for AGIs below $25k, 0.9% for AGIs $25k-50k)
Percentage of individuals using paid preparers for their 2012 taxes: 58.6%
Here:
59%
State:
64%
(% for various income ranges: 51.6% for AGIs below $25k, 57.1% for AGIs $25k-50k, 66.7% for AGIs $50k-75k, 57.1% for AGIs $75k-100k, 77.8% for AGIs $100k-200k)
Averages for the 2004 tax year for zip code 93238, filed in 2005:
Average Adjusted Gross Income (AGI) in 2004: $39,588 (Individual Income Tax Returns)
Here:
$39,588
State:
$58,600
Salary/wage: $34,626 (reported on 64.5% of returns)
Here:
$34,626
State:
$49,455
(% of AGI for various income ranges: 158.8% for AGIs below $10k, 53.7% for AGIs $10k-25k, 52.2% for AGIs $25k-50k, 54.8% for AGIs $50k-75k, 63.9% for AGIs $75k-100k, 51.7% for AGIs over 100k)
Taxable interest for individuals: $1,925 (reported on 62.6% of returns)
This zip code:
$1,925
California:
$2,365
(% of AGI for various income ranges: 16.3% for AGIs below $10k, 5.4% for AGIs $10k-25k, 4.4% for AGIs $25k-50k, 2.0% for AGIs $50k-75k, 1.5% for AGIs $75k-100k, 2.1% for AGIs over 100k)
Taxable dividends: $2,965 (reported on 28.2% of returns)
Here:
$2,965
State:
$4,746
(% of AGI for various income ranges: 4.8% for AGIs below $10k, 3.5% for AGIs $10k-25k, 3.1% for AGIs $25k-50k, 3.2% for AGIs $50k-75k, 0.6% for AGIs $75k-100k, 0.8% for AGIs over 100k)
Net capital gain/loss: +$9,038 (reported on 25.7% of returns)
Here:
+$9,038
State:
+$23,418
(% of AGI for various income ranges: -5.6% for AGIs below $10k, -0.9% for AGIs $10k-25k, 2.3% for AGIs $25k-50k, 2.9% for AGIs $50k-75k, 5.9% for AGIs $75k-100k, 14.7% for AGIs over 100k)
Profit/loss from business: +$8,589 (reported on 20.8% of returns)
Here:
+$8,589
State:
+$16,826
(% of AGI for various income ranges: 5.6% for AGIs below $10k, 6.7% for AGIs $10k-25k, 3.9% for AGIs $25k-50k, 5.5% for AGIs $50k-75k, 1.9% for AGIs $75k-100k, 4.8% for AGIs over 100k)
IRA payment deduction: $3,438 (reported on 2.0% of returns)
93238:
$3,438
California:
$3,192
Total itemized deductions: $17,154 (25% of AGI, reported on 34.7% of returns)
Here:
$17,154
State:
$28,113
Here:
25.3% of AGI
State:
25.3% of AGI
(% of AGI for various income ranges: 47.7% for AGIs below $10k, 13.1% for AGIs $10k-25k, 14.7% for AGIs $25k-50k, 12.2% for AGIs $50k-75k, 18.9% for AGIs $75k-100k, 14.0% for AGIs over 100k)
Charity contributions deductions: $2,454 (4% of AGI, reported on 29.5% of returns)
Here:
$2,454
State:
$3,923
Here:
3.6% of AGI
State:
3.3% of AGI
(% of AGI for various income ranges: 1.7% for AGIs $10k-25k, 1.1% for AGIs $25k-50k, 1.4% for AGIs $50k-75k, 3.0% for AGIs $75k-100k, 2.1% for AGIs over 100k)
Total tax: $5,403 (reported on 78.1% of returns)
93238:
$5,403
State:
$10,761
(% of AGI for various income ranges: 9.8% for AGIs below $10k, 4.0% for AGIs $10k-25k, 7.3% for AGIs $25k-50k, 10.5% for AGIs $50k-75k, 10.5% for AGIs $75k-100k, 16.6% for AGIs over 100k)
Earned income credit: $1,422 (reported on 14.4% of returns)
Here:
$1,422
State:
$1,763
Percentage of individuals using paid preparers for their 2004 taxes: 65.7%
Here:
66%
State:
66%
(% for various income ranges: 54.0% for AGIs below $10k, 64.2% for AGIs $10k-25k, 68.7% for AGIs $25k-50k, 70.6% for AGIs $50k-75k, 69.2% for AGIs $75k-100k, 82.5% for AGIs over 100k)
Creeks: Fay Creek (A), Mill Creek (B), Parker Meadow Creek (C), Gold Ledge Creek (D), Tobias Creek (E), Corral Creek (F), Caldwell Creek (G), Bull Run Creek (H), Brush Creek (I). Display/hide their locations on the map
In group quarters: 41 (-1 institutionalized population)
Size of family households: 93 2-persons, 3 4-persons, 58 5-persons
Size of nonfamily households: 218 1-person, 37 2-persons
208 married couples with children.
0 single-parent households ().
93.7% of residents of 93238 zip code speak English at home.
0.3% of residents speak Spanish at home (100% very well).
6.9% of residents speak other Indo-European language at home (100% very well).
0.3% of residents speak other language at home (100% very well).
Foreign born population: 22 (2.6%) (100.0% of them are naturalized citizens)
This zip code:
2.6%
Whole state:
26.7%
95%Taiwan
19%Italian
18%English
12%Irish
10%American
9%European
8%French
1%German
Year of entry for the foreign-born population
02010 or later
02000 to 2009
211990 to 1999
0Before 1990
Facilities with environmental interests located in this zip code:
JOHNSONDALE ELEMENTARY (STAR ROUTE 1, BOX 104 in KERNVILLE, CA)
(National Center for Education Statistics) - STATE ID-6054118 Organizations: HOT SPRINGS ELEMENTARY (SCHOOL DISTRICT)
KERNVILLE ELEMENTARY (13550 SIERRA WAY in KERNVILLE, CA)
(National Center for Education Statistics) - STATE ID-6009641 Organizations: KERNVILLE UNION ELEMENTARY (SCHOOL DISTRICT)
KERN RIVER NO 3 (15171 SIERRAWAY in KERNVILLE, CA)
HAZARDOUS WASTE BIENNIAL REPORTER (Resource Conservation and Recovery Act (tracking hazardous waste)) Small Quantity Generators, between 100 kg and 1000 kg of hazardous waste/month (Resource Conservation and Recovery Act (tracking hazardous waste)) Alternative names: KERN RIVER NUMBER 3 POWERHOUSE
KERN VALLEY LANDFILL (1M E KERNVILLE NEAR LAKE ISABE in KERNVILLE, CA)
CRITERIA AND HAZARDOUS AIR POLLUTANT INVENTORY (Inventory of air pollution sources) Business SIC classification: REFUSE SYSTEMS Business NAICS classification: SOLID WASTE LANDFILL.
KERNVILLE BURN DUMP (1/4 MI W/0 BULLARD RD in KERNVILLE, CA)
CRITERIA AND HAZARDOUS AIR POLLUTANT INVENTORY (Inventory of air pollution sources) Business SIC classification: REFUSE SYSTEMS Business NAICS classification: SOLID WASTE LANDFILL.
LEBEC SANITARY LANDFILL (1M E KERNVILLE NEAR LAKE ISABE in KERNVILLE, CA)
CRITERIA AND HAZARDOUS AIR POLLUTANT INVENTORY (Inventory of air pollution sources) Business SIC classification: REFUSE SYSTEMS Business NAICS classification: SOLID WASTE LANDFILL.
Housing units lacking complete plumbing facilities: 5.4%
37.4%Utility gas
27.4%Wood
17.6%Bottled, tank, or LP gas
15.1%Electricity
3.0%Other fuel
Population in 1990: 812. Population change in the 1990s: +1,059 (+130.4%).
Place of birth for U.S.-born residents:
This state: 391
Northeast: 91
Midwest: 178
South: 100
West: 59
55% of the 93238 zip code residents lived in the same house 5 years ago. Out of people who lived in different houses, 60% lived in this county. Out of people who lived in different counties, 50% lived in California.
100% of the 93238 zip code residents lived in the same house 1 year ago. Out of people who lived in different houses, 200% moved from this county.
Private vs. public school enrollment:
Students in private schools in grades 1 to 8 (elementary and middle school): 68
Here:
50.3%
California:
10.5%
Students in private schools in grades 9 to 12 (high school): 1
Here:
50.2%
California:
8.5%
Students in private undergraduate colleges:
Here:
0.0%
California:
15.9%
Companies with federal contracts located in this zip code:
JERRY GULL COMPANY (231 BURMA RD in KERNVILLE, CA; small business) 2 employees, $79000 revenue. : $316,504 in 6 contractsfrom 1999 to 2003
Contracts for Lease or Rental of Facilities -- Office Buildings by Forest Service, Forest Service (disused code: now 12C2) Signed by year:2000: $72,000; 2001: $72,000; 2002: $72,344; 2003: $28,160; 2004: $0; 2005: $0; 2006: $0.
Biggest contracts:
$72,344 with Forest Service for Lease or Rental of Facilities -- Office Buildings. Signed on 2002-10-15. Completion date: 2003-09-15.
$72,000 with Forest Service (disused code: now 12C2) for Lease or Rental of Facilities -- Office Buildings. Signed on 2001-10-15. Completion date: 2002-09-15.
$72,000, same as above.Signed on 2000-10-15. Completion date: 2001-09-15.
$72,000, same as above.Signed on 1999-10-15. Completion date: 2000-09-15.
THE PLUMBING COMPANY OF KERNVI (242 BURMA ROAD in KERNVILLE, CA; small business) : $105,031 in 3 contractsfrom 2001 to 2002
$84,469 with Navy for Maintenance, Repair and Rebuilding of Equipment -- Plumbing, Heating, and Waste Disposal Equipment. Signed on 2001-09-28. Completion date: 2002-01-31.
$20,562, same as above.Signed on 2002-04-19. Completion date: 2002-01-31.
$0, same as above.Signed on 2001-09-28. Completion date: 2002-01-31.
CHERYL'S DINER (11030 KERNVILLE RD in KERNVILLE, CA; small business)
$3,248 with Forest Service for Special Dietary Foods and Food Specialty Preparations. Signed on 2006-08-17. Completion date: 2006-08-17.
Top industries in this zip code by the number of employees in 2005:
Utilities: Hydroelectric Power Generation (20-49: 1)
Other Services (except Public Administration): Other Similar Organizations (except Business, Professional, Labor, and Political Organizations) (20-49: 1)
Accommodation and Food Services: Hotels (except Casino Hotels) and Motels (5-9: 4)
Accommodation and Food Services: RV (Recreational Vehicle) Parks and Campgrounds (10-19: 1, 1-4: 3)
Accommodation and Food Services: Limited-Service Restaurants (10-19: 1, 1-4: 1)
Health Care and Social Assistance: Homes for the Elderly (10-19: 1)
Arts, Entertainment, and Recreation: All Other Amusement and Recreation Industries (10-19: 1)
People in group quarters in 2010:
8 people in group homes intended for adults
People in group quarters in 2000:
125 people in training schools for juvenile delinquents
17 people in other noninstitutional group quarters
Fatal accident statistics in 2012:
Fatal accident count: 3
Vehicles involved in fatal accidents: 3
Fatal accidents caused by drunken drivers: 2
Fatalities: 3
Persons involved in fatal accidents: 3
Pedestrians involved in fatal accidents: 0
Fatal accident statistics in 2010:
Fatal accident count: 1
Vehicles involved in fatal accidents: 1
Fatal accidents caused by drunken drivers: 1
Fatalities: 1
Persons involved in fatal accidents: 1
Pedestrians involved in fatal accidents: 0
Home Mortgage Disclosure Act Aggregated Statistics For Year 2009 (Based on 2 partial tracts)
A) FHA, FSA/RHS & VA Home Purchase Loans
B) Conventional Home Purchase Loans
C) Refinancings
D) Home Improvement Loans
F) Non-occupant Loans on < 5 Family Dwellings (A B C & D)
G) Loans On Manufactured Home Dwelling (A B C & D)
Number
Average Value
Number
Average Value
Number
Average Value
Number
Average Value
Number
Average Value
Number
Average Value
LOANS ORIGINATED
3
$193,307
6
$207,550
23
$178,416
2
$129,615
10
$131,992
1
$94,240
APPLICATIONS APPROVED, NOT ACCEPTED
0
$0
1
$331,790
3
$214,047
0
$0
1
$135,300
0
$0
APPLICATIONS DENIED
1
$190,290
3
$129,443
17
$204,707
1
$30,470
5
$156,108
3
$147,603
APPLICATIONS WITHDRAWN
1
$68,160
1
$96,820
10
$205,037
0
$0
3
$127,810
1
$73,070
FILES CLOSED FOR INCOMPLETENESS
0
$0
0
$0
1
$225,410
0
$0
1
$90,110
0
$0
Aggregated Statistics For Year 2008 (Based on 2 partial tracts)
A) FHA, FSA/RHS & VA Home Purchase Loans
B) Conventional Home Purchase Loans
C) Refinancings
D) Home Improvement Loans
F) Non-occupant Loans on < 5 Family Dwellings (A B C & D)
G) Loans On Manufactured Home Dwelling (A B C & D)
Number
Average Value
Number
Average Value
Number
Average Value
Number
Average Value
Number
Average Value
Number
Average Value
LOANS ORIGINATED
2
$176,995
9
$201,740
25
$212,736
2
$134,005
10
$192,333
2
$160,990
APPLICATIONS APPROVED, NOT ACCEPTED
0
$0
3
$157,673
3
$180,740
1
$43,890
1
$207,080
0
$0
APPLICATIONS DENIED
1
$100,180
3
$174,887
15
$260,885
5
$159,412
3
$154,663
1
$177,130
APPLICATIONS WITHDRAWN
1
$154,150
1
$213,790
7
$260,340
1
$68,940
1
$239,350
1
$88,050
FILES CLOSED FOR INCOMPLETENESS
0
$0
0
$0
2
$207,720
0
$0
0
$0
0
$0
Aggregated Statistics For Year 2007 (Based on 2 partial tracts)
A) FHA, FSA/RHS & VA Home Purchase Loans
B) Conventional Home Purchase Loans
C) Refinancings
D) Home Improvement Loans
F) Non-occupant Loans on < 5 Family Dwellings (A B C & D)
G) Loans On Manufactured Home Dwelling (A B C & D)
Number
Average Value
Number
Average Value
Number
Average Value
Number
Average Value
Number
Average Value
Number
Average Value
LOANS ORIGINATED
1
$134,260
17
$276,638
34
$208,747
7
$97,304
12
$200,127
3
$121,613
APPLICATIONS APPROVED, NOT ACCEPTED
0
$0
2
$182,160
7
$216,814
2
$40,280
2
$162,925
1
$95,530
APPLICATIONS DENIED
0
$0
5
$332,200
28
$216,086
4
$144,850
6
$211,940
3
$144,593
APPLICATIONS WITHDRAWN
0
$0
2
$248,515
12
$225,107
1
$104,570
3
$201,827
1
$127,810
FILES CLOSED FOR INCOMPLETENESS
0
$0
0
$0
5
$260,730
1
$72,300
0
$0
1
$101,990
Aggregated Statistics For Year 2006 (Based on 2 partial tracts)
B) Conventional Home Purchase Loans
C) Refinancings
D) Home Improvement Loans
F) Non-occupant Loans on < 5 Family Dwellings (A B C & D)
G) Loans On Manufactured Home Dwelling (A B C & D)
Number
Average Value
Number
Average Value
Number
Average Value
Number
Average Value
Number
Average Value
LOANS ORIGINATED
31
$216,630
45
$227,216
12
$119,159
21
$163,514
4
$145,238
APPLICATIONS APPROVED, NOT ACCEPTED
4
$164,410
9
$226,040
2
$127,420
2
$115,030
1
$155,690
APPLICATIONS DENIED
11
$249,656
24
$204,473
4
$123,872
5
$165,970
3
$129,187
APPLICATIONS WITHDRAWN
4
$186,098
18
$222,095
3
$106,550
4
$178,415
1
$64,550
FILES CLOSED FOR INCOMPLETENESS
2
$165,635
7
$213,310
1
$87,790
1
$101,470
1
$94,240
Aggregated Statistics For Year 2005 (Based on 2 partial tracts)
B) Conventional Home Purchase Loans
C) Refinancings
D) Home Improvement Loans
F) Non-occupant Loans on < 5 Family Dwellings (A B C & D)
G) Loans On Manufactured Home Dwelling (A B C & D)
Number
Average Value
Number
Average Value
Number
Average Value
Number
Average Value
Number
Average Value
LOANS ORIGINATED
33
$189,527
49
$201,549
8
$92,726
19
$151,509
3
$120,923
APPLICATIONS APPROVED, NOT ACCEPTED
6
$268,398
7
$187,527
2
$68,940
2
$197,650
1
$110,510
APPLICATIONS DENIED
6
$268,830
22
$197,840
6
$89,853
3
$143,990
2
$123,290
APPLICATIONS WITHDRAWN
6
$180,482
25
$182,857
4
$152,210
4
$134,005
3
$97,083
FILES CLOSED FOR INCOMPLETENESS
1
$163,180
3
$151,307
0
$0
0
$0
0
$0
Aggregated Statistics For Year 2004 (Based on 2 partial tracts)
A) FHA, FSA/RHS & VA Home Purchase Loans
B) Conventional Home Purchase Loans
C) Refinancings
D) Home Improvement Loans
F) Non-occupant Loans on < 5 Family Dwellings (A B C & D)
G) Loans On Manufactured Home Dwelling (A B C & D)
Number
Average Value
Number
Average Value
Number
Average Value
Number
Average Value
Number
Average Value
Number
Average Value
LOANS ORIGINATED
1
$96,570
37
$153,531
42
$153,205
6
$90,672
18
$112,403
4
$105,410
APPLICATIONS APPROVED, NOT ACCEPTED
0
$0
6
$146,873
12
$141,946
1
$66,360
4
$110,768
1
$41,310
APPLICATIONS DENIED
0
$0
11
$178,581
27
$126,088
7
$64,329
5
$137,982
2
$107,410
APPLICATIONS WITHDRAWN
0
$0
4
$177,255
23
$143,099
2
$46,090
2
$139,170
1
$135,300
FILES CLOSED FOR INCOMPLETENESS
0
$0
1
$146,920
5
$183,736
1
$87,010
0
$0
0
$0
Aggregated Statistics For Year 2003 (Based on 2 partial tracts)
A) FHA, FSA/RHS & VA Home Purchase Loans
B) Conventional Home Purchase Loans
C) Refinancings
D) Home Improvement Loans
F) Non-occupant Loans on < 5 Family Dwellings (A B C & D)
Number
Average Value
Number
Average Value
Number
Average Value
Number
Average Value
Number
Average Value
LOANS ORIGINATED
1
$38,210
30
$135,090
76
$136,652
3
$64,120
26
$89,238
APPLICATIONS APPROVED, NOT ACCEPTED
0
$0
3
$133,660
13
$116,269
0
$0
3
$102,677
APPLICATIONS DENIED
0
$0
7
$156,506
23
$147,590
2
$42,730
2
$129,745
APPLICATIONS WITHDRAWN
0
$0
5
$126,570
16
$153,871
0
$0
2
$51,255
FILES CLOSED FOR INCOMPLETENESS
0
$0
0
$0
2
$130,005
1
$23,240
0
$0
Aggregated Statistics For Year 2002 (Based on 2 partial tracts)
A) FHA, FSA/RHS & VA Home Purchase Loans
B) Conventional Home Purchase Loans
C) Refinancings
D) Home Improvement Loans
F) Non-occupant Loans on < 5 Family Dwellings (A B C & D)
Number
Average Value
Number
Average Value
Number
Average Value
Number
Average Value
Number
Average Value
LOANS ORIGINATED
2
$136,975
25
$126,053
42
$136,852
4
$43,508
15
$89,974
APPLICATIONS APPROVED, NOT ACCEPTED
0
$0
2
$95,665
7
$119,141
1
$40,280
1
$89,850
APPLICATIONS DENIED
1
$50,350
4
$99,472
17
$153,553
1
$45,700
2
$81,850
APPLICATIONS WITHDRAWN
0
$0
3
$148,207
13
$133,827
1
$32,270
1
$91,920
FILES CLOSED FOR INCOMPLETENESS
0
$0
2
$61,710
2
$134,395
0
$0
1
$40,800
Aggregated Statistics For Year 2001 (Based on 2 partial tracts)
A) FHA, FSA/RHS & VA Home Purchase Loans
B) Conventional Home Purchase Loans
C) Refinancings
D) Home Improvement Loans
F) Non-occupant Loans on < 5 Family Dwellings (A B C & D)
Number
Average Value
Number
Average Value
Number
Average Value
Number
Average Value
Number
Average Value
LOANS ORIGINATED
1
$72,550
16
$126,034
32
$117,901
3
$52,070
10
$84,509
APPLICATIONS APPROVED, NOT ACCEPTED
0
$0
3
$90,283
5
$99,820
1
$32,790
2
$76,945
APPLICATIONS DENIED
0
$0
1
$85,210
9
$97,112
2
$17,815
2
$62,355
APPLICATIONS WITHDRAWN
0
$0
2
$79,525
10
$133,489
0
$0
1
$15,230
FILES CLOSED FOR INCOMPLETENESS
0
$0
0
$0
2
$104,960
0
$0
1
$23,750
Aggregated Statistics For Year 2000 (Based on 2 partial tracts)
A) FHA, FSA/RHS & VA Home Purchase Loans
B) Conventional Home Purchase Loans
C) Refinancings
D) Home Improvement Loans
F) Non-occupant Loans on < 5 Family Dwellings (A B C & D)
Number
Average Value
Number
Average Value
Number
Average Value
Number
Average Value
Number
Average Value
LOANS ORIGINATED
2
$118,770
17
$111,922
14
$102,266
3
$24,357
6
$79,010
APPLICATIONS APPROVED, NOT ACCEPTED
0
$0
2
$90,110
2
$135,555
1
$17,040
1
$80,820
APPLICATIONS DENIED
0
$0
3
$89,337
11
$94,290
1
$59,900
1
$110,250
APPLICATIONS WITHDRAWN
0
$0
2
$93,470
6
$81,935
1
$38,730
1
$48,030
FILES CLOSED FOR INCOMPLETENESS
0
$0
0
$0
1
$51,380
0
$0
0
$0
Aggregated Statistics For Year 1999 (Based on 1 partial tract)
A) FHA, FSA/RHS & VA Home Purchase Loans
B) Conventional Home Purchase Loans
C) Refinancings
D) Home Improvement Loans
F) Non-occupant Loans on < 5 Family Dwellings (A B C & D)
Detailed PMIC statistics for the following Tracts:0027.00
2005 - 2018 National Fire Incident Reporting System (NFIRS) incidents
Based on the data from the years 2005 - 2018 the average number of fire incidents per year is 10. The highest number of fires - 23 took place in 2016, and the least - 3 in 2008. The data has a dropping trend.
When looking into fire subcategories, the most reports belonged to: Outside Fires (62.9%), and Structure Fires (22.1%).
Fire incident types reported to NFIRS in Zip Code 93238

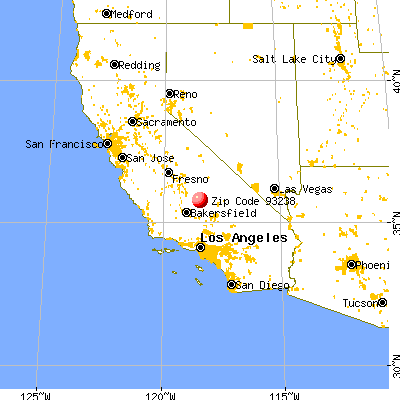


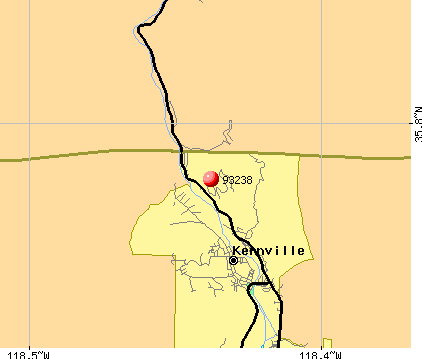 Nearest zip codes: 93285, 93240, 93283, 93205, 93207, 93260.


 Based on the data from the years 2005 - 2018 the average number of fire incidents per year is 10. The highest number of fires - 23 took place in 2016, and the least - 3 in 2008. The data has a dropping trend.
 When looking into fire subcategories, the most reports belonged to: Outside Fires (62.9%), and Structure Fires (22.1%).