Estimated median house/condo value in 2022: $181,988
93244:
$181,988
California:
$715,900
According to our research of California and other state lists, there was 1 registered sex offender living in 93244 zip code as of May 28, 2024. The ratio of all residents to sex offenders in zip code 93244 is 401 to 1.
Median resident age:
This zip code:
57.3 years
California median age:
37.9 years
Average household size:
This zip code:
1.9 people
California:
2.8 people
Averages for the 2020 tax year for zip code 93244, filed in 2021:
Average Adjusted Gross Income (AGI) in 2020: $71,230 (Individual Income Tax Returns)
Here:
$71,230
State:
$95,910
Salary/wage: $64,500 (reported on 70.0% of returns)
Here:
$64,500
State:
$77,331
(% of AGI for various income ranges: 877.5% for AGIs below $25k, 2280.0% for AGIs $25k-50k)
Taxable interest for individuals: $738 (reported on 40.0% of returns)
This zip code:
$738
California:
$2,294
(% of AGI for various income ranges: 10.0% for AGIs below $25k)
Ordinary dividends: $1,500 (reported on 15.0% of returns)
Here:
$1,500
State:
$10,949
(% of AGI for various income ranges: 90.0% for AGIs $25k-50k)
Net capital gain/loss in AGI: +$1,767 (reported on 15.0% of returns)
Here:
+$1,767
State:
+$49,306
(% of AGI for various income ranges: )
Profit/loss from business: +$2,900 (reported on 15.0% of returns)
Here:
+$2,900
State:
+$15,671
(% of AGI for various income ranges: 217.5% for AGIs below $25k)
Taxes paid: $7,850 (reported on 10.0% of returns)
93244:
$7,850
State:
$8,807
(% of AGI for various income ranges: 392.5% for AGIs below $25k)
Earned income credit: $1,300 (reported on 15.0% of returns)
Here:
$1,300
State:
$2,074
(% of AGI for various income ranges: 97.5% for AGIs below $25k)
Percentage of individuals using paid preparers for their 2020 taxes: 95.0%
Here:
95%
State:
92%
(% for various income ranges: 85.7% for AGIs below $25k, 100.0% for AGIs $25k-50k, 100.0% for AGIs $50k-75k, 100.0% for AGIs $75k-100k, 100.0% for AGIs $100k-200k)
Averages for the 2012 tax year for zip code 93244, filed in 2013:
Average Adjusted Gross Income (AGI) in 2012: $56,120 (Individual Income Tax Returns)
Here:
$56,120
State:
$72,726
Salary/wage: $43,829 (reported on 70.0% of returns)
Here:
$43,829
State:
$59,079
(% of AGI for various income ranges: 61.5% for AGIs below $25k, 66.6% for AGIs $25k-50k, 65.4% for AGIs $50k-75k, 68.9% for AGIs $75k-100k, 40.7% for AGIs $100k-200k)
Taxable interest for individuals: $544 (reported on 45.0% of returns)
This zip code:
$544
California:
$2,146
(% of AGI for various income ranges: 0.7% for AGIs below $25k, 0.3% for AGIs $50k-75k, 0.7% for AGIs $100k-200k)
Ordinary dividends: $2,200 (reported on 15.0% of returns)
Here:
$2,200
State:
$9,308
Net capital gain/loss in AGI: +$2,000 (reported on 20.0% of returns)
Here:
+$2,000
State:
+$30,460
Profit/loss from business: +$4,100 (reported on 15.0% of returns)
Here:
+$4,100
State:
+$17,064
Total itemized deductions: $23,943 (24% of AGI, reported on 35.0% of returns)
Here:
$23,943
State:
$34,004
Here:
24.3% of AGI
State:
22.7% of AGI
(% of AGI for various income ranges: 35.9% for AGIs below $25k, 34.8% for AGIs $50k-75k, 14.0% for AGIs $100k-200k)
Charity contributions: $2,640 (reported on 25.0% of returns)
Here:
$2,640
State:
$4,659
Taxes paid: $7,500 (reported on 35.0% of returns)
93244:
$7,500
State:
$14,448
(% of AGI for various income ranges: 7.3% for AGIs below $25k, 9.0% for AGIs $50k-75k, 5.8% for AGIs $100k-200k)
Earned income credit: $2,700 (reported on 15.0% of returns)
Here:
$2,700
State:
$2,286
(% of AGI for various income ranges: 8.8% for AGIs below $25k)
Percentage of individuals using paid preparers for their 2012 taxes: 60.0%
Here:
60%
State:
64%
(% for various income ranges: 50.0% for AGIs below $25k, 50.0% for AGIs $25k-50k, 133.3% for AGIs $50k-75k, 66.7% for AGIs $100k-200k)
Averages for the 2004 tax year for zip code 93244, filed in 2005:
Average Adjusted Gross Income (AGI) in 2004: $43,680 (Individual Income Tax Returns)
Here:
$43,680
State:
$58,600
Salary/wage: $38,658 (reported on 77.6% of returns)
Here:
$38,658
State:
$49,455
(% of AGI for various income ranges: 76.5% for AGIs $10k-25k, 77.4% for AGIs $25k-50k, 74.2% for AGIs $50k-75k, 74.7% for AGIs $75k-100k, 50.8% for AGIs over 100k)
Taxable interest for individuals: $825 (reported on 47.3% of returns)
This zip code:
$825
California:
$2,365
(% of AGI for various income ranges: 0.1% for AGIs $10k-25k, 0.5% for AGIs $25k-50k, 1.4% for AGIs $50k-75k, 0.8% for AGIs $75k-100k, 0.6% for AGIs over 100k)
Taxable dividends: $698 (reported on 22.0% of returns)
Here:
$698
State:
$4,746
(% of AGI for various income ranges: 1.5% for AGIs $10k-25k, 0.4% for AGIs $50k-75k, 0.3% for AGIs over 100k)
Net capital gain/loss: +$9,929 (reported on 17.4% of returns)
Here:
+$9,929
State:
+$23,418
(% of AGI for various income ranges: 10.7% for AGIs $50k-75k, 4.4% for AGIs over 100k)
Profit/loss from business: +$12,956 (reported on 18.7% of returns)
Here:
+$12,956
State:
+$16,826
Total itemized deductions: $20,025 (23% of AGI, reported on 33.6% of returns)
Here:
$20,025
State:
$28,113
Here:
23.1% of AGI
State:
25.3% of AGI
(% of AGI for various income ranges: 14.4% for AGIs $25k-50k, 16.0% for AGIs $50k-75k, 22.3% for AGIs $75k-100k, 16.6% for AGIs over 100k)
Charity contributions deductions: $2,847 (3% of AGI, reported on 29.9% of returns)
Here:
$2,847
State:
$3,923
Here:
3.4% of AGI
State:
3.3% of AGI
(% of AGI for various income ranges: 3.1% for AGIs $10k-25k, 2.2% for AGIs $50k-75k, 3.1% for AGIs $75k-100k, 1.9% for AGIs over 100k)
Total tax: $7,012 (reported on 71.4% of returns)
93244:
$7,012
State:
$10,761
(% of AGI for various income ranges: 3.3% for AGIs $10k-25k, 7.1% for AGIs $25k-50k, 9.0% for AGIs $50k-75k, 8.9% for AGIs $75k-100k, 18.1% for AGIs over 100k)
Earned income credit: $1,458 (reported on 19.9% of returns)
Here:
$1,458
State:
$1,763
Percentage of individuals using paid preparers for their 2004 taxes: 74.7%
Here:
75%
State:
66%
(% for various income ranges: 72.0% for AGIs below $10k, 62.7% for AGIs $10k-25k, 78.0% for AGIs $25k-50k, 84.2% for AGIs $50k-75k, 75.0% for AGIs $75k-100k, 87.5% for AGIs over 100k)
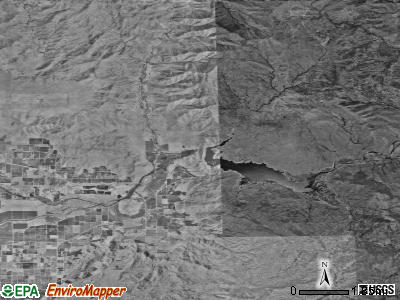
Notable locations in zip code 93244: Homer Ranch (A), Terminus (B), Pacific Coast Equestrian Research Farm (C), Tulare County Fire Department Battalion 1 Lemon Cove Fire Station 13 (D). Display/hide their locations on the map
Creeks: Fly Creek (A), Dry Creek (B), Cedar Creek (C), Murry Creek (D), Bear Creek (E), Elder Creek (F), Ridenhour Creek (G), Wagonshed Creek (H), Fridley Creek (I). Display/hide their locations on the map
Size of family households: 27 2-persons, 5 3-persons, 5 4-persons
Size of nonfamily households: 24 1-person
15 married couples with children.
0 single-parent households ().
80.0% of residents of 93244 zip code speak English at home.
3.3% of residents speak Spanish at home (25% very well, 75% not well).
14.2% of residents speak other Indo-European language at home (100% very well).
Foreign born population: 21 (17.6%) (90.6% of them are naturalized citizens)
This zip code:
17.6%
Whole state:
26.7%
80%Italy
15%Honduras
34%Portuguese
Year of entry for the foreign-born population
02010 or later
12000 to 2009
01990 to 1999
17Before 1990
Facilities with environmental interests located in this zip code:
CALMAT CO LEMON COVE (24325 LOMITAS DRIVE in LEMON COVE, CA)
AIR SYNTHETIC MINOR (AIRS/AFS) STATE MASTER (California - Hazardous Waste Tracking) - HAZARDOU WASTE PROGRAM CRITERIA AND HAZARDOUS AIR POLLUTANT INVENTORY (Inventory of air pollution sources) Small Quantity Generators, between 100 kg and 1000 kg of hazardous waste/month (Resource Conservation and Recovery Act (tracking hazardous waste)) - notification Business SIC classification: CONSTRUCTION SAND AND GRAVEL; ASPHALT PAVING MIXTURES AND BLOCKS Business NAICS classification: ASPHALT PAVING MIXTURE AND BLOCK MANUFACTURING. Alternative names: CALMAT CO LEMON GROVE INDUSTRIAL ASPHALT, CALMAT CO/LEMONCOVE, CALMAT- INDUSTRIAL ASPHALT, INDUSTRIAL ASPHALT, RMC LONESTAR, RMC PACIFIC MATERIALS
Housing units lacking complete plumbing facilities: 11.8% Housing units lacking complete kitchen facilities: 11.1%
37.8%Wood
32.8%Electricity
23.0%Other fuel
4.9%Bottled, tank, or LP gas
3.3%No fuel used
Population in 1990: 64. Population change in the 1990s: +210 (+328.1%).
Place of birth for U.S.-born residents:
This state: 73
Midwest: 4
West: 19
72% of the 93244 zip code residents lived in the same house 5 years ago. Out of people who lived in different houses, 52% lived in this county.
100% of the 93244 zip code residents lived in the same house 1 year ago.
Private vs. public school enrollment:
Students in private schools in grades 1 to 8 (elementary and middle school):
Here:
0.0%
California:
10.5%
Top industries in this zip code by the number of employees in 2005:
Arts, Entertainment, and Recreation: Marinas (10-19 employees: 1 establishment)
Mining: Construction Sand and Gravel Mining (10-19: 1)
Accommodation and Food Services: Bed-and-Breakfast Inns (1-4: 1)
Fatal accident statistics in 2011:
Fatal accident count: 1
Vehicles involved in fatal accidents: 2
Fatal accidents caused by drunken drivers: 0
Fatalities: 1
Persons involved in fatal accidents: 2
Pedestrians involved in fatal accidents: 0
Home Mortgage Disclosure Act Aggregated Statistics For Year 2009 (Based on 2 partial tracts)
A) FHA, FSA/RHS & VA Home Purchase Loans
B) Conventional Home Purchase Loans
C) Refinancings
D) Home Improvement Loans
F) Non-occupant Loans on < 5 Family Dwellings (A B C & D)
Number
Average Value
Number
Average Value
Number
Average Value
Number
Average Value
Number
Average Value
LOANS ORIGINATED
1
$106,290
3
$261,423
12
$211,262
1
$98,290
2
$273,995
APPLICATIONS APPROVED, NOT ACCEPTED
0
$0
0
$0
1
$191,860
0
$0
0
$0
APPLICATIONS DENIED
0
$0
1
$203,350
6
$253,577
1
$87,930
1
$365,770
APPLICATIONS WITHDRAWN
0
$0
1
$137,690
3
$263,683
0
$0
1
$143,020
FILES CLOSED FOR INCOMPLETENESS
0
$0
0
$0
1
$130,400
0
$0
0
$0
Aggregated Statistics For Year 2008 (Based on 2 partial tracts)
A) FHA, FSA/RHS & VA Home Purchase Loans
B) Conventional Home Purchase Loans
C) Refinancings
D) Home Improvement Loans
F) Non-occupant Loans on < 5 Family Dwellings (A B C & D)
Number
Average Value
Number
Average Value
Number
Average Value
Number
Average Value
Number
Average Value
LOANS ORIGINATED
1
$165,800
2
$291,485
7
$244,510
1
$137,070
1
$325,650
APPLICATIONS APPROVED, NOT ACCEPTED
0
$0
1
$210,540
2
$317,190
0
$0
0
$0
APPLICATIONS DENIED
0
$0
1
$208,180
7
$339,739
1
$177,600
1
$306,360
APPLICATIONS WITHDRAWN
0
$0
0
$0
3
$211,663
0
$0
0
$0
FILES CLOSED FOR INCOMPLETENESS
0
$0
0
$0
0
$0
0
$0
0
$0
Aggregated Statistics For Year 2007 (Based on 2 partial tracts)
B) Conventional Home Purchase Loans
C) Refinancings
D) Home Improvement Loans
F) Non-occupant Loans on < 5 Family Dwellings (A B C & D)
G) Loans On Manufactured Home Dwelling (A B C & D)
Number
Average Value
Number
Average Value
Number
Average Value
Number
Average Value
Number
Average Value
LOANS ORIGINATED
7
$274,059
12
$230,029
3
$169,940
3
$258,860
2
$133,330
APPLICATIONS APPROVED, NOT ACCEPTED
1
$333,550
4
$230,415
1
$146,100
1
$121,170
0
$0
APPLICATIONS DENIED
2
$289,180
9
$295,249
2
$176,880
2
$216,125
1
$146,510
APPLICATIONS WITHDRAWN
1
$380,440
4
$273,172
1
$85,360
1
$168,880
0
$0
FILES CLOSED FOR INCOMPLETENESS
0
$0
2
$266,505
0
$0
0
$0
0
$0
Aggregated Statistics For Year 2006 (Based on 2 partial tracts)
B) Conventional Home Purchase Loans
C) Refinancings
D) Home Improvement Loans
F) Non-occupant Loans on < 5 Family Dwellings (A B C & D)
G) Loans On Manufactured Home Dwelling (A B C & D)
Number
Average Value
Number
Average Value
Number
Average Value
Number
Average Value
Number
Average Value
LOANS ORIGINATED
11
$227,436
15
$241,849
3
$123,977
4
$253,472
1
$129,690
APPLICATIONS APPROVED, NOT ACCEPTED
2
$177,650
4
$201,070
1
$71,310
1
$148,050
0
$0
APPLICATIONS DENIED
4
$251,242
10
$229,814
2
$120,145
2
$195,195
1
$96,960
APPLICATIONS WITHDRAWN
2
$285,585
9
$262,668
0
$0
2
$178,060
1
$95,730
FILES CLOSED FOR INCOMPLETENESS
1
$187,350
1
$311,080
0
$0
0
$0
0
$0
Aggregated Statistics For Year 2005 (Based on 2 partial tracts)
B) Conventional Home Purchase Loans
C) Refinancings
D) Home Improvement Loans
F) Non-occupant Loans on < 5 Family Dwellings (A B C & D)
G) Loans On Manufactured Home Dwelling (A B C & D)
Number
Average Value
Number
Average Value
Number
Average Value
Number
Average Value
Number
Average Value
LOANS ORIGINATED
10
$248,220
22
$202,924
3
$111,767
4
$245,650
1
$188,270
APPLICATIONS APPROVED, NOT ACCEPTED
1
$209,610
3
$173,600
0
$0
1
$124,250
0
$0
APPLICATIONS DENIED
3
$191,383
7
$195,409
1
$232,590
1
$157,590
1
$140,360
APPLICATIONS WITHDRAWN
2
$243,420
7
$210,637
1
$126,810
1
$343,810
1
$168,670
FILES CLOSED FOR INCOMPLETENESS
0
$0
1
$215,970
0
$0
0
$0
0
$0
Aggregated Statistics For Year 2004 (Based on 2 partial tracts)
B) Conventional Home Purchase Loans
C) Refinancings
D) Home Improvement Loans
F) Non-occupant Loans on < 5 Family Dwellings (A B C & D)
G) Loans On Manufactured Home Dwelling (A B C & D)
Number
Average Value
Number
Average Value
Number
Average Value
Number
Average Value
Number
Average Value
LOANS ORIGINATED
12
$194,769
19
$161,876
2
$89,570
4
$178,112
1
$163,650
APPLICATIONS APPROVED, NOT ACCEPTED
2
$194,940
4
$156,490
0
$0
1
$189,600
1
$51,710
APPLICATIONS DENIED
3
$145,007
11
$176,444
1
$115,010
1
$313,650
1
$66,900
APPLICATIONS WITHDRAWN
3
$192,820
8
$181,910
1
$124,970
1
$203,660
0
$0
FILES CLOSED FOR INCOMPLETENESS
1
$170,320
1
$99,420
0
$0
1
$132,560
0
$0
Aggregated Statistics For Year 2003 (Based on 2 partial tracts)
A) FHA, FSA/RHS & VA Home Purchase Loans
B) Conventional Home Purchase Loans
C) Refinancings
D) Home Improvement Loans
F) Non-occupant Loans on < 5 Family Dwellings (A B C & D)
Number
Average Value
Number
Average Value
Number
Average Value
Number
Average Value
Number
Average Value
LOANS ORIGINATED
1
$97,570
13
$148,699
34
$153,520
1
$52,630
5
$162,580
APPLICATIONS APPROVED, NOT ACCEPTED
0
$0
1
$166,720
6
$161,322
0
$0
1
$119,940
APPLICATIONS DENIED
0
$0
2
$118,400
14
$171,203
0
$0
1
$207,150
APPLICATIONS WITHDRAWN
0
$0
1
$111,010
7
$156,583
0
$0
1
$77,360
FILES CLOSED FOR INCOMPLETENESS
0
$0
0
$0
3
$219,017
0
$0
0
$0
Aggregated Statistics For Year 2002 (Based on 2 partial tracts)
A) FHA, FSA/RHS & VA Home Purchase Loans
B) Conventional Home Purchase Loans
C) Refinancings
D) Home Improvement Loans
F) Non-occupant Loans on < 5 Family Dwellings (A B C & D)
Number
Average Value
Number
Average Value
Number
Average Value
Number
Average Value
Number
Average Value
LOANS ORIGINATED
1
$137,790
6
$170,145
21
$148,228
1
$13,950
3
$137,930
APPLICATIONS APPROVED, NOT ACCEPTED
0
$0
2
$127,070
3
$131,600
0
$0
0
$0
APPLICATIONS DENIED
0
$0
1
$61,560
5
$138,366
1
$25,240
0
$0
APPLICATIONS WITHDRAWN
0
$0
1
$137,380
4
$143,230
0
$0
0
$0
FILES CLOSED FOR INCOMPLETENESS
0
$0
0
$0
1
$162,310
0
$0
0
$0
Aggregated Statistics For Year 2001 (Based on 2 partial tracts)
A) FHA, FSA/RHS & VA Home Purchase Loans
B) Conventional Home Purchase Loans
C) Refinancings
F) Non-occupant Loans on < 5 Family Dwellings (A B C & D)
Number
Average Value
Number
Average Value
Number
Average Value
Number
Average Value
LOANS ORIGINATED
1
$76,330
8
$139,266
15
$141,622
3
$125,377
APPLICATIONS APPROVED, NOT ACCEPTED
0
$0
1
$159,750
2
$151,590
1
$77,980
APPLICATIONS DENIED
0
$0
1
$117,480
6
$141,845
1
$39,090
APPLICATIONS WITHDRAWN
0
$0
1
$109,780
3
$163,133
0
$0
FILES CLOSED FOR INCOMPLETENESS
0
$0
0
$0
1
$58,280
0
$0
Aggregated Statistics For Year 2000 (Based on 2 partial tracts)
A) FHA, FSA/RHS & VA Home Purchase Loans
B) Conventional Home Purchase Loans
C) Refinancings
D) Home Improvement Loans
F) Non-occupant Loans on < 5 Family Dwellings (A B C & D)
Number
Average Value
Number
Average Value
Number
Average Value
Number
Average Value
Number
Average Value
LOANS ORIGINATED
1
$102,290
5
$144,070
6
$115,100
1
$30,060
1
$120,350
APPLICATIONS APPROVED, NOT ACCEPTED
0
$0
1
$112,550
2
$123,840
1
$27,090
0
$0
APPLICATIONS DENIED
0
$0
3
$85,467
4
$116,990
0
$0
1
$79,000
APPLICATIONS WITHDRAWN
0
$0
1
$149,590
2
$124,555
0
$0
0
$0
FILES CLOSED FOR INCOMPLETENESS
0
$0
0
$0
0
$0
0
$0
0
$0
Aggregated Statistics For Year 1999 (Based on 1 partial tract)


 Nearest zip codes: 93286, 93603, 93221, 93271, 93647, 93292.