Estimated zip code population in 2022: 15,000 Zip code population in 2010: 13,522 Zip code population in 2000: 10,780
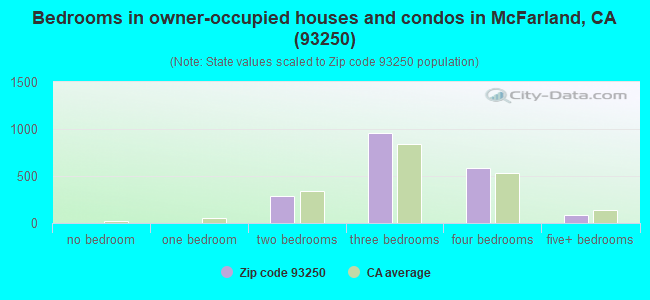
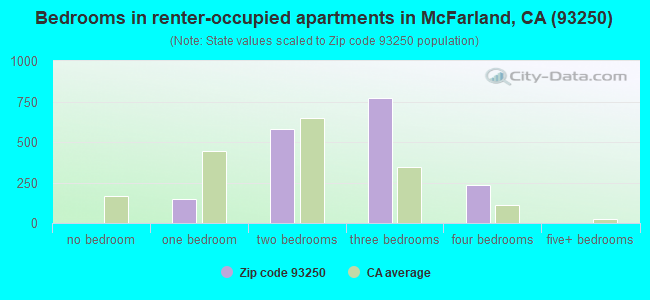
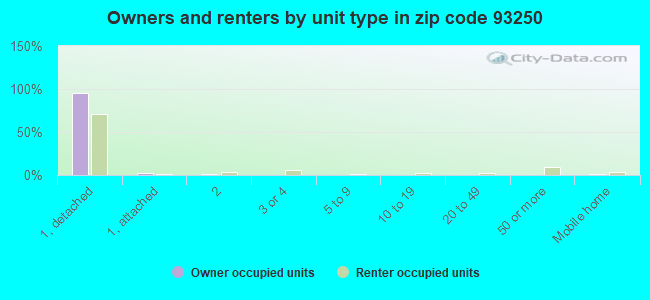
Houses and condos: 3,881 Renter-occupied apartments: 1,744
% of renters here:
48%
State:
44%
March 2022 cost of living index in zip code 93250: 92.7 (less than average, U.S. average is 100)
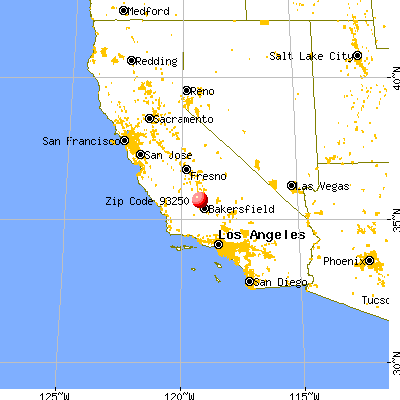
Land area: 84.6 sq. mi. Water area: 0.0 sq. mi.
Population density: 177 people per square mile
(very low).
OSM Map
General Map
Google Map
MSN Map
OSM Map
General Map
Google Map
MSN Map
OSM Map
General Map
Google Map
MSN Map
OSM Map
General Map
Google Map
MSN Map
Please wait while loading the map...
Real estate property taxes paid for housing units in 2022:
This zip code:
0.8% ($1,988)
California:
0.7% ($4,831)
Median real estate property taxes paid for housing units with mortgages in 2022: $2,428 (0.9%) Median real estate property taxes paid for housing units with no mortgage in 2022: $1,566 (0.7%)
Business Search- 14 Million verified businesses
Males: 7,679
(51.2%)
Females: 7,321
(48.8%)
For population 25 years and over in 93250:
High school or higher: 57.4%
Bachelor's degree or higher: 4.3%
Graduate or professional degree: 1.5%
Unemployed: 5.0%
Mean travel time to work (commute): 20.0 minutes
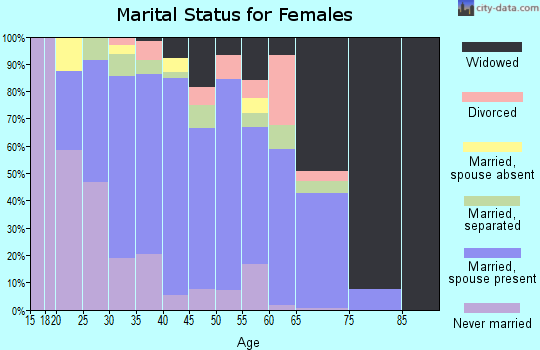
For population 15 years and over in 93250:
Never married: 45.2%
Now married: 43.7%
Separated: 2.2%
Widowed: 2.7%
Divorced: 6.2%
Zip code 93250 compared to state average:
Median household income below state average.
Median house value significantly below state average.
Black race population percentage significantly below state average.
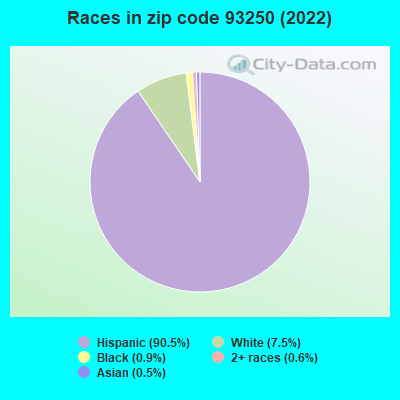
Hispanic race population percentage above state average.
Median age significantly below state average.
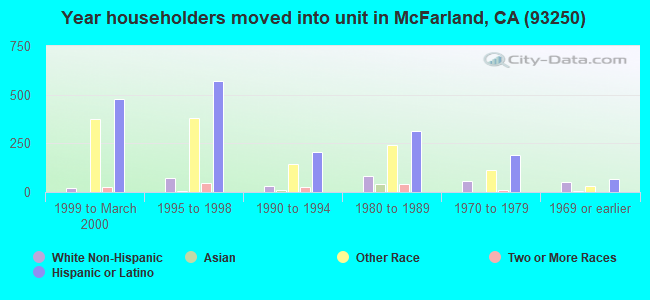
Length of stay since moving in significantly above state average.
House age below state average.
Percentage of population with a bachelor's degree or higher significantly below state average.
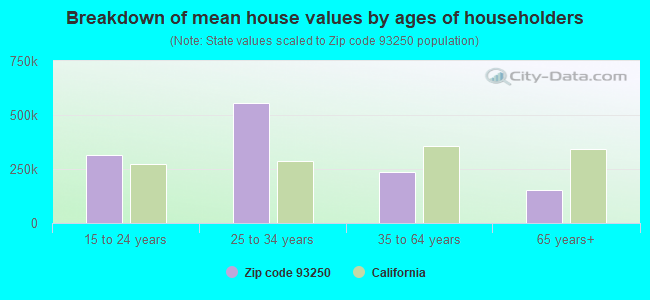
Estimated median house/condo value in 2022: $254,849
93250:
$254,849
California:
$715,900
According to our research of California and other state lists, there were 16 registered sex offenders living in 93250 zip code as of May 28, 2024. The ratio of all residents to sex offenders in zip code 93250 is 940 to 1. The ratio of registered sex offenders to all residents in this zip code is lower than the state average.
Median resident age:
This zip code:
26.7 years
California median age:
37.9 years
Average household size:
This zip code:
3.9 people
California:
2.8 people
Averages for the 2020 tax year for zip code 93250, filed in 2021:
Average Adjusted Gross Income (AGI) in 2020: $35,720 (Individual Income Tax Returns)
Here:
$35,720
State:
$95,910
Salary/wage: $29,373 (reported on 91.7% of returns)
Here:
$29,373
State:
$77,331
(% of AGI for various income ranges: 1712.0% for AGIs below $25k, 4123.5% for AGIs $25k-50k, 8175.7% for AGIs $50k-75k, 12609.4% for AGIs $75k-100k, 24434.4% for AGIs $100k-200k)
Taxable interest for individuals: $478 (reported on 14.3% of returns)
This zip code:
$478
California:
$2,294
(% of AGI for various income ranges: 0.7% for AGIs below $25k, 1.1% for AGIs $25k-50k, 7.0% for AGIs $50k-75k, 5.6% for AGIs $75k-100k, 392.2% for AGIs $100k-200k)
Ordinary dividends: $6,256 (reported on 1.5% of returns)
Here:
$6,256
State:
$10,949
(% of AGI for various income ranges: 0.3% for AGIs below $25k, 11.3% for AGIs $50k-75k, 562.2% for AGIs $100k-200k)
Net capital gain/loss in AGI: +$15,125 (reported on 2.0% of returns)
Here:
+$15,125
State:
+$49,306
(% of AGI for various income ranges: 12.4% for AGIs $50k-75k, 1985.6% for AGIs $100k-200k)
Profit/loss from business: +$6,845 (reported on 6.8% of returns)
Here:
+$6,845
State:
+$15,671
(% of AGI for various income ranges: 62.3% for AGIs below $25k, 77.2% for AGIs $25k-50k, 91.1% for AGIs $50k-75k, 106.1% for AGIs $75k-100k, 254.4% for AGIs $100k-200k)
Taxable individual retirement arrangement distribution: $10,640 (reported on 0.8% of returns)
93250:
$10,640
California:
$23,505
(% of AGI for various income ranges: 11.7% for AGIs below $25k, 193.9% for AGIs $75k-100k)
Total itemized deductions: $24,908 (reported on 2.0% of returns)
Here:
$24,908
State:
$39,517
(% of AGI for various income ranges: 46.1% for AGIs $25k-50k, 115.2% for AGIs $50k-75k, 352.8% for AGIs $75k-100k, 1325.6% for AGIs $100k-200k)
Charity contributions: $7,667 (reported on 1.5% of returns)
Here:
$7,667
State:
$12,598
(% of AGI for various income ranges: 11.6% for AGIs $25k-50k, 77.8% for AGIs $75k-100k, 434.4% for AGIs $100k-200k)
Taxes paid: $8,192 (reported on 2.0% of returns)
93250:
$8,192
State:
$8,807
(% of AGI for various income ranges: 13.3% for AGIs $25k-50k, 39.3% for AGIs $50k-75k, 127.8% for AGIs $75k-100k, 433.3% for AGIs $100k-200k)
Earned income credit: $2,537 (reported on 30.4% of returns)
Here:
$2,537
State:
$2,074
(% of AGI for various income ranges: 161.4% for AGIs below $25k, 159.9% for AGIs $25k-50k, 4.6% for AGIs $50k-75k)
Percentage of individuals using paid preparers for their 2020 taxes: 86.7%
Here:
87%
State:
92%
(% for various income ranges: 83.3% for AGIs below $25k, 88.1% for AGIs $25k-50k, 89.7% for AGIs $50k-75k, 93.5% for AGIs $75k-100k, 94.7% for AGIs $100k-200k, 100.0% for AGIs over 200k)
Averages for the 2012 tax year for zip code 93250, filed in 2013:
Average Adjusted Gross Income (AGI) in 2012: $28,783 (Individual Income Tax Returns)
Here:
$28,783
State:
$72,726
Salary/wage: $25,500 (reported on 96.4% of returns)
Here:
$25,500
State:
$59,079
(% of AGI for various income ranges: 83.8% for AGIs below $25k, 87.8% for AGIs $25k-50k, 89.7% for AGIs $50k-75k, 88.4% for AGIs $75k-100k, 69.4% for AGIs $100k-200k)
Taxable interest for individuals: $209 (reported on 12.1% of returns)
This zip code:
$209
California:
$2,146
(% of AGI for various income ranges: 0.1% for AGIs $75k-100k, 0.2% for AGIs $100k-200k)
Ordinary dividends: $2,417 (reported on 1.3% of returns)
Here:
$2,417
State:
$9,308
Net capital gain/loss in AGI: +$483 (reported on 1.3% of returns)
Here:
+$483
State:
+$30,460
Profit/loss from business: +$7,676 (reported on 7.8% of returns)
Here:
+$7,676
State:
+$17,064
(% of AGI for various income ranges: 3.9% for AGIs below $25k, 1.8% for AGIs $25k-50k, 0.9% for AGIs $50k-75k, 1.5% for AGIs $75k-100k)
Taxable individual retirement arrangement distribution: $7,125 (reported on 0.8% of returns)
93250:
$7,125
California:
$19,557
Total itemized deductions: $18,925 (31% of AGI, reported on 12.1% of returns)
Here:
$18,925
State:
$34,004
Here:
30.5% of AGI
State:
22.7% of AGI
(% of AGI for various income ranges: 2.5% for AGIs below $25k, 5.0% for AGIs $25k-50k, 12.8% for AGIs $50k-75k, 14.4% for AGIs $75k-100k, 22.3% for AGIs $100k-200k)
Charity contributions: $3,052 (reported on 9.3% of returns)
Here:
$3,052
State:
$4,659
(% of AGI for various income ranges: 0.2% for AGIs below $25k, 0.4% for AGIs $25k-50k, 1.6% for AGIs $50k-75k, 1.5% for AGIs $75k-100k, 4.5% for AGIs $100k-200k)
Taxes paid: $4,058 (reported on 12.1% of returns)
93250:
$4,058
State:
$14,448
(% of AGI for various income ranges: 0.3% for AGIs below $25k, 1.0% for AGIs $25k-50k, 2.6% for AGIs $50k-75k, 3.9% for AGIs $75k-100k, 5.2% for AGIs $100k-200k)
Earned income credit: $2,671 (reported on 40.6% of returns)
Here:
$2,671
State:
$2,286
(% of AGI for various income ranges: 9.6% for AGIs below $25k, 2.6% for AGIs $25k-50k)
Percentage of individuals using paid preparers for their 2012 taxes: 77.6%
Here:
78%
State:
64%
(% for various income ranges: 75.5% for AGIs below $25k, 79.3% for AGIs $25k-50k, 80.6% for AGIs $50k-75k, 86.7% for AGIs $75k-100k, 87.5% for AGIs $100k-200k)
Averages for the 2004 tax year for zip code 93250, filed in 2005:
Average Adjusted Gross Income (AGI) in 2004: $24,087 (Individual Income Tax Returns)
Here:
$24,087
State:
$58,600
Salary/wage: $21,218 (reported on 94.6% of returns)
Here:
$21,218
State:
$49,455
(% of AGI for various income ranges: 129.8% for AGIs below $10k, 85.9% for AGIs $10k-25k, 88.7% for AGIs $25k-50k, 85.3% for AGIs $50k-75k, 78.4% for AGIs $75k-100k, 34.1% for AGIs over 100k)
Taxable interest for individuals: $1,181 (reported on 16.6% of returns)
This zip code:
$1,181
California:
$2,365
(% of AGI for various income ranges: 2.3% for AGIs below $10k, 0.1% for AGIs $10k-25k, 0.3% for AGIs $25k-50k, 0.4% for AGIs $50k-75k, 1.0% for AGIs $75k-100k, 5.2% for AGIs over 100k)
Taxable dividends: $1,185 (reported on 2.4% of returns)
Here:
$1,185
State:
$4,746
(% of AGI for various income ranges: 0.3% for AGIs below $10k, 0.0% for AGIs $10k-25k, 0.0% for AGIs $25k-50k, 0.2% for AGIs $50k-75k, 0.7% for AGIs over 100k)
Net capital gain/loss: +$7,260 (reported on 2.3% of returns)
Here:
+$7,260
State:
+$23,418
(% of AGI for various income ranges: -0.9% for AGIs below $10k, 0.1% for AGIs $25k-50k, 0.2% for AGIs $50k-75k, 1.2% for AGIs $75k-100k, 6.7% for AGIs over 100k)
Profit/loss from business: +$11,356 (reported on 7.6% of returns)
Here:
+$11,356
State:
+$16,826
(% of AGI for various income ranges: 4.5% for AGIs below $10k, 2.4% for AGIs $10k-25k, 2.4% for AGIs $25k-50k, 4.2% for AGIs $50k-75k, 5.9% for AGIs $75k-100k, 9.3% for AGIs over 100k)
Profit/loss from farming: +$560 (reported on 0.8% of returns)
Here:
+$560
State:
-$7,562
IRA payment deduction: $3,263 (reported on 0.6% of returns)
93250:
$3,263
California:
$3,192
Total itemized deductions: $16,603 (30% of AGI, reported on 14.0% of returns)
Here:
$16,603
State:
$28,113
Here:
30.3% of AGI
State:
25.3% of AGI
(% of AGI for various income ranges: 4.3% for AGIs $10k-25k, 10.3% for AGIs $25k-50k, 14.3% for AGIs $50k-75k, 15.0% for AGIs $75k-100k, 17.9% for AGIs over 100k)
Charity contributions deductions: $2,810 (5% of AGI, reported on 12.5% of returns)
Here:
$2,810
State:
$3,923
Here:
5.0% of AGI
State:
3.3% of AGI
(% of AGI for various income ranges: 0.4% for AGIs $10k-25k, 1.0% for AGIs $25k-50k, 2.3% for AGIs $50k-75k, 2.2% for AGIs $75k-100k, 5.8% for AGIs over 100k)
Total tax: $2,875 (reported on 41.7% of returns)
93250:
$2,875
State:
$10,761
(% of AGI for various income ranges: 3.2% for AGIs below $10k, 1.7% for AGIs $10k-25k, 3.1% for AGIs $25k-50k, 6.0% for AGIs $50k-75k, 9.3% for AGIs $75k-100k, 20.1% for AGIs over 100k)
Earned income credit: $2,084 (reported on 48.9% of returns)
Here:
$2,084
State:
$1,763
Percentage of individuals using paid preparers for their 2004 taxes: 79.5%
Here:
79%
State:
66%
(% for various income ranges: 74.6% for AGIs below $10k, 81.4% for AGIs $10k-25k, 79.1% for AGIs $25k-50k, 82.0% for AGIs $50k-75k, 83.6% for AGIs $75k-100k, 86.5% for AGIs over 100k)
Household received Food Stamps/SNAP in the past 12 months: 1,122 Household did not receive Food Stamps/SNAP in the past 12 months: 2,680
Women who had a birth in the past 12 months: 230 (98 now married, 133 unmarried) Women who did not have a birth in the past 12 months: 3,610 (1,410 now married, 2,201 unmarried)
Housing units in zip code 93250 with a mortgage: 1,100 (16 second mortgage, 16 both second mortgage and home equity loan) Median monthly owner costs for units with a mortgage: $1,376 Median monthly owner costs for units without a mortgage: $447
Residents with income below the poverty level in 2022:
This zip code:
24.8%
Whole state:
12.2%
Residents with income below 50% of the poverty level in 2022:
This zip code:
16.2%
Whole state:
6.2%
Median number of rooms in houses and condos:
Here:
5.2
State:
6.0
Median number of rooms in apartments:
Here:
4.6
State:
3.9
Notable locations in this zip code not listed on our city pages
Notable locations in zip code 93250: Doyle Ranch (A), V B Ranch Dairy (B), Jer-Z-Boys Dairy Number 2 (C), Raymond-Souche Ranch (D), Kern County Fire Department Station 33 McFarland (E), McFarland City Hall (F), Jackson Branch Kern County Library (G). Display/hide their locations on the map
In group quarters: 718 (-1 institutionalized population)
Size of family households: 469 2-persons, 476 3-persons, 981 4-persons, 648 5-persons, 265 6-persons, 181 7-or-more-persons
Size of nonfamily households: 549 1-person, 35 2-persons
2,605 married couples with children.
1,758 single-parent households (376 men, 1,382 women).
25.8% of residents of 93250 zip code speak English at home.
74.3% of residents speak Spanish at home (37% very well, 33% well, 15% not well, 15% not at all).
0.3% of residents speak Asian or Pacific Island language at home (83% very well, 17% not well).
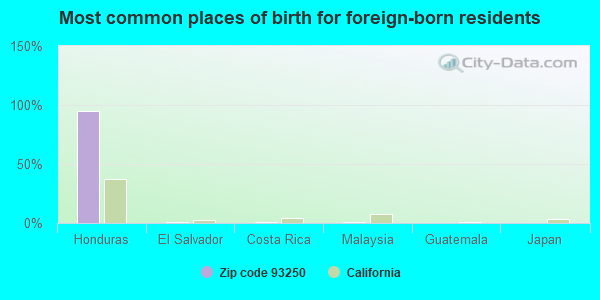
Foreign born population: 4,594 (30.6%) (23.6% of them are naturalized citizens)
This zip code:
30.6%
Whole state:
26.7%
95%Honduras
1%El Salvador
1%Costa Rica
1%Malaysia
0%Guatemala
0%Japan
0%Belize
6%American
1%English
0%Danish
0%Irish
0%Dutch
0%Italian
0%Scottish
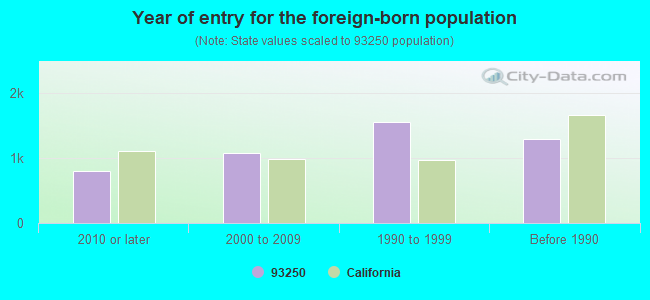
Year of entry for the foreign-born population
7912010 or later
1,0662000 to 2009
1,5501990 to 1999
1,293Before 1990
Facilities with environmental interests located in this zip code:
MCFARLAND HIGH SCHOOL (259 SHERWOOD in MC FARLAND, CA)
(National Center for Education Statistics) - STATE ID-1534155 Small Quantity Generators, between 100 kg and 1000 kg of hazardous waste/month (Resource Conservation and Recovery Act (tracking hazardous waste)) Organizations: MCFARLAND HS (CONTACT/OWNER)
, MCFARLAND UNIFIED (SCHOOL DISTRICT)
Alternative names: MCFARLAND HS
GREAT LAKES CHEMICAL CORPORATION (13074 ZACHARY AVE. in MC FARLAND, CA)
COMPLIANCE ACTIVITY (Tracking inspections of insecticide, fungicide, and rodenticide, and toxic substances) CRITERIA AND HAZARDOUS AIR POLLUTANT INVENTORY (Inventory of air pollution sources) Small Quantity Generators, between 100 kg and 1000 kg of hazardous waste/month (Resource Conservation and Recovery Act (tracking hazardous waste)) Large Quantity Generators, more that 1000 kg of hazardous waste/month (Resource Conservation and Recovery Act (tracking hazardous waste)) - notification TRI REPORTER (Tracking of toxic chemicals releasing facilities) Business SIC classification: INDUSTRIAL ORGANIC CHEMICALS; PESTICIDES AND AGRICULTURAL CHEMICALS; CHEMICALS AND ALLIED PRODUCTS Alternative names: INLAND SPECIALTY CHEMICAL, CORP.
KERN COUNTY RDS DEPT (209 E PERKINS AVE in MCFARLAND, CA) . Federal Facility
STATE MASTER (California - Hazardous Waste Tracking) - HAZARDOU WASTE PROGRAM Small Quantity Generators, between 100 kg and 1000 kg of hazardous waste/month (Resource Conservation and Recovery Act (tracking hazardous waste)) - notification Organizations: COUNTY OF KERN (CONTACT/OWNER)
Alternative names: KERN COUNTY MCFARLAND RD YD
KERN AVENUE ELEMENTARY (356 KERN AVE. in MCFARLAND, CA)
(National Center for Education Statistics) - STATE ID-6009765 Organizations: MCFARLAND UNIFIED (SCHOOL DISTRICT)
MCFARLAND INDEPENDENT (ALTER.) (599 FIFTH ST. in MCFARLAND, CA)
(National Center for Education Statistics) - STATE ID-1530229 Organizations: MCFARLAND UNIFIED (SCHOOL DISTRICT)
MCFARLAND MIDDLE (509 THIRD PLACE in MCFARLAND, CA)
(National Center for Education Statistics) - STATE ID-6106306 Organizations: MCFARLAND UNIFIED (SCHOOL DISTRICT)
KERN DELTA - WEEDPATCH (12490 GARZOLI AVENUE in MC FARLAND, CA)
AIR SYNTHETIC MINOR (AIRS/AFS) CRITERIA AND HAZARDOUS AIR POLLUTANT INVENTORY (Inventory of air pollution sources) Business SIC classification: COTTON GINNING; NONCLASSIFIABLE ESTABLISHMENTS Alternative names: MCFARLAND CO-OP GIN INC, MCFARLAND COOP DELINTING, MCFARLAND COOP GIN DELINTING, MCFARLAND DELINTING
CAPELLO INCORPORATED (31795 WHISLER ROAD in MC FARLAND, CA)
CRITERIA AND HAZARDOUS AIR POLLUTANT INVENTORY (Inventory of air pollution sources) TRI REPORTER (Tracking of toxic chemicals releasing facilities) Business SIC classification: WINES, BRANDY, AND BRANDY SPIRITS; FLAVORING EXTRACTS AND FLAVORING SYRUPS Alternative names: CANANDAIGUA WEST INC.
APTCO LLC (31381 POND ROAD in MCFARLAND, CA)
CRITERIA AND HAZARDOUS AIR POLLUTANT INVENTORY (Inventory of air pollution sources) Business SIC classification: PLASTICS FOAM PRODUCTS
K & K MART (31988 HWY 46 AT FAMOSO RD in MCFARLAND, CA)
CRITERIA AND HAZARDOUS AIR POLLUTANT INVENTORY (Inventory of air pollution sources) Business SIC classification: GASOLINE SERVICE STATIONS
MC FARLAND UNIFIED SD (601 2ND ST in MC FARLAND, CA)
COMPLIANCE ACTIVITY (Tracking inspections of insecticide, fungicide, and rodenticide, and toxic substances)
MCFARLAND STUDY AREA (CITY HALL in MCFARLAND, CA)
SUPERFUND (Superfund database)
Housing units lacking complete plumbing facilities: 1.7% Housing units lacking complete kitchen facilities: 1.5%
55.6%Utility gas
39.0%Electricity
2.8%No fuel used
1.1%Wood
0.8%Solar energy
0.8%Bottled, tank, or LP gas
Population in 1990: 8,494. Population change in the 1990s: +2,286 (+26.9%).
Place of birth for U.S.-born residents:
This state: 9,728
Northeast: 32
Midwest: 153
South: 243
West: 154
55% of the 93250 zip code residents lived in the same house 5 years ago. Out of people who lived in different houses, 71% lived in this county. Out of people who lived in different counties, 50% lived in California.
96% of the 93250 zip code residents lived in the same house 1 year ago. Out of people who lived in different houses, 33% moved from this county. Out of people who lived in different houses, 46% moved from different county within same state. Out of people who lived in different houses, 18% moved from different state. Out of people who lived in different houses, 15% moved from abroad.
Private vs. public school enrollment:
Students in private schools in grades 1 to 8 (elementary and middle school): 39
Here:
1.5%
California:
10.5%
Students in private schools in grades 9 to 12 (high school): 81
Here:
6.1%
California:
8.5%
Students in private undergraduate colleges: 183
Here:
29.8%
California:
15.9%
Occupation by median earnings in the past 12 months ($)
106,958Health diagnosing and treating practitioners and other technical occupations
74,276Business and financial operations occupations
63,380Management occupations
56,411Community and social service occupations
50,303Installation, maintenance, and repair occupations
44,090Education, training, and library occupations
Top industries in this zip code by the number of employees in 2005:
Administrative and Support and Waste Management and Remediation Services: Security Guards and Patrol Services (100-249 employees: 1 establishment, 20-49 employees: 1 establishment)
Administrative and Support and Waste Management and Remediation Services: Armored Car Services (100-249: 1)
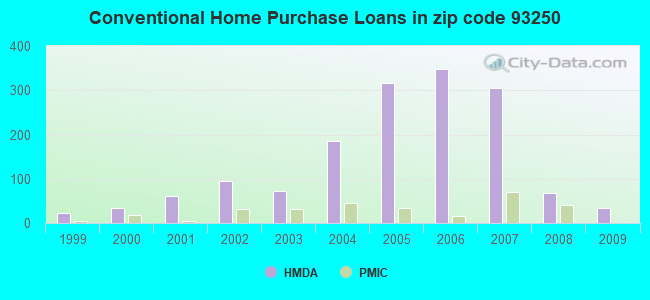
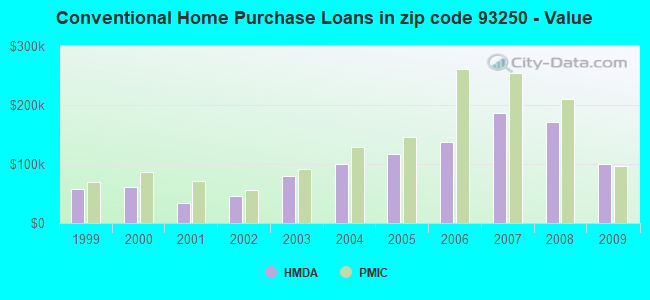
Detailed PMIC statistics for the following Tracts:0046.02
, 0047.00
2002 - 2018 National Fire Incident Reporting System (NFIRS) incidents
According to the data from the years 2002 - 2018 the average number of fire incidents per year is 52. The highest number of reported fire incidents - 105 took place in 2006, and the least - 0 in 2003. The data has an increasing trend.
When looking into fire subcategories, the most incidents belonged to: Outside Fires (47.6%), and Mobile Property/Vehicle Fires (37.4%).
Fire incident types reported to NFIRS in Zip Code 93250


+$560
-$7,562
 Nearest zip codes: 93215, 93261, 93263, 93219, 93287, 93280.
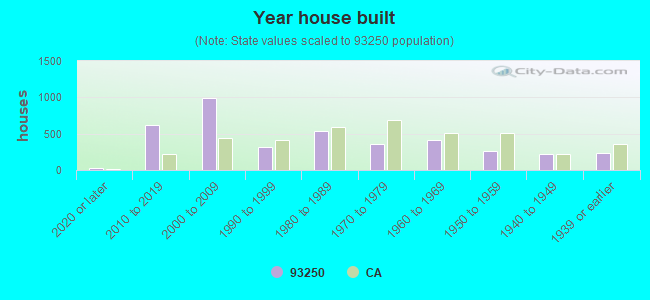


 According to the data from the years 2002 - 2018 the average number of fire incidents per year is 52. The highest number of reported fire incidents - 105 took place in 2006, and the least - 0 in 2003. The data has an increasing trend.
 When looking into fire subcategories, the most incidents belonged to: Outside Fires (47.6%), and Mobile Property/Vehicle Fires (37.4%).