Estimated zip code population in 2022: 861 Zip code population in 2010: 811 Zip code population in 2000: 793
Houses and condos: 421 Renter-occupied apartments: 82
% of renters here:
24%
State:
44%
March 2022 cost of living index in zip code 93254: 93.2 (less than average, U.S. average is 100)
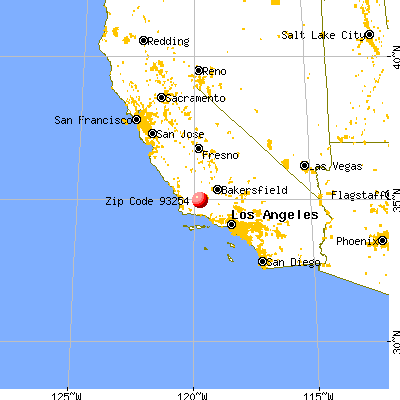
Land area: 136.6 sq. mi. Water area: 1.0 sq. mi.
Population density: 6 people per square mile
(very low).
OSM Map
General Map
Google Map
MSN Map
OSM Map
General Map
Google Map
MSN Map
OSM Map
General Map
Google Map
MSN Map
OSM Map
General Map
Google Map
MSN Map
Please wait while loading the map...
Real estate property taxes paid for housing units in 2022:
This zip code:
0.6% ($1,286)
California:
0.7% ($4,831)
Median real estate property taxes paid for housing units with mortgages in 2022: $1,522 (0.8%) Median real estate property taxes paid for housing units with no mortgage in 2022: $878 (0.4%)
Business Search- 14 Million verified businesses
Males: 442
(51.3%)
Females: 419
(48.7%)
For population 25 years and over in 93254:
High school or higher: 86.7%
Bachelor's degree or higher: 26.6%
Graduate or professional degree: 4.7%
Unemployed: 7.6%
Mean travel time to work (commute): 28.6 minutes
For population 15 years and over in 93254:
Never married: 30.0%
Now married: 49.6%
Separated: 4.2%
Widowed: 6.4%
Divorced: 9.8%
Zip code 93254 compared to state average:
Median household income below state average.
Median house value significantly below state average.
Black race population percentage significantly below state average.
Foreign-born population percentage below state average.
Renting percentage below state average.
Length of stay since moving in above state average.
Averages for the 2020 tax year for zip code 93254, filed in 2021:
Average Adjusted Gross Income (AGI) in 2020: $46,206 (Individual Income Tax Returns)
Here:
$46,206
State:
$95,910
Salary/wage: $40,785 (reported on 87.1% of returns)
Here:
$40,785
State:
$77,331
(% of AGI for various income ranges: 1600.0% for AGIs below $25k, 4128.3% for AGIs $25k-50k, 8580.0% for AGIs $50k-75k, 8850.0% for AGIs $75k-100k)
Taxable interest for individuals: $400 (reported on 19.4% of returns)
This zip code:
$400
California:
$2,294
(% of AGI for various income ranges: 8.3% for AGIs below $25k, 40.0% for AGIs $50k-75k, 35.0% for AGIs $75k-100k)
Net capital gain/loss in AGI: +$3,450 (reported on 6.5% of returns)
Here:
+$3,450
State:
+$49,306
(% of AGI for various income ranges: 115.0% for AGIs below $25k)
Profit/loss from business: +$6,050 (reported on 12.9% of returns)
Here:
+$6,050
State:
+$15,671
(% of AGI for various income ranges: 403.3% for AGIs $25k-50k)
Earned income credit: $2,320 (reported on 16.1% of returns)
Here:
$2,320
State:
$2,074
(% of AGI for various income ranges: 193.3% for AGIs below $25k)
Percentage of individuals using paid preparers for their 2020 taxes: 93.5%
Here:
94%
State:
92%
(% for various income ranges: 90.9% for AGIs below $25k, 100.0% for AGIs $25k-50k, 83.3% for AGIs $50k-75k, 100.0% for AGIs $75k-100k, 100.0% for AGIs $100k-200k)
Averages for the 2012 tax year for zip code 93254, filed in 2013:
Average Adjusted Gross Income (AGI) in 2012: $39,039 (Individual Income Tax Returns)
Here:
$39,039
State:
$72,726
Salary/wage: $37,836 (reported on 80.6% of returns)
Here:
$37,836
State:
$59,079
(% of AGI for various income ranges: 66.7% for AGIs below $25k, 89.0% for AGIs $25k-50k, 81.7% for AGIs $50k-75k, 203.0% for AGIs $75k-100k)
Taxable interest for individuals: $429 (reported on 22.6% of returns)
This zip code:
$429
California:
$2,146
Ordinary dividends: $3,233 (reported on 9.7% of returns)
Here:
$3,233
State:
$9,308
Net capital gain/loss in AGI: +$2,000 (reported on 6.5% of returns)
Here:
+$2,000
State:
+$30,460
Profit/loss from business: +$6,200 (reported on 12.9% of returns)
Here:
+$6,200
State:
+$17,064
Total itemized deductions: $19,017 (25% of AGI, reported on 19.4% of returns)
Here:
$19,017
State:
$34,004
Here:
24.9% of AGI
State:
22.7% of AGI
Charity contributions: $2,925 (reported on 12.9% of returns)
Here:
$2,925
State:
$4,659
Taxes paid: $5,733 (reported on 19.4% of returns)
93254:
$5,733
State:
$14,448
Earned income credit: $1,914 (reported on 22.6% of returns)
Here:
$1,914
State:
$2,286
(% of AGI for various income ranges: 4.8% for AGIs below $25k, 1.9% for AGIs $25k-50k)
Percentage of individuals using paid preparers for their 2012 taxes: 67.7%
Here:
68%
State:
64%
(% for various income ranges: 61.5% for AGIs below $25k, 77.8% for AGIs $25k-50k, 80.0% for AGIs $50k-75k, 100.0% for AGIs $100k-200k)
Averages for the 2004 tax year for zip code 93254, filed in 2005:
Average Adjusted Gross Income (AGI) in 2004: $33,232 (Individual Income Tax Returns)
Here:
$33,232
State:
$58,600
Salary/wage: $31,820 (reported on 86.1% of returns)
Here:
$31,820
State:
$49,455
(% of AGI for various income ranges: 210.3% for AGIs below $10k, 80.7% for AGIs $10k-25k, 82.9% for AGIs $25k-50k, 73.7% for AGIs $50k-75k, 85.3% for AGIs over 100k)
Taxable interest for individuals: $1,598 (reported on 29.7% of returns)
This zip code:
$1,598
California:
$2,365
(% of AGI for various income ranges: 1.4% for AGIs $10k-25k, 2.5% for AGIs $25k-50k, 1.1% for AGIs $50k-75k, 0.2% for AGIs over 100k)
Taxable dividends: $1,742 (reported on 10.0% of returns)
Here:
$1,742
State:
$4,746
Net capital gain/loss: +$629 (reported on 11.3% of returns)
Here:
+$629
State:
+$23,418
Profit/loss from business: +$5,404 (reported on 15.2% of returns)
Here:
+$5,404
State:
+$16,826
(% of AGI for various income ranges: 17.1% for AGIs below $10k, 8.4% for AGIs $10k-25k, 2.9% for AGIs $25k-50k, -1.1% for AGIs $50k-75k)
Total itemized deductions: $16,542 (25% of AGI, reported on 19.0% of returns)
Here:
$16,542
State:
$28,113
Here:
24.7% of AGI
State:
25.3% of AGI
(% of AGI for various income ranges: 7.8% for AGIs $10k-25k, 6.4% for AGIs $25k-50k, 15.0% for AGIs $50k-75k, 10.7% for AGIs over 100k)
Charity contributions deductions: $1,519 (2% of AGI, reported on 16.8% of returns)
Here:
$1,519
State:
$3,923
Here:
2.1% of AGI
State:
3.3% of AGI
Total tax: $4,613 (reported on 60.0% of returns)
93254:
$4,613
State:
$10,761
(% of AGI for various income ranges: 4.3% for AGIs below $10k, 3.4% for AGIs $10k-25k, 5.5% for AGIs $25k-50k, 9.3% for AGIs $50k-75k, 15.8% for AGIs over 100k)
Earned income credit: $1,931 (reported on 23.2% of returns)
Here:
$1,931
State:
$1,763
Percentage of individuals using paid preparers for their 2004 taxes: 71.0%
Here:
71%
State:
66%
(% for various income ranges: 63.2% for AGIs below $10k, 69.7% for AGIs $10k-25k, 71.8% for AGIs $25k-50k, 75.0% for AGIs $50k-75k, 93.3% for AGIs over 100k)
Household received Food Stamps/SNAP in the past 12 months: 45 Household did not receive Food Stamps/SNAP in the past 12 months: 290
Women who had a birth in the past 12 months: 20 (10 now married, 10 unmarried) Women who did not have a birth in the past 12 months: 94 (41 now married, 53 unmarried)
Housing units in zip code 93254 with a mortgage: 158 (5 second mortgage, 5 both second mortgage and home equity loan) Median monthly owner costs for units with a mortgage: $1,211 Median monthly owner costs for units without a mortgage: $451
Residents with income below the poverty level in 2022:
This zip code:
14.0%
Whole state:
12.2%
Residents with income below 50% of the poverty level in 2022:
This zip code:
10.0%
Whole state:
6.2%
Median number of rooms in houses and condos:
Here:
5.4
State:
6.0
Median number of rooms in apartments:
Here:
4.9
State:
3.9
Notable locations in this zip code not listed on our city pages
Notable locations in zip code 93254: Cuyama Ranch (A), Caliente Ranch (B), Branch Canyon Campground (C), Spanish Ranch (D), Hinsdale Ranch (E), Green Valley Ranch Number Two (F), New Cuyama Branch Santa Maria Public Library (G), Santa Barbara County Fire Department Station 41 (H). Display/hide their locations on the map
Streams, rivers, and creeks: Sycamore Creek (A), Branch Canyon Wash (B), Bitter Creek (C), Salisbury Canyon Wash (D). Display/hide their locations on the map
Size of family households: 87 2-persons, 22 3-persons, 45 4-persons, 30 5-persons, 16 6-persons
Size of nonfamily households: 89 1-person, 43 2-persons
131 married couples with children.
10 single-parent households (10 men).
63.7% of residents of 93254 zip code speak English at home.
35.4% of residents speak Spanish at home (42% very well, 21% well, 24% not well, 14% not at all).
1.0% of residents speak other Indo-European language at home (100% very well).
Foreign born population: 135 (15.7%) (45.3% of them are naturalized citizens)
This zip code:
15.7%
Whole state:
26.7%
91%Honduras
4%Nepal
2%France
4%American
3%Dutch
3%French
3%Irish
3%English
1%German
0%Polish
Year of entry for the foreign-born population
02010 or later
462000 to 2009
271990 to 1999
56Before 1990
Facilities with environmental interests located in this zip code:
FOUR COR PIPELINE CO CUYAMA (1/2 MI W OF in CUYAMA, CA)
Large Quantity Generators, more that 1000 kg of hazardous waste/month (Resource Conservation and Recovery Act (tracking hazardous waste))
CALTRANS DISTRICT 05 (ROUTE 1 in NEW CUYAMA, CA)
Small Quantity Generators, between 100 kg and 1000 kg of hazardous waste/month (Resource Conservation and Recovery Act (tracking hazardous waste)) Organizations: CA DEPT OF TRANS (CONTACT/OWNER)
GENERAL PRODUCTION SERVICES INC (HIGHWAY 33 VENTUCOPA AREA in CUYAMA, CA)
ENFORCEMENT/COMPLIANCE ACTIVITY (Integrated Compliance Information System) CRITERIA AND HAZARDOUS AIR POLLUTANT INVENTORY (Inventory of air pollution sources) Business SIC classification: MINERALS AND EARTHS, GROUND OR OTHERWISE TREATED
GAS PLANT 10 (SOUTH CUYAMA UNIT in CUYAMA, CA)
CRITERIA AND HAZARDOUS AIR POLLUTANT INVENTORY (Inventory of air pollution sources) Business SIC classification: NATURAL GAS LIQUIDS
HALLADOR IC ENGINES (PLACEHOLDER in CUYAMA, CA)
CRITERIA AND HAZARDOUS AIR POLLUTANT INVENTORY (Inventory of air pollution sources) Business SIC classification: CRUDE PETROLEUM AND NATURAL GAS
J.P. OIL CO., INC. (6 MI N. OF CUYAMA, HWY 166 in CUYAMA, CA)
CRITERIA AND HAZARDOUS AIR POLLUTANT INVENTORY (Inventory of air pollution sources) Business SIC classification: CRUDE PETROLEUM AND NATURAL GAS Alternative names: MAGNESS PETROLEUM
NEW CUYAMA SANITARY LANDFILL (1/4 MI SW NEW CUYAMA in NEW CUYAMA, CA)
CRITERIA AND HAZARDOUS AIR POLLUTANT INVENTORY (Inventory of air pollution sources) Business SIC classification: REFUSE SYSTEMS Business NAICS classification: SOLID WASTE LANDFILL.
Housing units lacking complete plumbing facilities: 1.4% Housing units lacking complete kitchen facilities: 2.7%
62.0%Utility gas
19.3%Electricity
11.6%Bottled, tank, or LP gas
6.7%Wood
0.9%Other fuel
Population in 1990: 80. Population change in the 1990s: +713 (+891.2%).
Place of birth for U.S.-born residents:
This state: 549
Northeast: 32
Midwest: 59
South: 14
West: 67
43% of the 93254 zip code residents lived in the same house 5 years ago. Out of people who lived in different houses, 43% lived in this county. Out of people who lived in different counties, 50% lived in California.
86% of the 93254 zip code residents lived in the same house 1 year ago. Out of people who lived in different houses, 65% moved from this county. Out of people who lived in different houses, 29% moved from different county within same state.
Private vs. public school enrollment:
Students in private schools in grades 1 to 8 (elementary and middle school): 12
Here:
16.2%
California:
10.5%
Students in private schools in grades 9 to 12 (high school):
Here:
0.0%
California:
8.5%
Students in private undergraduate colleges:
Here:
0.0%
California:
15.9%
Occupation by median earnings in the past 12 months ($)
70,480Production occupations
69,284Management occupations
44,915Construction and extraction occupations
36,494Building and grounds cleaning and maintenance occupations
35,042Farming, fishing, and forestry occupations
Top industries in this zip code by the number of employees in 2005:
Professional, Scientific, and Technical Services: All Other Professional, Scientific, and Technical Services (50-99 employees: 1 establishment)
Mining: All Other Nonmetallic Mineral Mining (20-49: 1)
Accommodation and Food Services: Full-Service Restaurants (10-19: 1)
Educational Services: Elementary and Secondary Schools (5-9: 1)
Administrative and Support and Waste Management and Remediation Services: Office Administrative Services (5-9: 1)
Other Services (except Public Administration): Religious Organizations (1-4: 1)
People in group quarters in 2000:
13 people in agriculture workers' dormitories on farms
Fatal accident statistics in 2014:
Fatal accident count: 1
Vehicles involved in fatal accidents: 2
Fatal accidents caused by drunken drivers: 0
Fatalities: 1
Persons involved in fatal accidents: 3
Pedestrians involved in fatal accidents: 0
Fatal accident statistics in 2012:
Fatal accident count: 2
Vehicles involved in fatal accidents: 4
Fatal accidents caused by drunken drivers: 1
Fatalities: 2
Persons involved in fatal accidents: 4
Pedestrians involved in fatal accidents: 0
Home Mortgage Disclosure Act Aggregated Statistics For Year 2009 (Based on 4 partial tracts)
A) FHA, FSA/RHS & VA Home Purchase Loans
B) Conventional Home Purchase Loans
C) Refinancings
D) Home Improvement Loans
F) Non-occupant Loans on < 5 Family Dwellings (A B C & D)
G) Loans On Manufactured Home Dwelling (A B C & D)
Number
Average Value
Number
Average Value
Number
Average Value
Number
Average Value
Number
Average Value
Number
Average Value
LOANS ORIGINATED
6
$267,463
10
$308,630
55
$287,919
3
$238,610
5
$268,960
1
$216,750
APPLICATIONS APPROVED, NOT ACCEPTED
0
$0
1
$534,940
4
$318,318
1
$86,270
1
$226,440
0
$0
APPLICATIONS DENIED
1
$99,800
2
$385,615
25
$322,695
2
$75,815
2
$200,420
3
$228,220
APPLICATIONS WITHDRAWN
1
$309,990
1
$213,280
15
$355,213
1
$218,060
1
$163,000
1
$452,180
FILES CLOSED FOR INCOMPLETENESS
0
$0
0
$0
4
$230,622
0
$0
0
$0
0
$0
Aggregated Statistics For Year 2008 (Based on 4 partial tracts)
A) FHA, FSA/RHS & VA Home Purchase Loans
B) Conventional Home Purchase Loans
C) Refinancings
D) Home Improvement Loans
F) Non-occupant Loans on < 5 Family Dwellings (A B C & D)
G) Loans On Manufactured Home Dwelling (A B C & D)
Number
Average Value
Number
Average Value
Number
Average Value
Number
Average Value
Number
Average Value
Number
Average Value
LOANS ORIGINATED
2
$445,840
8
$355,239
30
$296,018
4
$146,270
2
$239,725
2
$297,115
APPLICATIONS APPROVED, NOT ACCEPTED
0
$0
2
$305,760
5
$279,092
0
$0
0
$0
1
$89,590
APPLICATIONS DENIED
1
$187,560
4
$411,328
35
$298,694
4
$131,745
4
$245,162
5
$155,768
APPLICATIONS WITHDRAWN
0
$0
4
$400,555
11
$254,643
2
$342,465
3
$533,493
1
$304,890
FILES CLOSED FOR INCOMPLETENESS
0
$0
1
$472,700
3
$316,263
0
$0
0
$0
0
$0
Aggregated Statistics For Year 2007 (Based on 4 partial tracts)
A) FHA, FSA/RHS & VA Home Purchase Loans
B) Conventional Home Purchase Loans
C) Refinancings
D) Home Improvement Loans
F) Non-occupant Loans on < 5 Family Dwellings (A B C & D)
G) Loans On Manufactured Home Dwelling (A B C & D)
Number
Average Value
Number
Average Value
Number
Average Value
Number
Average Value
Number
Average Value
Number
Average Value
LOANS ORIGINATED
2
$191,835
22
$339,956
47
$314,109
9
$177,817
5
$314,916
6
$252,102
APPLICATIONS APPROVED, NOT ACCEPTED
0
$0
4
$462,925
12
$388,163
1
$87,410
1
$113,830
2
$142,830
APPLICATIONS DENIED
0
$0
5
$318,896
31
$328,969
6
$188,712
3
$430,417
4
$214,292
APPLICATIONS WITHDRAWN
0
$0
3
$471,577
10
$489,563
1
$256,340
1
$2,134,260
1
$145,660
FILES CLOSED FOR INCOMPLETENESS
0
$0
1
$501,700
5
$251,020
0
$0
1
$138,140
1
$174,390
Aggregated Statistics For Year 2006 (Based on 4 partial tracts)
A) FHA, FSA/RHS & VA Home Purchase Loans
B) Conventional Home Purchase Loans
C) Refinancings
D) Home Improvement Loans
F) Non-occupant Loans on < 5 Family Dwellings (A B C & D)
G) Loans On Manufactured Home Dwelling (A B C & D)
Number
Average Value
Number
Average Value
Number
Average Value
Number
Average Value
Number
Average Value
Number
Average Value
LOANS ORIGINATED
1
$172,820
21
$388,529
69
$277,582
12
$222,254
11
$391,496
5
$182,760
APPLICATIONS APPROVED, NOT ACCEPTED
0
$0
7
$334,037
13
$296,505
1
$57,690
1
$551,120
1
$232,640
APPLICATIONS DENIED
0
$0
10
$261,563
35
$289,928
7
$122,119
3
$345,100
6
$195,457
APPLICATIONS WITHDRAWN
0
$0
7
$314,736
28
$232,727
4
$87,962
1
$488,700
2
$269,780
FILES CLOSED FOR INCOMPLETENESS
0
$0
2
$176,550
7
$254,480
0
$0
1
$593,320
0
$0
Aggregated Statistics For Year 2005 (Based on 4 partial tracts)
B) Conventional Home Purchase Loans
C) Refinancings
D) Home Improvement Loans
F) Non-occupant Loans on < 5 Family Dwellings (A B C & D)
G) Loans On Manufactured Home Dwelling (A B C & D)
Number
Average Value
Number
Average Value
Number
Average Value
Number
Average Value
Number
Average Value
LOANS ORIGINATED
42
$327,028
67
$286,457
12
$230,003
17
$295,219
4
$225,855
APPLICATIONS APPROVED, NOT ACCEPTED
5
$360,950
10
$300,892
1
$143,290
3
$378,540
1
$152,010
APPLICATIONS DENIED
11
$278,731
30
$272,994
6
$189,952
5
$473,786
3
$234,380
APPLICATIONS WITHDRAWN
6
$382,063
26
$285,815
3
$188,813
3
$565,470
2
$187,995
FILES CLOSED FOR INCOMPLETENESS
2
$277,495
10
$241,673
1
$91,320
1
$315,300
1
$165,310
Aggregated Statistics For Year 2004 (Based on 4 partial tracts)
A) FHA, FSA/RHS & VA Home Purchase Loans
B) Conventional Home Purchase Loans
C) Refinancings
D) Home Improvement Loans
F) Non-occupant Loans on < 5 Family Dwellings (A B C & D)
G) Loans On Manufactured Home Dwelling (A B C & D)
Number
Average Value
Number
Average Value
Number
Average Value
Number
Average Value
Number
Average Value
Number
Average Value
LOANS ORIGINATED
3
$135,100
35
$301,201
79
$241,197
10
$137,806
16
$217,096
6
$187,020
APPLICATIONS APPROVED, NOT ACCEPTED
0
$0
5
$259,222
11
$229,698
1
$117,040
2
$171,060
1
$191,320
APPLICATIONS DENIED
1
$43,930
8
$241,399
33
$260,930
4
$111,215
4
$180,228
5
$149,990
APPLICATIONS WITHDRAWN
0
$0
7
$213,049
30
$221,876
1
$173,980
4
$115,258
3
$124,077
FILES CLOSED FOR INCOMPLETENESS
0
$0
1
$217,950
5
$214,494
0
$0
1
$250,680
0
$0
Aggregated Statistics For Year 2003 (Based on 4 partial tracts)
A) FHA, FSA/RHS & VA Home Purchase Loans
B) Conventional Home Purchase Loans
C) Refinancings
D) Home Improvement Loans
F) Non-occupant Loans on < 5 Family Dwellings (A B C & D)
Number
Average Value
Number
Average Value
Number
Average Value
Number
Average Value
Number
Average Value
LOANS ORIGINATED
2
$111,930
23
$287,173
183
$218,799
5
$90,528
15
$253,623
APPLICATIONS APPROVED, NOT ACCEPTED
0
$0
5
$264,480
23
$210,049
1
$70,230
3
$143,623
APPLICATIONS DENIED
0
$0
8
$239,146
34
$217,936
3
$65,507
5
$254,712
APPLICATIONS WITHDRAWN
0
$0
6
$241,147
28
$219,714
1
$55,780
3
$201,843
FILES CLOSED FOR INCOMPLETENESS
0
$0
2
$194,420
5
$211,548
0
$0
1
$160,680
Aggregated Statistics For Year 2002 (Based on 4 partial tracts)
A) FHA, FSA/RHS & VA Home Purchase Loans
B) Conventional Home Purchase Loans
C) Refinancings
D) Home Improvement Loans
F) Non-occupant Loans on < 5 Family Dwellings (A B C & D)
Number
Average Value
Number
Average Value
Number
Average Value
Number
Average Value
Number
Average Value
LOANS ORIGINATED
3
$160,717
29
$195,378
110
$221,240
3
$76,007
9
$239,992
APPLICATIONS APPROVED, NOT ACCEPTED
1
$83,530
3
$250,367
11
$180,604
1
$11,560
2
$72,535
APPLICATIONS DENIED
0
$0
6
$270,488
23
$178,950
3
$28,513
2
$114,760
APPLICATIONS WITHDRAWN
0
$0
4
$188,232
16
$209,452
1
$18,210
1
$103,160
FILES CLOSED FOR INCOMPLETENESS
0
$0
0
$0
4
$189,380
0
$0
0
$0
Aggregated Statistics For Year 2001 (Based on 4 partial tracts)
A) FHA, FSA/RHS & VA Home Purchase Loans
B) Conventional Home Purchase Loans
C) Refinancings
D) Home Improvement Loans
F) Non-occupant Loans on < 5 Family Dwellings (A B C & D)
Number
Average Value
Number
Average Value
Number
Average Value
Number
Average Value
Number
Average Value
LOANS ORIGINATED
3
$64,150
25
$205,424
88
$181,190
2
$55,265
9
$146,908
APPLICATIONS APPROVED, NOT ACCEPTED
0
$0
5
$148,422
12
$182,804
1
$26,010
1
$326,100
APPLICATIONS DENIED
0
$0
9
$164,248
18
$177,875
5
$22,010
2
$97,680
APPLICATIONS WITHDRAWN
0
$0
5
$218,922
19
$168,280
1
$29,480
2
$203,170
FILES CLOSED FOR INCOMPLETENESS
0
$0
1
$106,060
4
$149,430
0
$0
0
$0
Aggregated Statistics For Year 2000 (Based on 4 partial tracts)
A) FHA, FSA/RHS & VA Home Purchase Loans
B) Conventional Home Purchase Loans
C) Refinancings
D) Home Improvement Loans
F) Non-occupant Loans on < 5 Family Dwellings (A B C & D)
Number
Average Value
Number
Average Value
Number
Average Value
Number
Average Value
Number
Average Value
LOANS ORIGINATED
4
$77,582
25
$164,846
18
$184,155
4
$36,962
6
$227,923
APPLICATIONS APPROVED, NOT ACCEPTED
0
$0
3
$270,930
3
$120,783
1
$49,710
0
$0
APPLICATIONS DENIED
0
$0
9
$128,304
9
$125,382
2
$26,960
1
$210,970
APPLICATIONS WITHDRAWN
0
$0
3
$162,223
9
$111,054
1
$60,740
2
$113,665
FILES CLOSED FOR INCOMPLETENESS
0
$0
1
$206,630
2
$166,300
0
$0
1
$163,290
Aggregated Statistics For Year 1999 (Based on 2 partial tracts)
A) FHA, FSA/RHS & VA Home Purchase Loans
B) Conventional Home Purchase Loans
C) Refinancings
D) Home Improvement Loans
F) Non-occupant Loans on < 5 Family Dwellings (A B C & D)


 Nearest zip codes: 93441, 93224, 93460, 93251, 93268, 93105.


