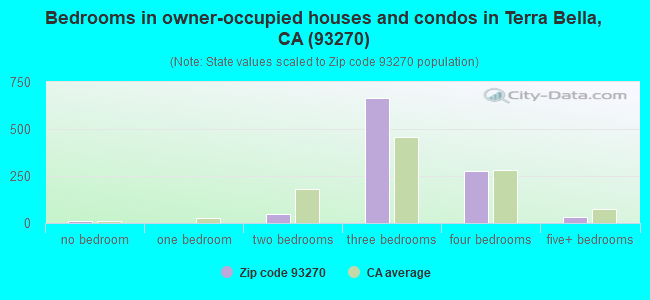
Estimated zip code population in 2022: 5,663 Zip code population in 2010: 5,837 Zip code population in 2000: 5,864
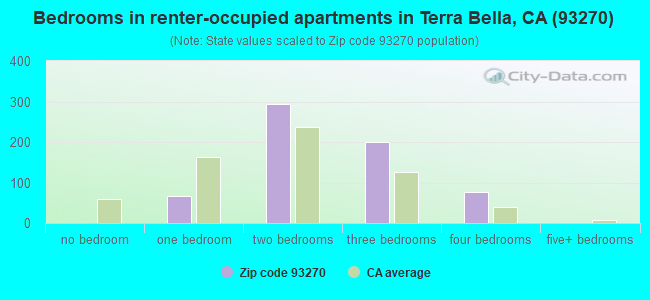
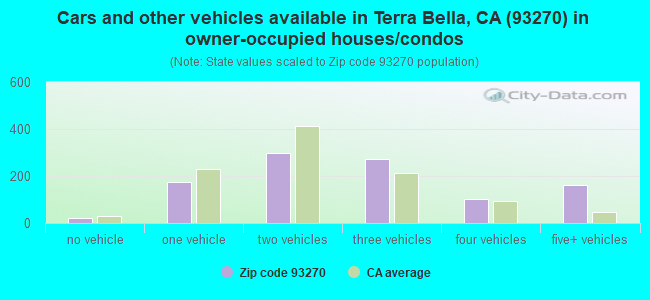
Houses and condos: 1,744 Renter-occupied apartments: 640
% of renters here:
38%
State:
44%
March 2022 cost of living index in zip code 93270: 87.9 (less than average, U.S. average is 100)
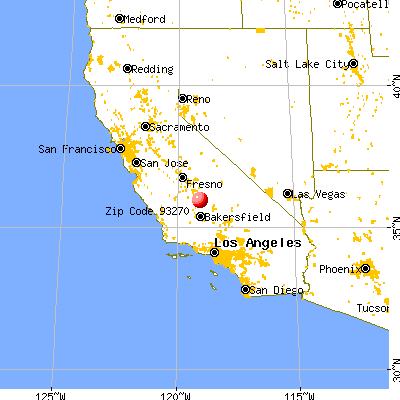
Land area: 61.8 sq. mi. Water area: 0.0 sq. mi.
Population density: 92 people per square mile
(very low).
OSM Map
General Map
Google Map
MSN Map
OSM Map
General Map
Google Map
MSN Map
OSM Map
General Map
Google Map
MSN Map
OSM Map
General Map
Google Map
MSN Map
Please wait while loading the map...
Real estate property taxes paid for housing units in 2022:
This zip code:
0.6% ($1,530)
California:
0.7% ($4,831)
Median real estate property taxes paid for housing units with mortgages in 2022: $1,520 (0.6%) Median real estate property taxes paid for housing units with no mortgage in 2022: $1,754 (0.5%)
Averages for the 2020 tax year for zip code 93270, filed in 2021:
Average Adjusted Gross Income (AGI) in 2020: $39,060 (Individual Income Tax Returns)
Here:
$39,060
State:
$95,910
Salary/wage: $30,464 (reported on 88.1% of returns)
Here:
$30,464
State:
$77,331
(% of AGI for various income ranges: 2029.0% for AGIs below $25k, 4593.3% for AGIs $25k-50k, 9623.6% for AGIs $50k-75k, 12438.8% for AGIs $75k-100k, 24425.0% for AGIs $100k-200k)
Taxable interest for individuals: $685 (reported on 17.2% of returns)
This zip code:
$685
California:
$2,294
(% of AGI for various income ranges: 4.1% for AGIs below $25k, 3.8% for AGIs $25k-50k, 16.4% for AGIs $50k-75k, 26.2% for AGIs $75k-100k, 381.7% for AGIs $100k-200k)
Ordinary dividends: $3,717 (reported on 4.5% of returns)
Here:
$3,717
State:
$10,949
(% of AGI for various income ranges: 11.5% for AGIs $25k-50k, 30.0% for AGIs $50k-75k, 21.2% for AGIs $75k-100k, 553.3% for AGIs $100k-200k)
Net capital gain/loss in AGI: +$8,046 (reported on 4.9% of returns)
Here:
+$8,046
State:
+$49,306
(% of AGI for various income ranges: 8.1% for AGIs $25k-50k, 100.0% for AGIs $50k-75k, 1445.0% for AGIs $100k-200k)
Profit/loss from business: +$12,855 (reported on 8.2% of returns)
Here:
+$12,855
State:
+$15,671
(% of AGI for various income ranges: 80.7% for AGIs below $25k, 182.5% for AGIs $25k-50k, 695.0% for AGIs $50k-75k, 851.7% for AGIs $100k-200k)
Taxable individual retirement arrangement distribution: $9,600 (reported on 1.9% of returns)
93270:
$9,600
California:
$23,505
(% of AGI for various income ranges: 32.9% for AGIs below $25k, 361.2% for AGIs $75k-100k)
Total itemized deductions: $25,578 (reported on 3.4% of returns)
Here:
$25,578
State:
$39,517
(% of AGI for various income ranges: 1060.0% for AGIs $50k-75k, 1363.3% for AGIs $100k-200k)
Charity contributions: $6,100 (reported on 3.0% of returns)
Here:
$6,100
State:
$12,598
(% of AGI for various income ranges: 200.0% for AGIs $50k-75k, 346.7% for AGIs $100k-200k)
Taxes paid: $7,233 (reported on 3.4% of returns)
93270:
$7,233
State:
$8,807
(% of AGI for various income ranges: 262.9% for AGIs $50k-75k, 471.7% for AGIs $100k-200k)
Earned income credit: $2,665 (reported on 31.3% of returns)
Here:
$2,665
State:
$2,074
(% of AGI for various income ranges: 230.0% for AGIs below $25k, 188.5% for AGIs $25k-50k)
Percentage of individuals using paid preparers for their 2020 taxes: 86.2%
Here:
86%
State:
92%
(% for various income ranges: 83.9% for AGIs below $25k, 85.2% for AGIs $25k-50k, 90.6% for AGIs $50k-75k, 93.3% for AGIs $75k-100k, 107.7% for AGIs $100k-200k, 0.0% for AGIs over 200k)
Averages for the 2012 tax year for zip code 93270, filed in 2013:
Average Adjusted Gross Income (AGI) in 2012: $36,162 (Individual Income Tax Returns)
Here:
$36,162
State:
$72,726
Salary/wage: $25,899 (reported on 90.7% of returns)
Here:
$25,899
State:
$59,079
(% of AGI for various income ranges: 79.6% for AGIs below $25k, 78.4% for AGIs $25k-50k, 74.9% for AGIs $50k-75k, 71.2% for AGIs $75k-100k, 37.0% for AGIs $100k-200k)
Taxable interest for individuals: $700 (reported on 15.9% of returns)
This zip code:
$700
California:
$2,146
(% of AGI for various income ranges: 0.2% for AGIs below $25k, 0.4% for AGIs $25k-50k, 0.5% for AGIs $75k-100k, 0.4% for AGIs $100k-200k)
Ordinary dividends: $2,187 (reported on 6.1% of returns)
Here:
$2,187
State:
$9,308
(% of AGI for various income ranges: 0.2% for AGIs below $25k, 0.1% for AGIs $25k-50k, 0.8% for AGIs $50k-75k, 0.6% for AGIs $100k-200k)
Net capital gain/loss in AGI: +$14,200 (reported on 5.3% of returns)
Here:
+$14,200
State:
+$30,460
(% of AGI for various income ranges: 6.8% for AGIs $100k-200k)
Profit/loss from business: +$10,393 (reported on 11.0% of returns)
Here:
+$10,393
State:
+$17,064
(% of AGI for various income ranges: 4.9% for AGIs below $25k, 2.7% for AGIs $25k-50k, 1.0% for AGIs $50k-75k, 5.4% for AGIs $75k-100k, 2.6% for AGIs $100k-200k)
Taxable individual retirement arrangement distribution: $11,129 (reported on 2.8% of returns)
93270:
$11,129
California:
$19,557
Total itemized deductions: $22,434 (21% of AGI, reported on 15.4% of returns)
Here:
$22,434
State:
$34,004
Here:
21.4% of AGI
State:
22.7% of AGI
(% of AGI for various income ranges: 2.9% for AGIs below $25k, 7.2% for AGIs $25k-50k, 12.8% for AGIs $50k-75k, 16.6% for AGIs $75k-100k, 12.9% for AGIs $100k-200k)
Charity contributions: $2,767 (reported on 12.2% of returns)
Here:
$2,767
State:
$4,659
(% of AGI for various income ranges: 0.3% for AGIs below $25k, 0.7% for AGIs $25k-50k, 1.1% for AGIs $50k-75k, 2.4% for AGIs $75k-100k, 1.1% for AGIs $100k-200k)
Taxes paid: $7,416 (reported on 15.0% of returns)
93270:
$7,416
State:
$14,448
(% of AGI for various income ranges: 0.3% for AGIs below $25k, 1.5% for AGIs $25k-50k, 2.9% for AGIs $50k-75k, 4.3% for AGIs $75k-100k, 6.1% for AGIs $100k-200k)
Earned income credit: $2,852 (reported on 43.5% of returns)
Here:
$2,852
State:
$2,286
(% of AGI for various income ranges: 11.9% for AGIs below $25k, 3.4% for AGIs $25k-50k)
Percentage of individuals using paid preparers for their 2012 taxes: 69.1%
Here:
69%
State:
64%
(% for various income ranges: 63.1% for AGIs below $25k, 78.5% for AGIs $25k-50k, 80.0% for AGIs $50k-75k, 66.7% for AGIs $75k-100k, 72.7% for AGIs $100k-200k)
Averages for the 2004 tax year for zip code 93270, filed in 2005:
Average Adjusted Gross Income (AGI) in 2004: $26,212 (Individual Income Tax Returns)
Here:
$26,212
State:
$58,600
Salary/wage: $22,451 (reported on 90.2% of returns)
Here:
$22,451
State:
$49,455
(% of AGI for various income ranges: 138.9% for AGIs below $10k, 79.7% for AGIs $10k-25k, 80.0% for AGIs $25k-50k, 79.6% for AGIs $50k-75k, 78.6% for AGIs $75k-100k, 48.8% for AGIs over 100k)
Taxable interest for individuals: $788 (reported on 24.2% of returns)
This zip code:
$788
California:
$2,365
(% of AGI for various income ranges: 3.1% for AGIs below $10k, 0.4% for AGIs $10k-25k, 0.4% for AGIs $25k-50k, 1.2% for AGIs $50k-75k, 1.0% for AGIs $75k-100k, 0.9% for AGIs over 100k)
Taxable dividends: $1,349 (reported on 9.3% of returns)
Here:
$1,349
State:
$4,746
(% of AGI for various income ranges: 2.7% for AGIs below $10k, 0.3% for AGIs $10k-25k, 0.2% for AGIs $25k-50k, 0.7% for AGIs $50k-75k, 0.4% for AGIs $75k-100k, 0.7% for AGIs over 100k)
Net capital gain/loss: +$15,474 (reported on 7.8% of returns)
Here:
+$15,474
State:
+$23,418
(% of AGI for various income ranges: 0.6% for AGIs below $10k, 0.3% for AGIs $10k-25k, 0.6% for AGIs $25k-50k, 5.7% for AGIs $50k-75k, 7.0% for AGIs $75k-100k, 18.9% for AGIs over 100k)
Profit/loss from business: +$7,369 (reported on 8.9% of returns)
Here:
+$7,369
State:
+$16,826
(% of AGI for various income ranges: 2.9% for AGIs below $10k, 3.0% for AGIs $10k-25k, 4.1% for AGIs $25k-50k, 1.1% for AGIs $50k-75k, 2.6% for AGIs $75k-100k)
Total itemized deductions: $17,568 (27% of AGI, reported on 14.6% of returns)
Here:
$17,568
State:
$28,113
Here:
26.8% of AGI
State:
25.3% of AGI
(% of AGI for various income ranges: 5.2% for AGIs below $10k, 3.7% for AGIs $10k-25k, 7.1% for AGIs $25k-50k, 14.3% for AGIs $50k-75k, 16.4% for AGIs $75k-100k, 17.8% for AGIs over 100k)
Charity contributions deductions: $2,517 (4% of AGI, reported on 12.9% of returns)
Here:
$2,517
State:
$3,923
Here:
3.9% of AGI
State:
3.3% of AGI
(% of AGI for various income ranges: 0.5% for AGIs $10k-25k, 0.7% for AGIs $25k-50k, 1.7% for AGIs $50k-75k, 1.9% for AGIs $75k-100k, 2.9% for AGIs over 100k)
Total tax: $3,735 (reported on 44.4% of returns)
93270:
$3,735
State:
$10,761
(% of AGI for various income ranges: 3.2% for AGIs below $10k, 1.7% for AGIs $10k-25k, 4.1% for AGIs $25k-50k, 7.7% for AGIs $50k-75k, 9.6% for AGIs $75k-100k, 16.5% for AGIs over 100k)
Earned income credit: $2,262 (reported on 47.5% of returns)
Here:
$2,262
State:
$1,763
Percentage of individuals using paid preparers for their 2004 taxes: 74.4%
Here:
74%
State:
66%
(% for various income ranges: 72.0% for AGIs below $10k, 75.5% for AGIs $10k-25k, 74.2% for AGIs $25k-50k, 71.2% for AGIs $50k-75k, 80.0% for AGIs $75k-100k, 81.0% for AGIs over 100k)
Household received Food Stamps/SNAP in the past 12 months: 476 Household did not receive Food Stamps/SNAP in the past 12 months: 1,252
Women who had a birth in the past 12 months: 10 (10 now married, 0 unmarried) Women who did not have a birth in the past 12 months: 1,370 (497 now married, 874 unmarried)
Housing units in zip code 93270 with a mortgage: 742 (5 second mortgage, 5 both second mortgage and home equity loan) Median monthly owner costs for units with a mortgage: $1,711 Median monthly owner costs for units without a mortgage: $572
Residents with income below the poverty level in 2022:
This zip code:
20.8%
Whole state:
12.2%
Residents with income below 50% of the poverty level in 2022:
This zip code:
12.4%
Whole state:
6.2%
Median number of rooms in houses and condos:
Here:
5.5
State:
6.0
Median number of rooms in apartments:
Here:
4.2
State:
3.9
Notable locations in this zip code not listed on our city pages
Notable locations in zip code 93270: Terra Bella Branch Tulare County Library (A), Good Shepherd Lutheran Home for the Retarded (B), Tulare County Fire Department Battalion 2 Terra Bella Fire Station 21 (C). Display/hide their locations on the map
Churches in zip code 93270 include: First Assembly of God Church (A), Jesucristo el Rey de Gloria (B), Pentecostal Church of God (C), Zion Lutheran Church (D). Display/hide their locations on the map
In group quarters: 31 (-1 institutionalized population)
Size of family households: 526 2-persons, 182 3-persons, 270 4-persons, 219 5-persons, 101 6-persons, 76 7-or-more-persons
Size of nonfamily households: 264 1-person, 13 2-persons, 9 7-or-more-persons
568 married couples with children.
514 single-parent households (173 men, 341 women).
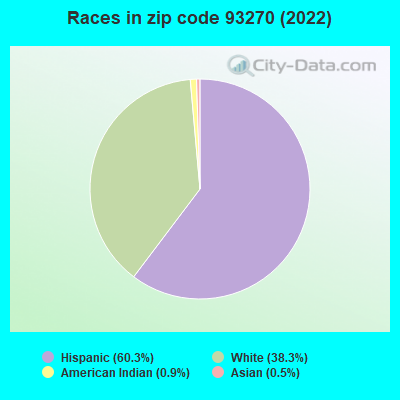
48.4% of residents of 93270 zip code speak English at home.
51.8% of residents speak Spanish at home (49% very well, 14% well, 15% not well, 23% not at all).
0.2% of residents speak other Indo-European language at home (100% not well).
0.2% of residents speak other language at home (100% very well).
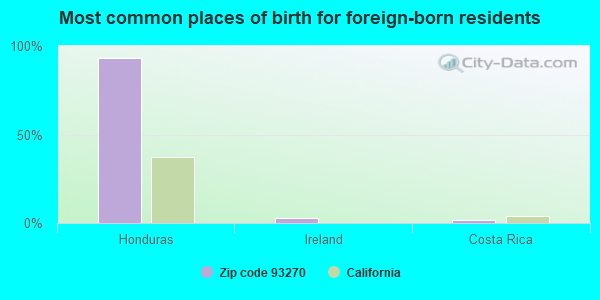
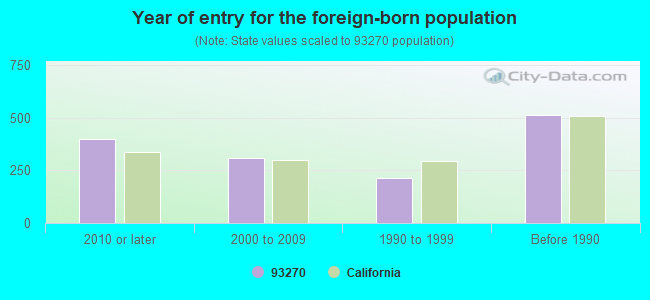
Foreign born population: 1,395 (24.6%) (29.8% of them are naturalized citizens)
This zip code:
24.6%
Whole state:
26.7%
93%Honduras
3%Ireland
2%Costa Rica
0%United Arab Emirates
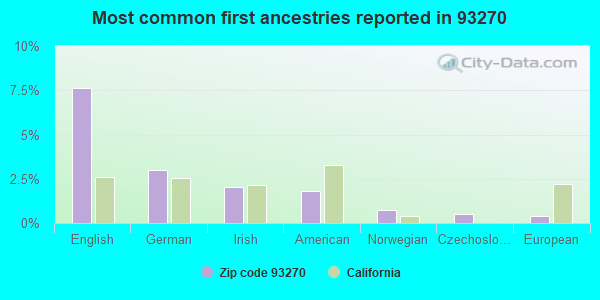
8%English
3%German
2%Irish
2%American
1%Norwegian
1%Czechoslovakian
0%European
Year of entry for the foreign-born population
3992010 or later
3112000 to 2009
2151990 to 1999
514Before 1990
Facilities with environmental interests located in this zip code:
LEFFINGWELL AG SALES (23576 AVE 96 in TERRA BELLA, CA)
COMPLIANCE ACTIVITY (Tracking inspections of insecticide, fungicide, and rodenticide, and toxic substances)
CANNELLA CHEMICAL FERTILIZER (PO 11028 in TERRA BELLA, CA)
COMPLIANCE ACTIVITY (Tracking inspections of insecticide, fungicide, and rodenticide, and toxic substances)
Housing units lacking complete kitchen facilities: 0.1%
39.1%Utility gas
25.7%Electricity
20.3%Bottled, tank, or LP gas
6.3%Wood
6.2%No fuel used
2.4%Other fuel
Population in 1990: 5,066. Population change in the 1990s: +798 (+15.8%).
Place of birth for U.S.-born residents:
This state: 4,044
Midwest: 33
South: 151
West: 27
62% of the 93270 zip code residents lived in the same house 5 years ago. Out of people who lived in different houses, 77% lived in this county. Out of people who lived in different counties, 50% lived in California.
89% of the 93270 zip code residents lived in the same house 1 year ago. Out of people who lived in different houses, 79% moved from this county. Out of people who lived in different houses, 6% moved from different county within same state. Out of people who lived in different houses, 12% moved from abroad.
Private vs. public school enrollment:
Students in private schools in grades 1 to 8 (elementary and middle school): 93
Here:
11.1%
California:
10.5%
Students in private schools in grades 9 to 12 (high school): 72
Here:
14.7%
California:
8.5%
Students in private undergraduate colleges: 16
Here:
18.6%
California:
15.9%
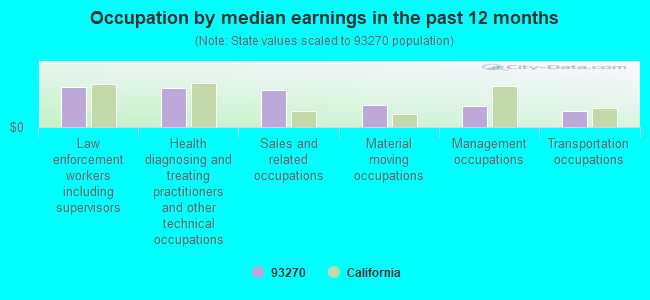
Occupation by median earnings in the past 12 months ($)
105,040Law enforcement workers including supervisors
103,433Health diagnosing and treating practitioners and other technical occupations
98,335Sales and related occupations
59,064Material moving occupations
54,350Management occupations
42,217Transportation occupations
Top industries in this zip code by the number of employees in 2005:
Arts, Entertainment, and Recreation: Agents and Managers for Artists, Athletes, Entertainers, and Other Public Figures (50-99 employees: 1 establishment)
Construction: Drywall and Insulation Contractors (10-19: 2)
Health Care and Social Assistance: Residential Mental Health and Substance Abuse Facilities (10-19: 1, 1-4: 1)
Health Care and Social Assistance: Home Health Care Services (10-19: 1)
People in group quarters in 2010:
14 people in group homes intended for adults
6 people in residential treatment centers for adults
People in group quarters in 2000:
7 people in other noninstitutional group quarters
6 people in other group homes
6 people in agriculture workers' dormitories on farms
Fatal accident statistics in 2014:
Fatal accident count: 1
Vehicles involved in fatal accidents: 1
Fatal accidents caused by drunken drivers: 0
Fatalities: 2
Persons involved in fatal accidents: 2
Pedestrians involved in fatal accidents: 0
Fatal accident statistics in 2013:
Fatal accident count: 1
Vehicles involved in fatal accidents: 2
Fatal accidents caused by drunken drivers: 0
Fatalities: 1
Persons involved in fatal accidents: 5
Pedestrians involved in fatal accidents: 0
Home Mortgage Disclosure Act Aggregated Statistics For Year 2009 (Based on 4 partial tracts)
A) FHA, FSA/RHS & VA Home Purchase Loans
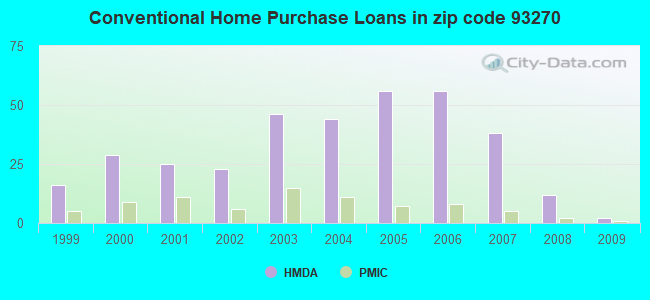
B) Conventional Home Purchase Loans
C) Refinancings
D) Home Improvement Loans
F) Non-occupant Loans on < 5 Family Dwellings (A B C & D)
G) Loans On Manufactured Home Dwelling (A B C & D)
Number
Average Value
Number
Average Value
Number
Average Value
Number
Average Value
Number
Average Value
Number
Average Value
LOANS ORIGINATED
8
$125,868
2
$180,285
19
$162,000
4
$70,585
1
$117,150
1
$188,730
APPLICATIONS APPROVED, NOT ACCEPTED
1
$173,930
1
$315,340
2
$198,880
2
$102,845
1
$186,030
1
$173,930
APPLICATIONS DENIED
3
$124,273
2
$164,850
24
$157,154
4
$16,425
2
$94,635
5
$120,816
APPLICATIONS WITHDRAWN
2
$123,260
2
$205,115
11
$143,673
3
$136,100
2
$178,085
3
$155,510
FILES CLOSED FOR INCOMPLETENESS
0
$0
0
$0
3
$106,487
0
$0
0
$0
0
$0
Aggregated Statistics For Year 2008 (Based on 4 partial tracts)
A) FHA, FSA/RHS & VA Home Purchase Loans
B) Conventional Home Purchase Loans
C) Refinancings
D) Home Improvement Loans
F) Non-occupant Loans on < 5 Family Dwellings (A B C & D)
G) Loans On Manufactured Home Dwelling (A B C & D)
Number
Average Value
Number
Average Value
Number
Average Value
Number
Average Value
Number
Average Value
Number
Average Value
LOANS ORIGINATED
5
$211,606
12
$174,107
26
$163,479
13
$91,528
5
$110,616
6
$146,080
APPLICATIONS APPROVED, NOT ACCEPTED
2
$231,915
5
$203,180
7
$138,654
2
$36,590
3
$157,107
4
$207,735
APPLICATIONS DENIED
1
$167,110
15
$151,103
49
$162,835
16
$76,181
9
$116,596
7
$110,229
APPLICATIONS WITHDRAWN
2
$140,070
1
$86,200
18
$177,721
5
$93,540
3
$130,823
2
$69,570
FILES CLOSED FOR INCOMPLETENESS
0
$0
1
$114,230
3
$189,420
0
$0
0
$0
0
$0
Aggregated Statistics For Year 2007 (Based on 4 partial tracts)
A) FHA, FSA/RHS & VA Home Purchase Loans
B) Conventional Home Purchase Loans
C) Refinancings
D) Home Improvement Loans
E) Loans on Dwellings For 5+ Families
F) Non-occupant Loans on < 5 Family Dwellings (A B C & D)
G) Loans On Manufactured Home Dwelling (A B C & D)
Number
Average Value
Number
Average Value
Number
Average Value
Number
Average Value
Number
Average Value
Number
Average Value
Number
Average Value
LOANS ORIGINATED
2
$158,465
38
$177,767
89
$167,863
23
$110,160
1
$294,810
20
$160,469
8
$157,859
APPLICATIONS APPROVED, NOT ACCEPTED
1
$131,580
10
$178,964
28
$186,206
5
$127,502
0
$0
1
$110,430
4
$176,648
APPLICATIONS DENIED
0
$0
31
$169,105
122
$165,009
28
$108,444
1
$264,670
16
$137,236
17
$145,531
APPLICATIONS WITHDRAWN
1
$122,500
9
$160,696
44
$178,720
9
$125,136
0
$0
4
$128,275
3
$154,857
FILES CLOSED FOR INCOMPLETENESS
0
$0
3
$152,220
12
$182,608
2
$44,785
0
$0
0
$0
3
$103,970
Aggregated Statistics For Year 2006 (Based on 4 partial tracts)
A) FHA, FSA/RHS & VA Home Purchase Loans
B) Conventional Home Purchase Loans
C) Refinancings
D) Home Improvement Loans
F) Non-occupant Loans on < 5 Family Dwellings (A B C & D)
G) Loans On Manufactured Home Dwelling (A B C & D)
Number
Average Value
Number
Average Value
Number
Average Value
Number
Average Value
Number
Average Value
Number
Average Value
LOANS ORIGINATED
1
$293,040
56
$161,846
113
$164,321
29
$96,559
18
$154,027
13
$147,198
APPLICATIONS APPROVED, NOT ACCEPTED
0
$0
17
$175,049
33
$165,355
8
$129,090
4
$190,265
2
$110,425
APPLICATIONS DENIED
0
$0
25
$151,284
95
$156,458
22
$101,061
12
$115,440
10
$110,912
APPLICATIONS WITHDRAWN
0
$0
12
$139,292
71
$153,822
11
$84,480
4
$152,940
2
$87,720
FILES CLOSED FOR INCOMPLETENESS
0
$0
6
$143,425
10
$132,170
1
$125,560
0
$0
0
$0
Aggregated Statistics For Year 2005 (Based on 4 partial tracts)
A) FHA, FSA/RHS & VA Home Purchase Loans
B) Conventional Home Purchase Loans
C) Refinancings
D) Home Improvement Loans
F) Non-occupant Loans on < 5 Family Dwellings (A B C & D)
G) Loans On Manufactured Home Dwelling (A B C & D)
Number
Average Value
Number
Average Value
Number
Average Value
Number
Average Value
Number
Average Value
Number
Average Value
LOANS ORIGINATED
1
$133,220
56
$136,843
114
$124,249
22
$77,500
26
$109,537
10
$128,378
APPLICATIONS APPROVED, NOT ACCEPTED
0
$0
18
$102,076
22
$129,836
3
$110,443
5
$121,530
6
$88,467
APPLICATIONS DENIED
0
$0
35
$146,972
105
$121,003
28
$82,456
9
$135,691
20
$110,141
APPLICATIONS WITHDRAWN
0
$0
21
$105,504
79
$131,506
21
$87,191
8
$138,808
9
$93,203
FILES CLOSED FOR INCOMPLETENESS
0
$0
2
$116,330
9
$112,406
1
$38,570
1
$96,790
0
$0
Aggregated Statistics For Year 2004 (Based on 4 partial tracts)
A) FHA, FSA/RHS & VA Home Purchase Loans
B) Conventional Home Purchase Loans
C) Refinancings
D) Home Improvement Loans
F) Non-occupant Loans on < 5 Family Dwellings (A B C & D)
G) Loans On Manufactured Home Dwelling (A B C & D)
Number
Average Value
Number
Average Value
Number
Average Value
Number
Average Value
Number
Average Value
Number
Average Value
LOANS ORIGINATED
4
$111,652
44
$96,963
95
$88,801
16
$66,802
13
$85,494
5
$92,366
APPLICATIONS APPROVED, NOT ACCEPTED
0
$0
7
$109,130
31
$107,617
2
$42,725
2
$73,255
3
$110,483
APPLICATIONS DENIED
1
$161,340
30
$88,162
96
$93,744
12
$51,022
7
$65,430
5
$74,984
APPLICATIONS WITHDRAWN
0
$0
6
$137,027
63
$102,232
5
$25,684
3
$67,183
3
$56,127
FILES CLOSED FOR INCOMPLETENESS
0
$0
1
$96,790
10
$78,679
0
$0
2
$53,220
0
$0
Aggregated Statistics For Year 2003 (Based on 4 partial tracts)
A) FHA, FSA/RHS & VA Home Purchase Loans
B) Conventional Home Purchase Loans
C) Refinancings
D) Home Improvement Loans
E) Loans on Dwellings For 5+ Families
F) Non-occupant Loans on < 5 Family Dwellings (A B C & D)
Number
Average Value
Number
Average Value
Number
Average Value
Number
Average Value
Number
Average Value
Number
Average Value
LOANS ORIGINATED
9
$85,141
46
$91,600
102
$97,905
5
$37,172
1
$725,950
18
$76,012
APPLICATIONS APPROVED, NOT ACCEPTED
0
$0
9
$105,611
25
$83,304
1
$19,610
0
$0
4
$90,700
APPLICATIONS DENIED
3
$99,223
13
$88,388
89
$107,575
7
$53,320
0
$0
7
$100,216
APPLICATIONS WITHDRAWN
1
$121,840
8
$148,065
47
$90,009
0
$0
0
$0
2
$91,205
FILES CLOSED FOR INCOMPLETENESS
0
$0
1
$50,670
8
$88,140
0
$0
0
$0
1
$42,200
Aggregated Statistics For Year 2002 (Based on 4 partial tracts)
A) FHA, FSA/RHS & VA Home Purchase Loans
B) Conventional Home Purchase Loans
C) Refinancings
D) Home Improvement Loans
E) Loans on Dwellings For 5+ Families
F) Non-occupant Loans on < 5 Family Dwellings (A B C & D)
Number
Average Value
Number
Average Value
Number
Average Value
Number
Average Value
Number
Average Value
Number
Average Value
LOANS ORIGINATED
10
$99,533
23
$88,059
68
$88,399
8
$21,696
1
$176,190
11
$73,310
APPLICATIONS APPROVED, NOT ACCEPTED
1
$107,610
2
$174,305
13
$85,432
4
$24,460
0
$0
0
$0
APPLICATIONS DENIED
2
$129,460
11
$87,666
52
$87,703
6
$22,737
0
$0
4
$100,192
APPLICATIONS WITHDRAWN
2
$66,515
3
$96,540
28
$91,766
4
$22,530
0
$0
1
$185,720
FILES CLOSED FOR INCOMPLETENESS
1
$88,480
2
$101,330
7
$122,936
1
$33,980
0
$0
1
$50,670
Aggregated Statistics For Year 2001 (Based on 4 partial tracts)
A) FHA, FSA/RHS & VA Home Purchase Loans
B) Conventional Home Purchase Loans
C) Refinancings
D) Home Improvement Loans
F) Non-occupant Loans on < 5 Family Dwellings (A B C & D)
Number
Average Value
Number
Average Value
Number
Average Value
Number
Average Value
Number
Average Value
LOANS ORIGINATED
13
$75,712
25
$87,786
52
$82,791
9
$20,637
6
$69,548
APPLICATIONS APPROVED, NOT ACCEPTED
0
$0
9
$78,084
7
$79,530
2
$31,630
1
$28,740
APPLICATIONS DENIED
1
$96,120
11
$78,911
50
$74,229
12
$18,721
6
$76,558
APPLICATIONS WITHDRAWN
1
$55,200
3
$78,967
33
$78,122
6
$24,360
3
$46,160
FILES CLOSED FOR INCOMPLETENESS
0
$0
0
$0
8
$75,212
1
$52,930
0
$0
Aggregated Statistics For Year 2000 (Based on 4 partial tracts)
A) FHA, FSA/RHS & VA Home Purchase Loans
B) Conventional Home Purchase Loans
C) Refinancings
D) Home Improvement Loans
F) Non-occupant Loans on < 5 Family Dwellings (A B C & D)
Number
Average Value
Number
Average Value
Number
Average Value
Number
Average Value
Number
Average Value
LOANS ORIGINATED
11
$78,055
29
$76,156
29
$63,848
9
$27,191
7
$60,169
APPLICATIONS APPROVED, NOT ACCEPTED
0
$0
7
$83,399
7
$63,060
5
$33,428
3
$59,373
APPLICATIONS DENIED
2
$92,650
13
$64,268
39
$53,358
11
$25,645
5
$67,172
APPLICATIONS WITHDRAWN
1
$30,740
3
$64,477
12
$52,698
2
$14,745
1
$94,850
FILES CLOSED FOR INCOMPLETENESS
0
$0
1
$137,200
3
$50,880
0
$0
0
$0
Aggregated Statistics For Year 1999 (Based on 2 partial tracts)
A) FHA, FSA/RHS & VA Home Purchase Loans
B) Conventional Home Purchase Loans
C) Refinancings
D) Home Improvement Loans
F) Non-occupant Loans on < 5 Family Dwellings (A B C & D)
Detailed PMIC statistics for the following Tracts:0042.00
, 0045.00
2005 - 2018 National Fire Incident Reporting System (NFIRS) incidents
Based on the data from the years 2005 - 2018 the average number of fire incidents per year is 26. The highest number of fires - 76 took place in 2017, and the least - 0 in 2010. The data has a dropping trend.
When looking into fire subcategories, the most reports belonged to: Outside Fires (57.0%), and Mobile Property/Vehicle Fires (21.9%).
Fire incident types reported to NFIRS in Zip Code 93270


 Nearest zip codes: 93218, 93258, 93261, 93267, 93287, 93215.


 Based on the data from the years 2005 - 2018 the average number of fire incidents per year is 26. The highest number of fires - 76 took place in 2017, and the least - 0 in 2010. The data has a dropping trend.
 When looking into fire subcategories, the most reports belonged to: Outside Fires (57.0%), and Mobile Property/Vehicle Fires (21.9%).