Estimated zip code population in 2022: 1,552 Zip code population in 2010: 1,401 Zip code population in 2000: 1,348
Houses and condos: 1,493 Renter-occupied apartments: 186
% of renters here:
32%
State:
44%
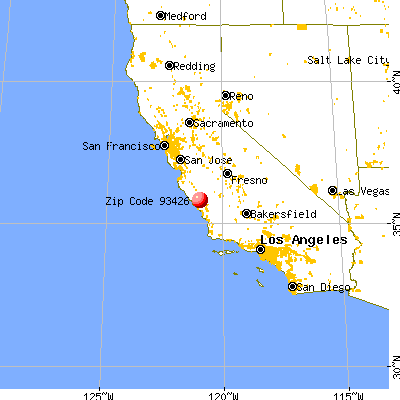
March 2022 cost of living index in zip code 93426: 95.2 (less than average, U.S. average is 100)
Land area: 212.2 sq. mi. Water area: 13.1 sq. mi.
Population density: 7 people per square mile
(very low).
OSM Map
General Map
Google Map
MSN Map
OSM Map
General Map
Google Map
MSN Map
OSM Map
General Map
Google Map
MSN Map
OSM Map
General Map
Google Map
MSN Map
Please wait while loading the map...
Real estate property taxes paid for housing units in 2022:
This zip code:
0.8% ($4,053)
California:
0.7% ($4,831)
Median real estate property taxes paid for housing units with mortgages in 2022: $4,428 (0.8%) Median real estate property taxes paid for housing units with no mortgage in 2022: $3,523 (0.8%)
Business Search- 14 Million verified businesses
Males: 736
(47.4%)
Females: 816
(52.6%)
For population 25 years and over in 93426:
High school or higher: 88.3%
Bachelor's degree or higher: 17.0%
Graduate or professional degree: 6.6%
Unemployed: 0.9%
Mean travel time to work (commute): 31.2 minutes
For population 15 years and over in 93426:
Never married: 31.7%
Now married: 54.0%
Separated: 1.3%
Widowed: 5.4%
Divorced: 7.7%
Zip code 93426 compared to state average:
Unemployed percentage significantly below state average.
Black race population percentage significantly below state average.
Hispanic race population percentage below state average.
Foreign-born population percentage significantly below state average.
Length of stay since moving in significantly above state average.
House age below state average.
Percentage of population with a bachelor's degree or higher below state average.
Estimated median house/condo value in 2022: $508,720
93426:
$508,720
California:
$715,900
According to our research of California and other state lists, there were 3 registered sex offenders living in 93426 zip code as of May 28, 2024. The ratio of all residents to sex offenders in zip code 93426 is 672 to 1. The ratio of registered sex offenders to all residents in this zip code is near the state average.
Median resident age:
This zip code:
41.0 years
California median age:
37.9 years
Average household size:
This zip code:
2.5 people
California:
2.8 people
Averages for the 2020 tax year for zip code 93426, filed in 2021:
Average Adjusted Gross Income (AGI) in 2020: $79,467 (Individual Income Tax Returns)
Here:
$79,467
State:
$95,910
Salary/wage: $61,141 (reported on 75.0% of returns)
Here:
$61,141
State:
$77,331
(% of AGI for various income ranges: 1224.4% for AGIs below $25k, 3760.0% for AGIs $25k-50k, 7907.5% for AGIs $50k-75k, 11526.7% for AGIs $75k-100k, 17787.5% for AGIs $100k-200k)
Taxable interest for individuals: $1,225 (reported on 38.5% of returns)
This zip code:
$1,225
California:
$2,294
(% of AGI for various income ranges: 6.7% for AGIs below $25k, 20.0% for AGIs $25k-50k, 37.5% for AGIs $50k-75k, 76.7% for AGIs $75k-100k, 175.0% for AGIs $100k-200k)
Ordinary dividends: $9,110 (reported on 19.2% of returns)
Here:
$9,110
State:
$10,949
(% of AGI for various income ranges: 44.4% for AGIs below $25k, 232.5% for AGIs $50k-75k, 1945.0% for AGIs $100k-200k)
Net capital gain/loss in AGI: +$19,378 (reported on 17.3% of returns)
Here:
+$19,378
State:
+$49,306
(% of AGI for various income ranges: 175.7% for AGIs $25k-50k, 1130.0% for AGIs $100k-200k)
Profit/loss from business: +$13,120 (reported on 19.2% of returns)
Here:
+$13,120
State:
+$15,671
(% of AGI for various income ranges: 375.6% for AGIs below $25k, 645.0% for AGIs $50k-75k, 1790.0% for AGIs $100k-200k)
Taxable individual retirement arrangement distribution: $18,250 (reported on 11.5% of returns)
93426:
$18,250
California:
$23,505
(% of AGI for various income ranges: 450.0% for AGIs $25k-50k, 2600.0% for AGIs $75k-100k)
Total itemized deductions: $35,117 (reported on 11.5% of returns)
Here:
$35,117
State:
$39,517
(% of AGI for various income ranges: 1285.0% for AGIs $50k-75k, 3982.5% for AGIs $100k-200k)
Charity contributions: $5,525 (reported on 7.7% of returns)
Here:
$5,525
State:
$12,598
(% of AGI for various income ranges: 552.5% for AGIs $100k-200k)
Taxes paid: $9,700 (reported on 11.5% of returns)
93426:
$9,700
State:
$8,807
(% of AGI for various income ranges: 370.0% for AGIs $50k-75k, 1085.0% for AGIs $100k-200k)
Earned income credit: $1,733 (reported on 11.5% of returns)
Here:
$1,733
State:
$2,074
(% of AGI for various income ranges: 115.6% for AGIs below $25k)
Percentage of individuals using paid preparers for their 2020 taxes: 96.2%
Here:
96%
State:
92%
(% for various income ranges: 93.3% for AGIs below $25k, 100.0% for AGIs $25k-50k, 87.5% for AGIs $50k-75k, 100.0% for AGIs $75k-100k, 100.0% for AGIs $100k-200k, 100.0% for AGIs over 200k)
Averages for the 2012 tax year for zip code 93426, filed in 2013:
Average Adjusted Gross Income (AGI) in 2012: $60,811 (Individual Income Tax Returns)
Here:
$60,811
State:
$72,726
Salary/wage: $48,274 (reported on 68.9% of returns)
Here:
$48,274
State:
$59,079
(% of AGI for various income ranges: 73.6% for AGIs below $25k, 61.1% for AGIs $25k-50k, 69.2% for AGIs $50k-75k, 61.6% for AGIs $75k-100k, 42.0% for AGIs $100k-200k)
Taxable interest for individuals: $1,350 (reported on 40.0% of returns)
This zip code:
$1,350
California:
$2,146
(% of AGI for various income ranges: 1.9% for AGIs below $25k, 1.6% for AGIs $25k-50k, 1.5% for AGIs $50k-75k, 0.1% for AGIs $75k-100k, 0.5% for AGIs $100k-200k)
Ordinary dividends: $4,212 (reported on 17.8% of returns)
Here:
$4,212
State:
$9,308
(% of AGI for various income ranges: 2.6% for AGIs below $25k, 3.2% for AGIs $25k-50k, 4.0% for AGIs $75k-100k)
Net capital gain/loss in AGI: +$9,000 (reported on 13.3% of returns)
Here:
+$9,000
State:
+$30,460
Profit/loss from business: +$4,782 (reported on 24.4% of returns)
Here:
+$4,782
State:
+$17,064
(% of AGI for various income ranges: 11.4% for AGIs below $25k, 9.2% for AGIs $25k-50k)
Taxable individual retirement arrangement distribution: $12,683 (reported on 13.3% of returns)
93426:
$12,683
California:
$19,557
Total itemized deductions: $29,106 (28% of AGI, reported on 37.8% of returns)
Here:
$29,106
State:
$34,004
Here:
28.0% of AGI
State:
22.7% of AGI
(% of AGI for various income ranges: 19.7% for AGIs $25k-50k, 19.1% for AGIs $50k-75k, 13.9% for AGIs $75k-100k, 21.3% for AGIs $100k-200k)
Charity contributions: $3,700 (reported on 28.9% of returns)
Here:
$3,700
State:
$4,659
(% of AGI for various income ranges: 1.3% for AGIs $25k-50k, 1.6% for AGIs $50k-75k, 1.0% for AGIs $75k-100k, 2.5% for AGIs $100k-200k)
Taxes paid: $10,188 (reported on 37.8% of returns)
93426:
$10,188
State:
$14,448
(% of AGI for various income ranges: 5.2% for AGIs $25k-50k, 3.8% for AGIs $50k-75k, 4.5% for AGIs $75k-100k, 9.2% for AGIs $100k-200k)
Earned income credit: $2,429 (reported on 15.6% of returns)
Here:
$2,429
State:
$2,286
(% of AGI for various income ranges: 6.7% for AGIs below $25k, 1.2% for AGIs $25k-50k)
Percentage of individuals using paid preparers for their 2012 taxes: 55.6%
Here:
56%
State:
64%
(% for various income ranges: 37.5% for AGIs below $25k, 60.0% for AGIs $25k-50k, 75.0% for AGIs $50k-75k, 60.0% for AGIs $75k-100k, 66.7% for AGIs $100k-200k)
Averages for the 2004 tax year for zip code 93426, filed in 2005:
Average Adjusted Gross Income (AGI) in 2004: $46,402 (Individual Income Tax Returns)
Here:
$46,402
State:
$58,600
Salary/wage: $41,701 (reported on 68.4% of returns)
Here:
$41,701
State:
$49,455
(% of AGI for various income ranges: 63.2% for AGIs $10k-25k, 68.8% for AGIs $25k-50k, 63.7% for AGIs $50k-75k, 70.0% for AGIs $75k-100k, 47.6% for AGIs over 100k)
Taxable interest for individuals: $4,009 (reported on 53.3% of returns)
This zip code:
$4,009
California:
$2,365
(% of AGI for various income ranges: 2.8% for AGIs $10k-25k, 1.8% for AGIs $25k-50k, 5.4% for AGIs $50k-75k, 1.7% for AGIs $75k-100k, 6.8% for AGIs over 100k)
Taxable dividends: $5,874 (reported on 27.7% of returns)
Here:
$5,874
State:
$4,746
(% of AGI for various income ranges: 1.7% for AGIs $10k-25k, 1.2% for AGIs $25k-50k, 1.4% for AGIs $50k-75k, 1.4% for AGIs $75k-100k, 6.7% for AGIs over 100k)
Net capital gain/loss: +$13,359 (reported on 24.0% of returns)
Here:
+$13,359
State:
+$23,418
(% of AGI for various income ranges: -0.9% for AGIs $10k-25k, 0.6% for AGIs $25k-50k, 3.2% for AGIs $50k-75k, 7.3% for AGIs $75k-100k, 13.8% for AGIs over 100k)
Profit/loss from business: +$9,301 (reported on 21.6% of returns)
Here:
+$9,301
State:
+$16,826
(% of AGI for various income ranges: 4.3% for AGIs $10k-25k, 7.7% for AGIs $25k-50k, 8.1% for AGIs $50k-75k, -1.1% for AGIs $75k-100k)
IRA payment deduction: $2,385 (reported on 3.0% of returns)
93426:
$2,385
California:
$3,192
Total itemized deductions: $24,928 (32% of AGI, reported on 41.9% of returns)
Here:
$24,928
State:
$28,113
Here:
32.5% of AGI
State:
25.3% of AGI
(% of AGI for various income ranges: 32.8% for AGIs $10k-25k, 20.0% for AGIs $25k-50k, 18.1% for AGIs $50k-75k, 20.4% for AGIs $75k-100k, 24.0% for AGIs over 100k)
Charity contributions deductions: $2,197 (3% of AGI, reported on 35.3% of returns)
Here:
$2,197
State:
$3,923
Here:
2.8% of AGI
State:
3.3% of AGI
(% of AGI for various income ranges: 1.8% for AGIs $10k-25k, 1.1% for AGIs $25k-50k, 1.9% for AGIs $50k-75k, 1.1% for AGIs $75k-100k, 2.0% for AGIs over 100k)
Total tax: $6,511 (reported on 77.0% of returns)
93426:
$6,511
State:
$10,761
(% of AGI for various income ranges: 5.0% for AGIs $10k-25k, 6.9% for AGIs $25k-50k, 9.5% for AGIs $50k-75k, 9.5% for AGIs $75k-100k, 15.0% for AGIs over 100k)
Earned income credit: $1,431 (reported on 11.9% of returns)
Here:
$1,431
State:
$1,763
Percentage of individuals using paid preparers for their 2004 taxes: 66.0%
Here:
66%
State:
66%
(% for various income ranges: 58.7% for AGIs below $10k, 58.1% for AGIs $10k-25k, 67.5% for AGIs $25k-50k, 67.7% for AGIs $50k-75k, 78.6% for AGIs $75k-100k, 81.4% for AGIs over 100k)
Household received Food Stamps/SNAP in the past 12 months: 32 Household did not receive Food Stamps/SNAP in the past 12 months: 540
Women who had a birth in the past 12 months: 44 (44 now married, 0 unmarried) Women who did not have a birth in the past 12 months: 345 (154 now married, 189 unmarried)
Housing units in zip code 93426 with a mortgage: 202 (3 second mortgage) Median monthly owner costs for units with a mortgage: $2,459 Median monthly owner costs for units without a mortgage: $708
Residents with income below the poverty level in 2022:
This zip code:
11.4%
Whole state:
12.2%
Residents with income below 50% of the poverty level in 2022:
This zip code:
8.2%
Whole state:
6.2%
Median number of rooms in houses and condos:
Here:
5.5
State:
6.0
Median number of rooms in apartments:
Here:
4.8
State:
3.9
Notable locations in this zip code not listed on our city pages
Notable locations in zip code 93426: Turkey Cove Marina (A), Smith Ranch (B), Lynch Ranch (C), Hames Valley Hall (D), Bee Rock Hall (E), Bradley Branch Monterey County Free Libraries (F), California Department of Forestry and Fire Protection Station 34 Oak Shores (G), Department of Forestry and Fire Protection Bradley Unit Station (H). Display/hide their locations on the map
Rivers and creeks: Harris Creek (A), Hames Creek (B), Deer Creek (C), Copperhead Creek (D), Cantinas Creek (E), Waterdog Creek (F), Waller Creek (G), El Piojo Creek (H), Sycamore Creek (I). Display/hide their locations on the map
In group quarters: 99 (-1 institutionalized population)
Size of family households: 203 2-persons, 31 3-persons, 68 4-persons, 67 5-persons, 26 6-persons
Size of nonfamily households: 150 1-person, 33 2-persons
198 married couples with children.
46 single-parent households (18 men, 28 women).
82.1% of residents of 93426 zip code speak English at home.
15.1% of residents speak Spanish at home (41% very well, 22% well, 12% not well, 25% not at all).
1.8% of residents speak other Indo-European language at home (100% very well).
0.2% of residents speak Asian or Pacific Island language at home (100% well).
0.5% of residents speak other language at home (100% very well).
Foreign born population: 181 (11.7%) (17.2% of them are naturalized citizens)
This zip code:
11.7%
Whole state:
26.7%
71%Honduras
18%France
3%Malaysia
2%Sweden
1%Kuwait
12%English
10%German
9%Swiss
4%Irish
2%Northern European
1%French
1%European
Year of entry for the foreign-born population
382010 or later
432000 to 2009
911990 to 1999
39Before 1990
Facilities with environmental interests located in this zip code:
GENERAL TELEPHONE OF CA (4034 BRADLEY RD in BRADLEY, CA)
Small Quantity Generators, between 100 kg and 1000 kg of hazardous waste/month (Resource Conservation and Recovery Act (tracking hazardous waste))
LAKE SAN ANTONIO RESORTS, INC. (SAN ANTONIO LAKE in BRADLEY, CA)
CRITERIA AND HAZARDOUS AIR POLLUTANT INVENTORY (Inventory of air pollution sources) Business SIC classification: GASOLINE SERVICE STATIONS
MADONNA CONSTRUCTION COMPANY (HWY 101 & JOLON RD in BRADLEY, CA)
CRITERIA AND HAZARDOUS AIR POLLUTANT INVENTORY (Inventory of air pollution sources) Business SIC classification: FERROALLOY ORES, EXCEPT VANADIUM; CONSTRUCTION SAND AND GRAVEL
MARK & DEBRA HUFF (70210 JOLON ROAD in BRADLEY, CA)
CRITERIA AND HAZARDOUS AIR POLLUTANT INVENTORY (Inventory of air pollution sources) Business SIC classification: GASOLINE SERVICE STATIONS
Housing units lacking complete plumbing facilities: 0.2% Housing units lacking complete kitchen facilities: 0.7%
37.3%Bottled, tank, or LP gas
29.9%Electricity
25.8%Wood
5.3%Solar energy
2.3%Utility gas
Population in 1990: 862. Population change in the 1990s: +486 (+56.4%).
Place of birth for U.S.-born residents:
This state: 976
Northeast: 105
Midwest: 60
South: 114
West: 77
65% of the 93426 zip code residents lived in the same house 5 years ago. Out of people who lived in different houses, 29% lived in this county. Out of people who lived in different counties, 50% lived in California.
87% of the 93426 zip code residents lived in the same house 1 year ago. Out of people who lived in different houses, 31% moved from this county. Out of people who lived in different houses, 65% moved from different county within same state. Out of people who lived in different houses, 3% moved from abroad.
Private vs. public school enrollment:
Students in private schools in grades 1 to 8 (elementary and middle school): 10
Here:
11.0%
California:
10.5%
Students in private schools in grades 9 to 12 (high school): 7
Here:
12.6%
California:
8.5%
Students in private undergraduate colleges: 11
Here:
16.9%
California:
15.9%
Occupation by median earnings in the past 12 months ($)
97,531Business and financial operations occupations
88,058Management occupations
79,710Installation, maintenance, and repair occupations
64,801Education, training, and library occupations
63,883Construction and extraction occupations
60,102Farming, fishing, and forestry occupations
Top industries in this zip code by the number of employees in 2005:
Accommodation and Food Services: RV (Recreational Vehicle) Parks and Campgrounds (20-49 employees: 1 establishment)
Arts, Entertainment, and Recreation: All Other Amusement and Recreation Industries (10-19: 1)
Other Services (except Public Administration): Other Similar Organizations (except Business, Professional, Labor, and Political Organizations) (10-19: 1)
Utilities: Water Supply and Irrigation Systems (1-4: 1)
Professional, Scientific, and Technical Services: Marketing Research and Public Opinion Polling (1-4: 1)
Professional, Scientific, and Technical Services: Other Scientific and Technical Consulting Services (1-4: 1)
Real Estate and Rental and Leasing: Offices of Real Estate Agents and Brokers (1-4: 1)
Construction: Painting and Wall Covering Contractors (1-4: 1)
People in group quarters in 2010:
126 people in military barracks and dormitories (nondisciplinary)
Fatal accident statistics in 2013:
Fatal accident count: 1
Vehicles involved in fatal accidents: 1
Fatal accidents caused by drunken drivers: 1
Fatalities: 1
Persons involved in fatal accidents: 1
Pedestrians involved in fatal accidents: 0
Fatal accident statistics in 2011:
Fatal accident count: 1
Vehicles involved in fatal accidents: 1
Fatal accidents caused by drunken drivers: 1
Fatalities: 1
Persons involved in fatal accidents: 1
Pedestrians involved in fatal accidents: 0
Home Mortgage Disclosure Act Aggregated Statistics For Year 2009 (Based on 2 partial tracts)
A) FHA, FSA/RHS & VA Home Purchase Loans
B) Conventional Home Purchase Loans
C) Refinancings
F) Non-occupant Loans on < 5 Family Dwellings (A B C & D)
G) Loans On Manufactured Home Dwelling (A B C & D)
Number
Average Value
Number
Average Value
Number
Average Value
Number
Average Value
Number
Average Value
LOANS ORIGINATED
1
$396,180
1
$281,670
7
$290,763
1
$457,520
1
$347,870
APPLICATIONS APPROVED, NOT ACCEPTED
0
$0
0
$0
0
$0
0
$0
0
$0
APPLICATIONS DENIED
0
$0
0
$0
6
$376,797
1
$421,230
1
$284,990
APPLICATIONS WITHDRAWN
0
$0
0
$0
3
$303,483
0
$0
0
$0
FILES CLOSED FOR INCOMPLETENESS
0
$0
0
$0
1
$3,438,590
1
$3,208,550
0
$0
Aggregated Statistics For Year 2008 (Based on 2 partial tracts)
A) FHA, FSA/RHS & VA Home Purchase Loans
B) Conventional Home Purchase Loans
C) Refinancings
D) Home Improvement Loans
F) Non-occupant Loans on < 5 Family Dwellings (A B C & D)
G) Loans On Manufactured Home Dwelling (A B C & D)
Number
Average Value
Number
Average Value
Number
Average Value
Number
Average Value
Number
Average Value
Number
Average Value
LOANS ORIGINATED
1
$206,780
2
$324,610
5
$361,520
1
$140,840
2
$285,375
1
$168,440
APPLICATIONS APPROVED, NOT ACCEPTED
0
$0
0
$0
1
$279,630
1
$204,480
0
$0
0
$0
APPLICATIONS DENIED
0
$0
2
$203,715
9
$239,639
1
$72,080
2
$295,090
3
$226,547
APPLICATIONS WITHDRAWN
0
$0
0
$0
1
$306,720
0
$0
0
$0
0
$0
FILES CLOSED FOR INCOMPLETENESS
0
$0
0
$0
1
$220,580
0
$0
0
$0
0
$0
Aggregated Statistics For Year 2007 (Based on 2 partial tracts)
B) Conventional Home Purchase Loans
C) Refinancings
D) Home Improvement Loans
F) Non-occupant Loans on < 5 Family Dwellings (A B C & D)
G) Loans On Manufactured Home Dwelling (A B C & D)
Number
Average Value
Number
Average Value
Number
Average Value
Number
Average Value
Number
Average Value
LOANS ORIGINATED
7
$288,754
15
$353,461
2
$220,710
2
$251,000
3
$368,747
APPLICATIONS APPROVED, NOT ACCEPTED
2
$240,010
5
$396,538
1
$230,810
1
$346,590
1
$148,500
APPLICATIONS DENIED
5
$298,234
18
$366,828
5
$178,154
3
$411,943
4
$260,647
APPLICATIONS WITHDRAWN
0
$0
7
$431,964
0
$0
1
$405,380
1
$525,510
FILES CLOSED FOR INCOMPLETENESS
0
$0
2
$517,460
0
$0
1
$297,010
0
$0
Aggregated Statistics For Year 2006 (Based on 2 partial tracts)
B) Conventional Home Purchase Loans
C) Refinancings
D) Home Improvement Loans
F) Non-occupant Loans on < 5 Family Dwellings (A B C & D)
G) Loans On Manufactured Home Dwelling (A B C & D)
Number
Average Value
Number
Average Value
Number
Average Value
Number
Average Value
Number
Average Value
LOANS ORIGINATED
7
$340,824
16
$345,699
3
$246,823
2
$592,735
2
$208,570
APPLICATIONS APPROVED, NOT ACCEPTED
3
$396,350
3
$385,360
0
$0
0
$0
1
$231,830
APPLICATIONS DENIED
3
$347,787
14
$376,079
3
$95,083
1
$243,840
2
$300,460
APPLICATIONS WITHDRAWN
2
$258,665
8
$238,091
1
$166,400
1
$251,510
1
$127,800
FILES CLOSED FOR INCOMPLETENESS
0
$0
2
$383,270
0
$0
1
$135,470
1
$74,890
Aggregated Statistics For Year 2005 (Based on 2 partial tracts)
B) Conventional Home Purchase Loans
C) Refinancings
D) Home Improvement Loans
F) Non-occupant Loans on < 5 Family Dwellings (A B C & D)
G) Loans On Manufactured Home Dwelling (A B C & D)
Number
Average Value
Number
Average Value
Number
Average Value
Number
Average Value
Number
Average Value
LOANS ORIGINATED
8
$334,485
20
$285,799
3
$157,533
4
$204,225
3
$197,323
APPLICATIONS APPROVED, NOT ACCEPTED
2
$251,385
4
$281,800
1
$69,010
2
$133,680
1
$173,550
APPLICATIONS DENIED
7
$294,123
17
$298,856
2
$139,300
2
$411,260
4
$185,310
APPLICATIONS WITHDRAWN
2
$402,315
9
$320,181
0
$0
1
$218,540
2
$345,700
FILES CLOSED FOR INCOMPLETENESS
0
$0
4
$287,358
0
$0
0
$0
0
$0
Aggregated Statistics For Year 2004 (Based on 2 partial tracts)
B) Conventional Home Purchase Loans
C) Refinancings
D) Home Improvement Loans
F) Non-occupant Loans on < 5 Family Dwellings (A B C & D)
G) Loans On Manufactured Home Dwelling (A B C & D)
Number
Average Value
Number
Average Value
Number
Average Value
Number
Average Value
Number
Average Value
LOANS ORIGINATED
5
$320,880
16
$304,835
4
$187,865
3
$350,770
3
$218,027
APPLICATIONS APPROVED, NOT ACCEPTED
3
$349,320
3
$235,237
0
$0
1
$281,160
1
$39,110
APPLICATIONS DENIED
5
$312,496
15
$295,473
1
$297,770
2
$265,315
4
$143,520
APPLICATIONS WITHDRAWN
2
$252,915
8
$324,612
1
$281,160
0
$0
1
$64,670
FILES CLOSED FOR INCOMPLETENESS
0
$0
1
$333,560
0
$0
0
$0
0
$0
Aggregated Statistics For Year 2003 (Based on 2 partial tracts)
B) Conventional Home Purchase Loans
C) Refinancings
D) Home Improvement Loans
F) Non-occupant Loans on < 5 Family Dwellings (A B C & D)
Number
Average Value
Number
Average Value
Number
Average Value
Number
Average Value
LOANS ORIGINATED
7
$224,781
22
$208,976
1
$4,600
3
$221,093
APPLICATIONS APPROVED, NOT ACCEPTED
1
$138,540
3
$290,617
0
$0
1
$177,130
APPLICATIONS DENIED
3
$192,467
11
$195,348
1
$103,770
1
$162,310
APPLICATIONS WITHDRAWN
1
$162,820
7
$192,139
0
$0
1
$84,090
FILES CLOSED FOR INCOMPLETENESS
0
$0
2
$208,185
0
$0
1
$81,030
Aggregated Statistics For Year 1999 (Based on 2 partial tracts)
Detailed PMIC statistics for the following Tracts:0114.00
2006 - 2018 National Fire Incident Reporting System (NFIRS) incidents
According to the data from the years 2006 - 2018 the average number of fire incidents per year is 11. The highest number of fire incidents - 24 took place in 2016, and the least - 4 in 2006. The data has a rising trend.
When looking into fire subcategories, the most incidents belonged to: Outside Fires (71.1%), and Mobile Property/Vehicle Fires (19.0%).
Fire incident types reported to NFIRS in Zip Code 93426


 Nearest zip codes: 93932, 93450, 93446, 93428, 93954, 93452.


 According to the data from the years 2006 - 2018 the average number of fire incidents per year is 11. The highest number of fire incidents - 24 took place in 2016, and the least - 4 in 2006. The data has a rising trend.
 When looking into fire subcategories, the most incidents belonged to: Outside Fires (71.1%), and Mobile Property/Vehicle Fires (19.0%).