Estimated zip code population in 2022: 1,635 Zip code population in 2010: 1,763 Zip code population in 2000: 1,816
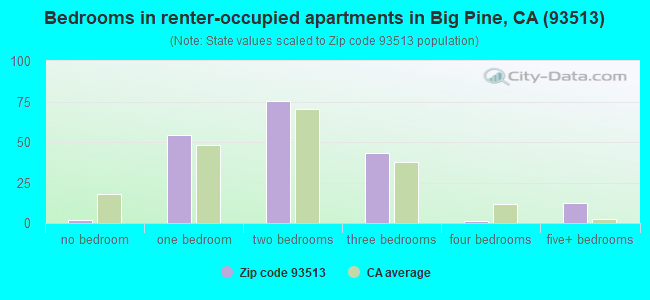
Houses and condos: 887 Renter-occupied apartments: 189
% of renters here:
27%
State:
44%
March 2022 cost of living index in zip code 93513: 95.6 (near average, U.S. average is 100)
Land area: 643.5 sq. mi. Water area: 2.9 sq. mi.
Population density: 3 people per square mile
(very low).
OSM Map
General Map
Google Map
MSN Map
OSM Map
General Map
Google Map
MSN Map
OSM Map
General Map
Google Map
MSN Map
OSM Map
General Map
Google Map
MSN Map
Please wait while loading the map...
Real estate property taxes paid for housing units in 2022:
This zip code:
0.8% ($2,620)
California:
0.7% ($4,831)
Median real estate property taxes paid for housing units with mortgages in 2022: $3,200 (0.8%) Median real estate property taxes paid for housing units with no mortgage in 2022: $2,301 (0.8%)
Business Search- 14 Million verified businesses
Males: 928
(56.8%)
Females: 706
(43.2%)
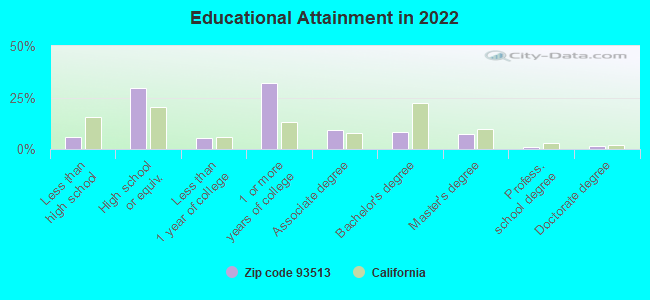
For population 25 years and over in 93513:
High school or higher: 92.5%
Bachelor's degree or higher: 18.1%
Graduate or professional degree: 9.8%
Unemployed: 2.5%
Mean travel time to work (commute): 18.1 minutes
For population 15 years and over in 93513:
Never married: 32.7%
Now married: 42.3%
Separated: 0.1%
Widowed: 8.2%
Divorced: 16.7%
Zip code 93513 compared to state average:
Median house value below state average.
Unemployed percentage below state average.
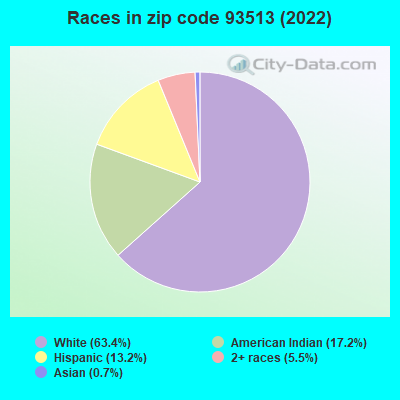
Black race population percentage significantly below state average.
Hispanic race population percentage significantly below state average.
Median age significantly above state average.
Foreign-born population percentage significantly below state average.
Renting percentage below state average.
Number of college students below state average.
Percentage of population with a bachelor's degree or higher below state average.
Estimated median house/condo value in 2022: $347,906
93513:
$347,906
California:
$715,900
According to our research of California and other state lists, there was 1 registered sex offender living in 93513 zip code as of May 28, 2024. The ratio of all residents to sex offenders in zip code 93513 is 1,828 to 1. The ratio of registered sex offenders to all residents in this zip code is much lower than the state average.
Median resident age:
This zip code:
49.0 years
California median age:
37.9 years
Average household size:
This zip code:
2.2 people
California:
2.8 people
Averages for the 2020 tax year for zip code 93513, filed in 2021:
Average Adjusted Gross Income (AGI) in 2020: $58,254 (Individual Income Tax Returns)
Here:
$58,254
State:
$95,910
Salary/wage: $51,074 (reported on 74.7% of returns)
Here:
$51,074
State:
$77,331
(% of AGI for various income ranges: 1016.2% for AGIs below $25k, 3667.3% for AGIs $25k-50k, 6147.8% for AGIs $50k-75k, 9496.0% for AGIs $75k-100k, 17822.5% for AGIs $100k-200k)
Taxable interest for individuals: $332 (reported on 33.7% of returns)
This zip code:
$332
California:
$2,294
(% of AGI for various income ranges: 10.0% for AGIs below $25k, 4.0% for AGIs $25k-50k, 24.4% for AGIs $50k-75k, 28.0% for AGIs $75k-100k, 43.8% for AGIs $100k-200k)
Ordinary dividends: $2,540 (reported on 12.0% of returns)
Here:
$2,540
State:
$10,949
(% of AGI for various income ranges: 35.0% for AGIs below $25k, 62.2% for AGIs $50k-75k, 177.5% for AGIs $100k-200k)
Net capital gain/loss in AGI: +$11,378 (reported on 10.8% of returns)
Here:
+$11,378
State:
+$49,306
(% of AGI for various income ranges: 47.5% for AGIs below $25k, 174.4% for AGIs $50k-75k, 988.7% for AGIs $100k-200k)
Profit/loss from business: +$8,245 (reported on 13.3% of returns)
Here:
+$8,245
State:
+$15,671
(% of AGI for various income ranges: 167.5% for AGIs below $25k, 77.3% for AGIs $25k-50k, 415.6% for AGIs $50k-75k, 186.2% for AGIs $100k-200k)
Taxable individual retirement arrangement distribution: $9,300 (reported on 9.6% of returns)
93513:
$9,300
California:
$23,505
(% of AGI for various income ranges: 318.0% for AGIs $25k-50k, 534.0% for AGIs $75k-100k)
Total itemized deductions: $26,325 (reported on 4.8% of returns)
Here:
$26,325
State:
$39,517
(% of AGI for various income ranges: 2106.0% for AGIs $75k-100k)
Charity contributions: $6,800 (reported on 3.6% of returns)
Here:
$6,800
State:
$12,598
(% of AGI for various income ranges: 408.0% for AGIs $75k-100k)
Taxes paid: $7,450 (reported on 4.8% of returns)
93513:
$7,450
State:
$8,807
(% of AGI for various income ranges: 596.0% for AGIs $75k-100k)
Earned income credit: $1,679 (reported on 16.9% of returns)
Here:
$1,679
State:
$2,074
(% of AGI for various income ranges: 91.2% for AGIs below $25k, 59.3% for AGIs $25k-50k)
Percentage of individuals using paid preparers for their 2020 taxes: 92.8%
Here:
93%
State:
92%
(% for various income ranges: 88.5% for AGIs below $25k, 95.0% for AGIs $25k-50k, 92.9% for AGIs $50k-75k, 88.9% for AGIs $75k-100k, 100.0% for AGIs $100k-200k)
Averages for the 2012 tax year for zip code 93513, filed in 2013:
Average Adjusted Gross Income (AGI) in 2012: $49,104 (Individual Income Tax Returns)
Here:
$49,104
State:
$72,726
Salary/wage: $44,998 (reported on 75.0% of returns)
Here:
$44,998
State:
$59,079
(% of AGI for various income ranges: 60.9% for AGIs below $25k, 63.3% for AGIs $25k-50k, 73.1% for AGIs $50k-75k, 69.5% for AGIs $75k-100k, 70.5% for AGIs $100k-200k)
Taxable interest for individuals: $678 (reported on 35.5% of returns)
This zip code:
$678
California:
$2,146
(% of AGI for various income ranges: 0.5% for AGIs below $25k, 1.0% for AGIs $25k-50k, 0.1% for AGIs $50k-75k, 0.6% for AGIs $75k-100k, 0.4% for AGIs $100k-200k)
Ordinary dividends: $2,112 (reported on 10.5% of returns)
Here:
$2,112
State:
$9,308
(% of AGI for various income ranges: 1.4% for AGIs below $25k, 0.4% for AGIs $25k-50k, 0.7% for AGIs $100k-200k)
Net capital gain/loss in AGI: +$512 (reported on 10.5% of returns)
Here:
+$512
State:
+$30,460
Profit/loss from business: +$5,815 (reported on 17.1% of returns)
Here:
+$5,815
State:
+$17,064
(% of AGI for various income ranges: 11.2% for AGIs below $25k, 3.1% for AGIs $25k-50k, 1.2% for AGIs $50k-75k, 0.5% for AGIs $100k-200k)
Taxable individual retirement arrangement distribution: $13,225 (reported on 10.5% of returns)
93513:
$13,225
California:
$19,557
Total itemized deductions: $21,176 (25% of AGI, reported on 27.6% of returns)
Here:
$21,176
State:
$34,004
Here:
25.0% of AGI
State:
22.7% of AGI
(% of AGI for various income ranges: 10.4% for AGIs below $25k, 7.5% for AGIs $25k-50k, 9.6% for AGIs $50k-75k, 13.0% for AGIs $75k-100k, 15.5% for AGIs $100k-200k)
Charity contributions: $2,875 (reported on 21.1% of returns)
Here:
$2,875
State:
$4,659
(% of AGI for various income ranges: 1.0% for AGIs $25k-50k, 0.8% for AGIs $50k-75k, 1.3% for AGIs $75k-100k, 1.9% for AGIs $100k-200k)
Taxes paid: $6,405 (reported on 27.6% of returns)
93513:
$6,405
State:
$14,448
(% of AGI for various income ranges: 1.7% for AGIs below $25k, 1.3% for AGIs $25k-50k, 2.6% for AGIs $50k-75k, 3.6% for AGIs $75k-100k, 6.0% for AGIs $100k-200k)
Earned income credit: $1,986 (reported on 18.4% of returns)
Here:
$1,986
State:
$2,286
(% of AGI for various income ranges: 5.7% for AGIs below $25k, 1.2% for AGIs $25k-50k)
Percentage of individuals using paid preparers for their 2012 taxes: 50.0%
Here:
50%
State:
64%
(% for various income ranges: 40.7% for AGIs below $25k, 50.0% for AGIs $25k-50k, 53.8% for AGIs $50k-75k, 62.5% for AGIs $75k-100k, 60.0% for AGIs $100k-200k)
Averages for the 2004 tax year for zip code 93513, filed in 2005:
Average Adjusted Gross Income (AGI) in 2004: $39,766 (Individual Income Tax Returns)
Here:
$39,766
State:
$58,600
Salary/wage: $35,742 (reported on 78.1% of returns)
Here:
$35,742
State:
$49,455
(% of AGI for various income ranges: 91.2% for AGIs below $10k, 59.1% for AGIs $10k-25k, 71.0% for AGIs $25k-50k, 71.6% for AGIs $50k-75k, 81.7% for AGIs $75k-100k, 61.9% for AGIs over 100k)
Taxable interest for individuals: $1,195 (reported on 46.0% of returns)
This zip code:
$1,195
California:
$2,365
(% of AGI for various income ranges: 3.1% for AGIs below $10k, 2.9% for AGIs $10k-25k, 1.4% for AGIs $25k-50k, 1.5% for AGIs $50k-75k, 0.4% for AGIs $75k-100k, 1.1% for AGIs over 100k)
Taxable dividends: $963 (reported on 16.8% of returns)
Here:
$963
State:
$4,746
(% of AGI for various income ranges: 3.3% for AGIs below $10k, 1.4% for AGIs $10k-25k, 0.3% for AGIs $25k-50k, 0.4% for AGIs $50k-75k, 0.2% for AGIs over 100k)
Net capital gain/loss: +$6,938 (reported on 13.9% of returns)
Here:
+$6,938
State:
+$23,418
(% of AGI for various income ranges: 2.0% for AGIs below $10k, 1.4% for AGIs $10k-25k, 1.3% for AGIs $25k-50k, 0.8% for AGIs $50k-75k, 0.4% for AGIs $75k-100k, 8.4% for AGIs over 100k)
Profit/loss from business: +$4,642 (reported on 15.3% of returns)
Here:
+$4,642
State:
+$16,826
(% of AGI for various income ranges: -6.5% for AGIs below $10k, 8.0% for AGIs $10k-25k, 1.8% for AGIs $25k-50k, 1.1% for AGIs $50k-75k, 1.4% for AGIs $75k-100k)
IRA payment deduction: $2,812 (reported on 2.0% of returns)
93513:
$2,812
California:
$3,192
Total itemized deductions: $17,340 (27% of AGI, reported on 31.1% of returns)
Here:
$17,340
State:
$28,113
Here:
27.0% of AGI
State:
25.3% of AGI
(% of AGI for various income ranges: 15.1% for AGIs $10k-25k, 11.7% for AGIs $25k-50k, 12.7% for AGIs $50k-75k, 15.3% for AGIs $75k-100k, 15.6% for AGIs over 100k)
Charity contributions deductions: $2,525 (4% of AGI, reported on 25.1% of returns)
Here:
$2,525
State:
$3,923
Here:
3.7% of AGI
State:
3.3% of AGI
(% of AGI for various income ranges: 0.9% for AGIs $10k-25k, 1.3% for AGIs $25k-50k, 1.0% for AGIs $50k-75k, 2.0% for AGIs $75k-100k, 2.8% for AGIs over 100k)
Total tax: $4,744 (reported on 78.6% of returns)
93513:
$4,744
State:
$10,761
(% of AGI for various income ranges: 3.5% for AGIs below $10k, 4.3% for AGIs $10k-25k, 6.7% for AGIs $25k-50k, 9.4% for AGIs $50k-75k, 11.1% for AGIs $75k-100k, 14.8% for AGIs over 100k)
Earned income credit: $1,838 (reported on 13.0% of returns)
Here:
$1,838
State:
$1,763
Percentage of individuals using paid preparers for their 2004 taxes: 60.6%
Here:
61%
State:
66%
(% for various income ranges: 45.4% for AGIs below $10k, 61.4% for AGIs $10k-25k, 59.8% for AGIs $25k-50k, 65.9% for AGIs $50k-75k, 72.3% for AGIs $75k-100k, 72.3% for AGIs over 100k)
Notable locations in zip code 93513: Charlies Butte (A), Division Creek Powerhouse (B), Upper Sage Flat Campground (C), Big Pine Creek Picnic Site (D), Big Pine Creek South Fork Trailhead (E), Birch Lake Trailhead (F), North Fork Big Pine Creek Trailhead (G), Sawmill Pass Trailhead (H), Taboose Pass Trailhead (I), Big Pine Campground (J), Birch Campground (K), Fish Springs State Fish Hatchery (L), Sawmill Creek Campground (M), Second Falls Campground (N), Devils Gate (O), Glacier Camp (P), Glacier Lodge (Q), Taboose Creek Campground (R), Baker Creek Recreation Site (S), Inyo Camp (T). Display/hide their locations on the map
Lakes and swamps: Summit Lake (A), Finger Lake (B), Fourth Lake (C), First Lake (D), Fifth Lake (E), Willow Lake (F), Red Lake (G), Big Pine Lake (H). Display/hide their locations on the map
Creeks: Taboose Creek (A), Wyman Creek (B), North Fork Big Pine Creek (C), Little Pine Creek (D), Red Mountain Creek (E), Tinemaha Creek (F), South Fork Big Pine Creek (G), Fuller Creek (H), Division Creek (I). Display/hide their locations on the map
In group quarters: 57 (-1 institutionalized population)
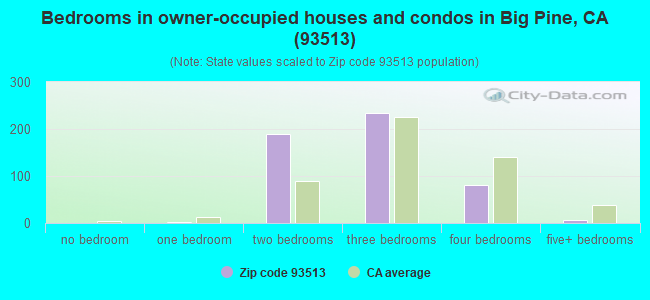
Size of family households: 181 2-persons, 90 3-persons, 30 4-persons, 24 5-persons, 19 6-persons
Size of nonfamily households: 287 1-person, 79 2-persons
215 married couples with children.
25 single-parent households (5 men, 20 women).
86.5% of residents of 93513 zip code speak English at home.
6.4% of residents speak Spanish at home (93% very well, 7% not well).
1.8% of residents speak Asian or Pacific Island language at home (100% very well).
4.7% of residents speak other language at home (88% very well, 8% well, 4% not at all).
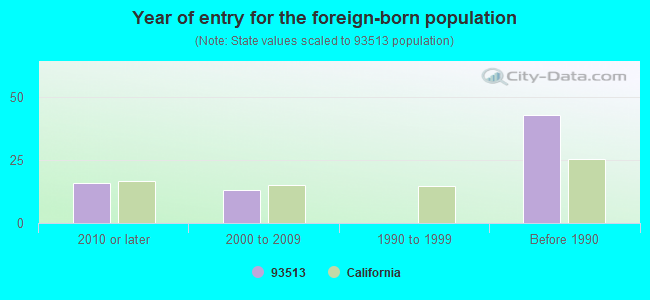
Foreign born population: 72 (4.4%) (78.1% of them are naturalized citizens)
This zip code:
4.4%
Whole state:
26.7%
63%Honduras
17%Japan
10%France
7%Malaysia
6%Irish
4%German
3%Italian
3%Northern European
2%Finnish
2%English
2%Scottish
Year of entry for the foreign-born population
162010 or later
132000 to 2009
01990 to 1999
43Before 1990
Facilities with environmental interests located in this zip code:
CHEVRON STATION 93271 (109 S MAIN ST in BIG PINE, CA)
STATE MASTER (California - Hazardous Waste Tracking) - HAZARDOU WASTE PROGRAM Small Quantity Generators, between 100 kg and 1000 kg of hazardous waste/month (Resource Conservation and Recovery Act (tracking hazardous waste)) - notification Organizations: CHEVRON USA PRODUCTS CO (CONTACT/OWNER)
Alternative names: CHEVRON PRODUCTS SS# 93271
EUREKA DUNES HIGH (CONT) (590 S. MAIN ST in BIG PINE, CA)
(National Center for Education Statistics) - STATE ID-1430123 Organizations: BIG PINE UNIFIED (SCHOOL DISTRICT)
A AND R ANCHOR BIG PINE RESERVATION (451 BUTCHER LN in BIG PINE, CA) . Federal Facility. BUREAU OF INDIAN AFFAIRS
Large Quantity Generators, more that 1000 kg of hazardous waste/month (Resource Conservation and Recovery Act (tracking hazardous waste)) - notification Organizations: BUREAU OF INDIAN AFFAIRS (CONTACT/OWNER)
AMERICAN PERLITE COMPANY (FULLER CREEK RD(3MI W HWY 395, 8.5MI S BIG PINE in BIG PINE, CA)
CRITERIA AND HAZARDOUS AIR POLLUTANT INVENTORY (Inventory of air pollution sources) Business SIC classification: MINERALS AND EARTHS, GROUND OR OTHERWISE TREATED
Housing units lacking complete plumbing facilities: 4.0% Housing units lacking complete kitchen facilities: 3.6%
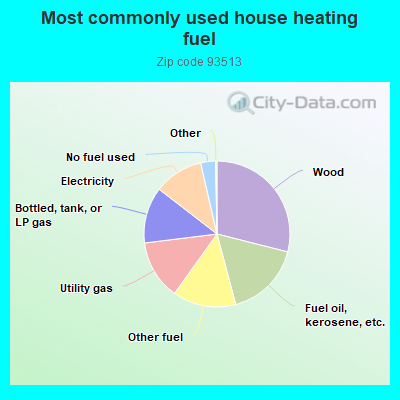
29.1%Wood
17.0%Fuel oil, kerosene, etc.
14.1%Other fuel
13.2%Utility gas
12.5%Bottled, tank, or LP gas
11.0%Electricity
3.3%No fuel used
Population in 1990: 1,642. Population change in the 1990s: +174 (+10.6%).
Place of birth for U.S.-born residents:
This state: 1,270
Northeast: 74
Midwest: 97
South: 24
West: 90
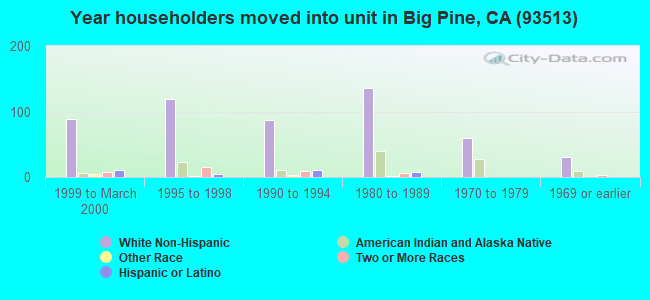
61% of the 93513 zip code residents lived in the same house 5 years ago. Out of people who lived in different houses, 54% lived in this county. Out of people who lived in different counties, 50% lived in California.
94% of the 93513 zip code residents lived in the same house 1 year ago. Out of people who lived in different houses, 41% moved from this county. Out of people who lived in different houses, 54% moved from different county within same state. Out of people who lived in different houses, 9% moved from different state.
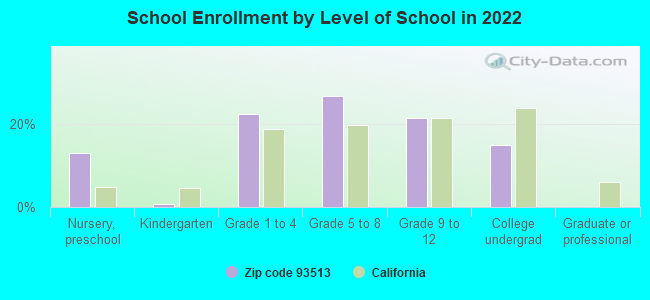
Private vs. public school enrollment:
Students in private schools in grades 1 to 8 (elementary and middle school): 11
Here:
7.7%
California:
10.5%
Students in private schools in grades 9 to 12 (high school):
Here:
0.0%
California:
8.5%
Students in private undergraduate colleges: 3
Here:
8.5%
California:
15.9%
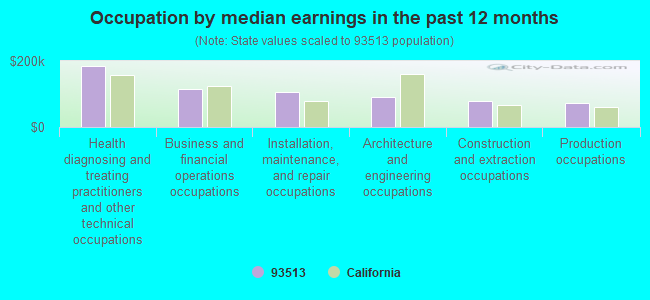
Occupation by median earnings in the past 12 months ($)
183,951Health diagnosing and treating practitioners and other technical occupations
116,314Business and financial operations occupations
104,756Installation, maintenance, and repair occupations
91,341Architecture and engineering occupations
79,715Construction and extraction occupations
71,449Production occupations
Top industries in this zip code by the number of employees in 2005:
Accommodation and Food Services: Hotels (except Casino Hotels) and Motels (10-19: 1)
Other Services (except Public Administration): Appliance Repair and Maintenance (5-9: 1)
Utilities: Natural Gas Distribution (1-4: 2)
Accommodation and Food Services: RV (Recreational Vehicle) Parks and Campgrounds (1-4: 1)
Construction: Plumbing, Heating, and Air-Conditioning Contractors (1-4: 1)
People in group quarters in 2010:
25 people in workers' group living quarters and job corps centers
People in group quarters in 2000:
44 people in nursing homes
Fatal accident statistics in 2013:
Fatal accident count: 1
Vehicles involved in fatal accidents: 1
Fatal accidents caused by drunken drivers: 0
Fatalities: 1
Persons involved in fatal accidents: 4
Pedestrians involved in fatal accidents: 0
Fatal accident statistics in 2012:
Fatal accident count: 1
Vehicles involved in fatal accidents: 1
Fatal accidents caused by drunken drivers: 1
Fatalities: 1
Persons involved in fatal accidents: 1
Pedestrians involved in fatal accidents: 0
2005 - 2018 National Fire Incident Reporting System (NFIRS) incidents
According to the data from the years 2005 - 2018 the average number of fires per year is 9. The highest number of fire incidents - 20 took place in 2014, and the least - 0 in 2006. The data has a dropping trend.
When looking into fire subcategories, the most incidents belonged to: Outside Fires (71.8%), and Mobile Property/Vehicle Fires (15.3%).
Fire incident types reported to NFIRS in Zip Code 93513

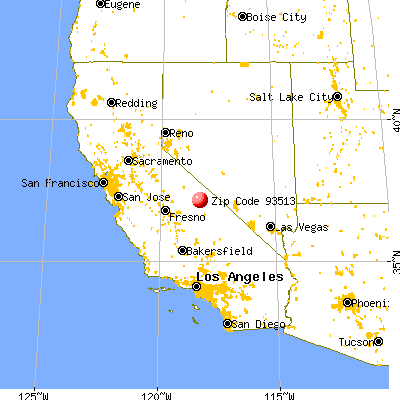


 Nearest zip codes: 93526, 93514, 93633, 93545, 89010, 93530.


 According to the data from the years 2005 - 2018 the average number of fires per year is 9. The highest number of fire incidents - 20 took place in 2014, and the least - 0 in 2006. The data has a dropping trend.
 When looking into fire subcategories, the most incidents belonged to: Outside Fires (71.8%), and Mobile Property/Vehicle Fires (15.3%).