Estimated zip code population in 2022: 886 Zip code population in 2010: 1,146 Zip code population in 2000: 1,009
Houses and condos: 622 Renter-occupied apartments: 64
% of renters here:
15%
State:
44%
March 2022 cost of living index in zip code 93518: 96.0 (near average, U.S. average is 100)
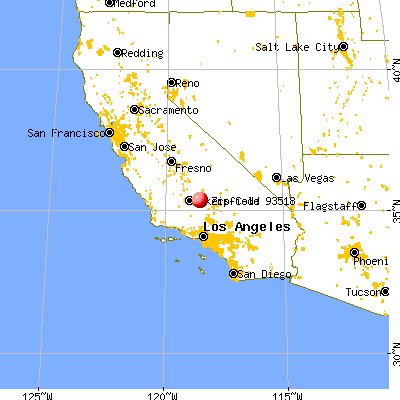
Land area: 298.1 sq. mi. Water area: 0.1 sq. mi.
Population density: 3 people per square mile
(very low).
OSM Map
General Map
Google Map
MSN Map
OSM Map
General Map
Google Map
MSN Map
OSM Map
General Map
Google Map
MSN Map
OSM Map
General Map
Google Map
MSN Map
Please wait while loading the map...
Real estate property taxes paid for housing units in 2022:
This zip code:
0.6% ($1,600)
California:
0.7% ($4,831)
Median real estate property taxes paid for housing units with mortgages in 2022: $2,119 (0.7%) Median real estate property taxes paid for housing units with no mortgage in 2022: $1,505 (0.7%)
Business Search- 14 Million verified businesses
Males: 437
(49.3%)
Females: 449
(50.7%)
For population 25 years and over in 93518:
High school or higher: 92.6%
Bachelor's degree or higher: 23.6%
Graduate or professional degree: 6.3%
Unemployed: 15.3%
Mean travel time to work (commute): 47.3 minutes
For population 15 years and over in 93518:
Never married: 20.5%
Now married: 54.9%
Separated: 3.3%
Widowed: 6.8%
Divorced: 14.5%
Zip code 93518 compared to state average:
Median household income below state average.
Median house value significantly below state average.
Unemployed percentage significantly above state average.
Black race population percentage below state average.
Hispanic race population percentage significantly below state average.
Median age significantly above state average.
Foreign-born population percentage significantly below state average.
Renting percentage significantly below state average.
Length of stay since moving in significantly above state average.
Averages for the 2020 tax year for zip code 93518, filed in 2021:
Average Adjusted Gross Income (AGI) in 2020: $54,724 (Individual Income Tax Returns)
Here:
$54,724
State:
$95,910
Salary/wage: $50,254 (reported on 58.5% of returns)
Here:
$50,254
State:
$77,331
(% of AGI for various income ranges: 814.4% for AGIs below $25k, 3093.3% for AGIs $25k-50k, 4100.0% for AGIs $50k-75k, 29235.0% for AGIs $100k-200k)
Taxable interest for individuals: $260 (reported on 36.6% of returns)
This zip code:
$260
California:
$2,294
(% of AGI for various income ranges: 7.8% for AGIs below $25k, 8.3% for AGIs $25k-50k, 14.0% for AGIs $50k-75k, 100.0% for AGIs $100k-200k)
Ordinary dividends: $2,000 (reported on 14.6% of returns)
Here:
$2,000
State:
$10,949
(% of AGI for various income ranges: 31.1% for AGIs below $25k, 184.0% for AGIs $50k-75k)
Net capital gain/loss in AGI: +$1,433 (reported on 14.6% of returns)
Here:
+$1,433
State:
+$49,306
(% of AGI for various income ranges: 91.7% for AGIs $25k-50k)
Profit/loss from business: +$8,111 (reported on 22.0% of returns)
Here:
+$8,111
State:
+$15,671
(% of AGI for various income ranges: 560.0% for AGIs below $25k, 452.0% for AGIs $50k-75k)
Taxable individual retirement arrangement distribution: $16,960 (reported on 12.2% of returns)
93518:
$16,960
California:
$23,505
(% of AGI for various income ranges: 330.0% for AGIs below $25k, 1102.0% for AGIs $50k-75k)
Total itemized deductions: $28,975 (reported on 9.8% of returns)
Here:
$28,975
State:
$39,517
(% of AGI for various income ranges: 5795.0% for AGIs $100k-200k)
Charity contributions: $5,900 (reported on 7.3% of returns)
Here:
$5,900
State:
$12,598
(% of AGI for various income ranges: )
Taxes paid: $7,375 (reported on 9.8% of returns)
93518:
$7,375
State:
$8,807
(% of AGI for various income ranges: 1475.0% for AGIs $100k-200k)
Earned income credit: $2,271 (reported on 17.1% of returns)
Here:
$2,271
State:
$2,074
(% of AGI for various income ranges: 176.7% for AGIs below $25k)
Percentage of individuals using paid preparers for their 2020 taxes: 92.7%
Here:
93%
State:
92%
(% for various income ranges: 93.8% for AGIs below $25k, 88.9% for AGIs $25k-50k, 100.0% for AGIs $50k-75k, 100.0% for AGIs $75k-100k, 85.7% for AGIs $100k-200k)
Averages for the 2012 tax year for zip code 93518, filed in 2013:
Average Adjusted Gross Income (AGI) in 2012: $50,464 (Individual Income Tax Returns)
Here:
$50,464
State:
$72,726
Salary/wage: $42,876 (reported on 59.5% of returns)
Here:
$42,876
State:
$59,079
(% of AGI for various income ranges: 52.4% for AGIs below $25k, 40.1% for AGIs $25k-50k, 62.3% for AGIs $50k-75k, 52.9% for AGIs $75k-100k, 47.3% for AGIs $100k-200k)
Taxable interest for individuals: $1,165 (reported on 40.5% of returns)
This zip code:
$1,165
California:
$2,146
(% of AGI for various income ranges: 1.6% for AGIs below $25k, 0.4% for AGIs $25k-50k, 0.6% for AGIs $50k-75k, 0.6% for AGIs $75k-100k, 1.3% for AGIs $100k-200k)
Ordinary dividends: $2,183 (reported on 14.3% of returns)
Here:
$2,183
State:
$9,308
Net capital gain/loss in AGI: +$357 (reported on 16.7% of returns)
Here:
+$357
State:
+$30,460
(% of AGI for various income ranges: 1.5% for AGIs $75k-100k)
Profit/loss from business: +$5,300 (reported on 21.4% of returns)
Here:
+$5,300
State:
+$17,064
Taxable individual retirement arrangement distribution: $14,200 (reported on 14.3% of returns)
93518:
$14,200
California:
$19,557
Total itemized deductions: $20,988 (27% of AGI, reported on 40.5% of returns)
Here:
$20,988
State:
$34,004
Here:
27.4% of AGI
State:
22.7% of AGI
(% of AGI for various income ranges: 21.1% for AGIs below $25k, 15.1% for AGIs $25k-50k, 18.5% for AGIs $50k-75k, 14.1% for AGIs $75k-100k, 17.1% for AGIs $100k-200k)
Charity contributions: $3,385 (reported on 31.0% of returns)
Here:
$3,385
State:
$4,659
(% of AGI for various income ranges: 2.0% for AGIs $25k-50k, 3.1% for AGIs $50k-75k, 1.8% for AGIs $75k-100k, 2.2% for AGIs $100k-200k)
Taxes paid: $6,082 (reported on 40.5% of returns)
93518:
$6,082
State:
$14,448
(% of AGI for various income ranges: 3.3% for AGIs below $25k, 3.1% for AGIs $25k-50k, 4.5% for AGIs $50k-75k, 4.2% for AGIs $75k-100k, 6.6% for AGIs $100k-200k)
Earned income credit: $2,340 (reported on 11.9% of returns)
Here:
$2,340
State:
$2,286
(% of AGI for various income ranges: 6.3% for AGIs below $25k)
Percentage of individuals using paid preparers for their 2012 taxes: 64.3%
Here:
64%
State:
64%
(% for various income ranges: 60.0% for AGIs below $25k, 60.0% for AGIs $25k-50k, 71.4% for AGIs $50k-75k, 75.0% for AGIs $75k-100k, 66.7% for AGIs $100k-200k)
Averages for the 2004 tax year for zip code 93518, filed in 2005:
Average Adjusted Gross Income (AGI) in 2004: $41,954 (Individual Income Tax Returns)
Here:
$41,954
State:
$58,600
Salary/wage: $39,294 (reported on 66.9% of returns)
Here:
$39,294
State:
$49,455
(% of AGI for various income ranges: 163.6% for AGIs below $10k, 51.8% for AGIs $10k-25k, 61.0% for AGIs $25k-50k, 77.1% for AGIs $50k-75k, 64.9% for AGIs $75k-100k, 49.9% for AGIs over 100k)
Taxable interest for individuals: $1,013 (reported on 55.1% of returns)
This zip code:
$1,013
California:
$2,365
(% of AGI for various income ranges: 11.0% for AGIs below $10k, 2.6% for AGIs $10k-25k, 1.6% for AGIs $25k-50k, 0.6% for AGIs $50k-75k, 0.5% for AGIs $75k-100k, 1.2% for AGIs over 100k)
Taxable dividends: $1,377 (reported on 17.8% of returns)
Here:
$1,377
State:
$4,746
(% of AGI for various income ranges: 3.5% for AGIs $10k-25k, 0.5% for AGIs $25k-50k, 0.1% for AGIs $75k-100k, 0.5% for AGIs over 100k)
Net capital gain/loss: +$18,423 (reported on 18.1% of returns)
Here:
+$18,423
State:
+$23,418
(% of AGI for various income ranges: -3.5% for AGIs below $10k, -0.7% for AGIs $10k-25k, 0.3% for AGIs $25k-50k, 3.6% for AGIs $50k-75k, 24.4% for AGIs over 100k)
Profit/loss from business: +$3,505 (reported on 22.0% of returns)
Here:
+$3,505
State:
+$16,826
(% of AGI for various income ranges: -33.2% for AGIs below $10k, 15.9% for AGIs $10k-25k, 4.7% for AGIs $25k-50k, -1.8% for AGIs $50k-75k, 1.9% for AGIs $75k-100k)
Total itemized deductions: $18,617 (28% of AGI, reported on 42.4% of returns)
Here:
$18,617
State:
$28,113
Here:
27.9% of AGI
State:
25.3% of AGI
(% of AGI for various income ranges: 64.3% for AGIs below $10k, 24.2% for AGIs $10k-25k, 16.6% for AGIs $25k-50k, 21.2% for AGIs $50k-75k, 19.3% for AGIs $75k-100k, 14.2% for AGIs over 100k)
Charity contributions deductions: $2,357 (4% of AGI, reported on 35.6% of returns)
Here:
$2,357
State:
$3,923
Here:
3.7% of AGI
State:
3.3% of AGI
(% of AGI for various income ranges: 1.5% for AGIs $10k-25k, 2.0% for AGIs $25k-50k, 2.6% for AGIs $50k-75k, 1.9% for AGIs $75k-100k, 1.8% for AGIs over 100k)
Total tax: $5,233 (reported on 75.5% of returns)
93518:
$5,233
State:
$10,761
(% of AGI for various income ranges: 4.6% for AGIs below $10k, 4.5% for AGIs $10k-25k, 7.2% for AGIs $25k-50k, 7.9% for AGIs $50k-75k, 9.5% for AGIs $75k-100k, 13.7% for AGIs over 100k)
Earned income credit: $1,283 (reported on 13.9% of returns)
Here:
$1,283
State:
$1,763
Percentage of individuals using paid preparers for their 2004 taxes: 70.8%
Here:
71%
State:
66%
(% for various income ranges: 55.8% for AGIs below $10k, 72.4% for AGIs $10k-25k, 77.1% for AGIs $25k-50k, 73.4% for AGIs $50k-75k, 71.1% for AGIs $75k-100k, 84.4% for AGIs over 100k)
Household received Food Stamps/SNAP in the past 12 months: 36 Household did not receive Food Stamps/SNAP in the past 12 months: 385
Women who had a birth in the past 12 months: 5 (5 now married, 0 unmarried) Women who did not have a birth in the past 12 months: 86 (23 now married, 64 unmarried)
Housing units in zip code 93518 with a mortgage: 130 (2 second mortgage, 2 both second mortgage and home equity loan) Median monthly owner costs for units with a mortgage: $1,400 Median monthly owner costs for units without a mortgage: $532
Residents with income below the poverty level in 2022:
This zip code:
13.4%
Whole state:
12.2%
Residents with income below 50% of the poverty level in 2022:
This zip code:
8.3%
Whole state:
6.2%
Median number of rooms in houses and condos:
Here:
5.2
State:
6.0
Median number of rooms in apartments:
Here:
5.5
State:
3.9
Notable locations in this zip code not listed on our city pages
Creeks: North Fork Walker Basin Creek (A), Clear Creek (B), Sycamore Creek (C), Hog Creek (D), Studhorse Creek (E), Weaver Creek (F), Flying Dutchman Creek (G), Thompson Creek (H), Tehachapi Creek (I). Display/hide their locations on the map
In group quarters: 3 (-1 institutionalized population)
Size of family households: 156 2-persons, 73 3-persons, 25 4-persons, 8 5-persons
Size of nonfamily households: 155 1-person, 8 2-persons
44 married couples with children.
37 single-parent households (37 women).
95.7% of residents of 93518 zip code speak English at home.
3.3% of residents speak Spanish at home (90% very well, 10% not at all).
1.6% of residents speak other Indo-European language at home (29% very well, 71% well).
0.5% of residents speak Asian or Pacific Island language at home (100% well).
Foreign born population: 29 (3.3%) (89.8% of them are naturalized citizens)
This zip code:
3.3%
Whole state:
26.7%
36%India
18%Croatia
18%Honduras
14%Japan
11%North Macedonia (Macedonia)
25%American
12%English
8%Irish
5%German
3%Danish
3%Scottish
2%Iranian
Year of entry for the foreign-born population
02010 or later
02000 to 2009
01990 to 1999
32Before 1990
Facilities with environmental interests located in this zip code:
CALIENTE ELEMENTARY (27500 CALIENTE BODFISH ROAD in CALIENTE, CA)
(National Center for Education Statistics) - STATE ID-6009286 Organizations: CALIENTE UNION ELEMENTARY (SCHOOL DISTRICT)
H MC ABEE AND SON TRUCKING (9867 CALIENTE CREEK RD in CALIENTE, CA)
TRANSPORTER (Resource Conservation and Recovery Act (tracking hazardous waste)) - notification Organizations: HOWARD JOYCE GARY MC ABEE (CONTACT/OWNER)
Housing units lacking complete plumbing facilities: 7.1% Housing units lacking complete kitchen facilities: 11.3%
47.4%Bottled, tank, or LP gas
29.6%Wood
7.9%Electricity
6.7%No fuel used
3.6%Fuel oil, kerosene, etc.
3.1%Utility gas
1.4%Other fuel
0.7%Solar energy
Population in 1990: 899. Population change in the 1990s: +110 (+12.2%).
Place of birth for U.S.-born residents:
This state: 616
Northeast: 62
Midwest: 106
South: 8
West: 53
67% of the 93518 zip code residents lived in the same house 5 years ago. Out of people who lived in different houses, 58% lived in this county. Out of people who lived in different counties, 50% lived in California.
94% of the 93518 zip code residents lived in the same house 1 year ago. Out of people who lived in different houses, 9% moved from this county. Out of people who lived in different houses, 64% moved from different county within same state. Out of people who lived in different houses, 31% moved from different state.
Private vs. public school enrollment:
Students in private schools in grades 1 to 8 (elementary and middle school):
Here:
0.0%
California:
10.5%
Students in private schools in grades 9 to 12 (high school):
Here:
0.0%
California:
8.5%
Students in private undergraduate colleges: 5
Here:
33.1%
California:
15.9%
Occupation by median earnings in the past 12 months ($)
105,201Architecture and engineering occupations
38,201Education, training, and library occupations
36,537Management occupations
16,458Sales and related occupations
16,246Office and administrative support occupations
Companies with federal contracts located in this zip code:
MOBIUS TRANS METALS INC (10000 CALIENTE CREEK RD in CALIENTE, CA; small business) : $99,090 in 3 contractsfrom 2005 to 2006
$69,930 with Navy for Other Defense -- Operational Systems Development (R&D). Signed on 2005-05-02. Completion date: 2005-11-30.
$29,160, same as above.Signed on 2006-03-27. Completion date: 2006-09-30.
$0, same as above.Signed on 2006-03-27. Completion date: 2006-09-30.
Top industries in this zip code by the number of employees in 2005:
Accommodation and Food Services: Recreational and Vacation Camps (except Campgrounds) (10-19 employees: 1 establishment)
Real Estate and Rental and Leasing: Offices of Real Estate Agents and Brokers (1-4: 1)
Construction: New Single-Family Housing Construction (except Operative Builders) (1-4: 1)
Other Services (except Public Administration): Computer and Office Machine Repair and Maintenance (1-4: 1)
Other Services (except Public Administration): Religious Organizations (1-4: 1)
Finance and Insurance: Claims Adjusting (1-4: 1)
People in group quarters in 2000:
9 people in nursing homes
4 people in other workers' dormitories
Fatal accident statistics in 2013:
Fatal accident count: 1
Vehicles involved in fatal accidents: 1
Fatal accidents caused by drunken drivers: 0
Fatalities: 1
Persons involved in fatal accidents: 1
Pedestrians involved in fatal accidents: 0
Fatal accident statistics in 2012:
Fatal accident count: 1
Vehicles involved in fatal accidents: 1
Fatal accidents caused by drunken drivers: 1
Fatalities: 1
Persons involved in fatal accidents: 2
Pedestrians involved in fatal accidents: 0
Home Mortgage Disclosure Act Aggregated Statistics For Year 2009 (Based on 4 partial tracts)
A) FHA, FSA/RHS & VA Home Purchase Loans
B) Conventional Home Purchase Loans
C) Refinancings
D) Home Improvement Loans
F) Non-occupant Loans on < 5 Family Dwellings (A B C & D)
G) Loans On Manufactured Home Dwelling (A B C & D)
Number
Average Value
Number
Average Value
Number
Average Value
Number
Average Value
Number
Average Value
Number
Average Value
LOANS ORIGINATED
14
$141,744
18
$130,133
55
$142,619
3
$154,060
11
$105,344
25
$126,137
APPLICATIONS APPROVED, NOT ACCEPTED
3
$134,617
3
$189,003
7
$159,690
0
$0
0
$0
4
$133,420
APPLICATIONS DENIED
4
$126,392
8
$112,171
54
$182,280
6
$181,862
7
$184,831
22
$99,774
APPLICATIONS WITHDRAWN
2
$160,370
3
$84,730
15
$141,720
4
$93,605
3
$84,410
8
$104,930
FILES CLOSED FOR INCOMPLETENESS
0
$0
2
$29,185
6
$209,642
3
$25,480
0
$0
5
$75,052
Aggregated Statistics For Year 2008 (Based on 4 partial tracts)
A) FHA, FSA/RHS & VA Home Purchase Loans
B) Conventional Home Purchase Loans
C) Refinancings
D) Home Improvement Loans
F) Non-occupant Loans on < 5 Family Dwellings (A B C & D)
G) Loans On Manufactured Home Dwelling (A B C & D)
Number
Average Value
Number
Average Value
Number
Average Value
Number
Average Value
Number
Average Value
Number
Average Value
LOANS ORIGINATED
13
$168,226
21
$143,699
67
$148,539
9
$105,411
17
$113,392
39
$133,917
APPLICATIONS APPROVED, NOT ACCEPTED
1
$195,460
5
$110,500
22
$159,367
1
$169,600
5
$131,442
9
$133,899
APPLICATIONS DENIED
3
$185,410
12
$145,535
84
$165,463
18
$69,932
10
$131,196
25
$108,477
APPLICATIONS WITHDRAWN
1
$249,160
2
$164,215
36
$154,948
2
$90,715
0
$0
10
$143,851
FILES CLOSED FOR INCOMPLETENESS
0
$0
0
$0
6
$184,610
1
$50,320
1
$193,960
1
$155,920
Aggregated Statistics For Year 2007 (Based on 4 partial tracts)
A) FHA, FSA/RHS & VA Home Purchase Loans
B) Conventional Home Purchase Loans
C) Refinancings
D) Home Improvement Loans
F) Non-occupant Loans on < 5 Family Dwellings (A B C & D)
G) Loans On Manufactured Home Dwelling (A B C & D)
Number
Average Value
Number
Average Value
Number
Average Value
Number
Average Value
Number
Average Value
Number
Average Value
LOANS ORIGINATED
13
$165,978
70
$175,973
127
$156,512
22
$95,971
31
$155,812
79
$138,026
APPLICATIONS APPROVED, NOT ACCEPTED
4
$159,878
17
$167,865
39
$140,842
4
$48,360
10
$152,693
24
$119,405
APPLICATIONS DENIED
1
$146,170
23
$175,757
117
$150,146
29
$88,652
21
$162,649
50
$110,485
APPLICATIONS WITHDRAWN
2
$209,460
23
$152,783
50
$168,917
11
$81,120
4
$97,608
16
$132,427
FILES CLOSED FOR INCOMPLETENESS
0
$0
1
$50,320
11
$167,436
2
$83,940
2
$122,885
2
$64,830
Aggregated Statistics For Year 2006 (Based on 4 partial tracts)
A) FHA, FSA/RHS & VA Home Purchase Loans
B) Conventional Home Purchase Loans
C) Refinancings
D) Home Improvement Loans
F) Non-occupant Loans on < 5 Family Dwellings (A B C & D)
G) Loans On Manufactured Home Dwelling (A B C & D)
Number
Average Value
Number
Average Value
Number
Average Value
Number
Average Value
Number
Average Value
Number
Average Value
LOANS ORIGINATED
12
$155,142
92
$146,525
120
$157,020
27
$101,063
42
$134,344
70
$130,952
APPLICATIONS APPROVED, NOT ACCEPTED
4
$139,312
15
$122,107
24
$176,383
6
$143,567
8
$116,771
9
$88,272
APPLICATIONS DENIED
3
$98,537
44
$166,482
139
$153,686
43
$108,559
19
$136,090
69
$121,912
APPLICATIONS WITHDRAWN
1
$231,600
17
$173,275
89
$164,118
9
$173,777
6
$187,207
18
$138,479
FILES CLOSED FOR INCOMPLETENESS
0
$0
5
$170,142
13
$156,266
4
$66,885
2
$171,025
2
$66,040
Aggregated Statistics For Year 2005 (Based on 4 partial tracts)
A) FHA, FSA/RHS & VA Home Purchase Loans
B) Conventional Home Purchase Loans
C) Refinancings
D) Home Improvement Loans
F) Non-occupant Loans on < 5 Family Dwellings (A B C & D)
G) Loans On Manufactured Home Dwelling (A B C & D)
Number
Average Value
Number
Average Value
Number
Average Value
Number
Average Value
Number
Average Value
Number
Average Value
LOANS ORIGINATED
12
$114,652
110
$135,149
154
$131,338
37
$96,375
38
$133,156
83
$117,402
APPLICATIONS APPROVED, NOT ACCEPTED
1
$203,310
21
$133,506
36
$120,265
4
$86,228
5
$135,174
17
$108,057
APPLICATIONS DENIED
5
$127,452
50
$129,568
151
$125,865
32
$94,427
15
$175,453
62
$103,786
APPLICATIONS WITHDRAWN
3
$182,577
31
$142,737
111
$129,868
18
$113,866
14
$126,685
27
$115,688
FILES CLOSED FOR INCOMPLETENESS
0
$0
9
$153,901
13
$119,734
2
$47,170
2
$121,375
6
$132,485
Aggregated Statistics For Year 2004 (Based on 4 partial tracts)
A) FHA, FSA/RHS & VA Home Purchase Loans
B) Conventional Home Purchase Loans
C) Refinancings
D) Home Improvement Loans
E) Loans on Dwellings For 5+ Families
F) Non-occupant Loans on < 5 Family Dwellings (A B C & D)
G) Loans On Manufactured Home Dwelling (A B C & D)
Number
Average Value
Number
Average Value
Number
Average Value
Number
Average Value
Number
Average Value
Number
Average Value
Number
Average Value
LOANS ORIGINATED
6
$120,408
119
$103,436
143
$104,493
19
$63,654
1
$1,019,490
55
$91,409
71
$97,634
APPLICATIONS APPROVED, NOT ACCEPTED
0
$0
21
$109,091
31
$107,232
6
$52,027
0
$0
5
$100,210
17
$98,333
APPLICATIONS DENIED
0
$0
47
$114,811
131
$96,519
24
$53,803
0
$0
11
$105,766
48
$89,726
APPLICATIONS WITHDRAWN
2
$125,440
23
$89,358
64
$99,417
9
$73,541
0
$0
5
$117,774
16
$88,213
FILES CLOSED FOR INCOMPLETENESS
0
$0
4
$170,030
14
$98,745
2
$26,875
0
$0
1
$128,340
3
$124,583
Aggregated Statistics For Year 2003 (Based on 4 partial tracts)
A) FHA, FSA/RHS & VA Home Purchase Loans
B) Conventional Home Purchase Loans
C) Refinancings
D) Home Improvement Loans
F) Non-occupant Loans on < 5 Family Dwellings (A B C & D)
Number
Average Value
Number
Average Value
Number
Average Value
Number
Average Value
Number
Average Value
LOANS ORIGINATED
13
$101,418
97
$82,133
191
$92,715
5
$29,328
42
$75,455
APPLICATIONS APPROVED, NOT ACCEPTED
2
$102,170
14
$99,254
25
$97,560
2
$54,430
5
$95,534
APPLICATIONS DENIED
2
$117,055
31
$91,670
116
$92,852
13
$26,594
14
$78,939
APPLICATIONS WITHDRAWN
1
$122,060
14
$96,164
61
$99,571
0
$0
8
$87,809
FILES CLOSED FOR INCOMPLETENESS
0
$0
4
$106,270
9
$96,416
1
$59,990
0
$0
Aggregated Statistics For Year 2002 (Based on 2 partial tracts)
A) FHA, FSA/RHS & VA Home Purchase Loans
B) Conventional Home Purchase Loans
C) Refinancings
D) Home Improvement Loans
F) Non-occupant Loans on < 5 Family Dwellings (A B C & D)
Number
Average Value
Number
Average Value
Number
Average Value
Number
Average Value
Number
Average Value
LOANS ORIGINATED
10
$75,618
59
$68,322
74
$74,897
7
$24,811
23
$64,493
APPLICATIONS APPROVED, NOT ACCEPTED
1
$48,380
5
$63,378
8
$74,384
0
$0
3
$74,507
APPLICATIONS DENIED
0
$0
18
$61,711
47
$78,633
6
$31,125
5
$75,860
APPLICATIONS WITHDRAWN
2
$77,650
7
$96,899
20
$73,223
0
$0
1
$124,820
FILES CLOSED FOR INCOMPLETENESS
0
$0
1
$59,020
4
$86,358
0
$0
0
$0
Aggregated Statistics For Year 2001 (Based on 2 partial tracts)
A) FHA, FSA/RHS & VA Home Purchase Loans
B) Conventional Home Purchase Loans
C) Refinancings
D) Home Improvement Loans
F) Non-occupant Loans on < 5 Family Dwellings (A B C & D)
Number
Average Value
Number
Average Value
Number
Average Value
Number
Average Value
Number
Average Value
LOANS ORIGINATED
5
$68,120
39
$68,576
69
$73,713
6
$21,772
10
$57,040
APPLICATIONS APPROVED, NOT ACCEPTED
0
$0
1
$62,890
10
$85,294
0
$0
1
$58,060
APPLICATIONS DENIED
0
$0
15
$65,345
42
$59,415
9
$47,950
5
$65,796
APPLICATIONS WITHDRAWN
1
$88,050
4
$65,435
24
$75,936
1
$40,640
1
$40,640
FILES CLOSED FOR INCOMPLETENESS
0
$0
0
$0
2
$91,920
0
$0
0
$0
Aggregated Statistics For Year 2000 (Based on 2 partial tracts)
A) FHA, FSA/RHS & VA Home Purchase Loans
B) Conventional Home Purchase Loans
C) Refinancings
D) Home Improvement Loans
F) Non-occupant Loans on < 5 Family Dwellings (A B C & D)
Number
Average Value
Number
Average Value
Number
Average Value
Number
Average Value
Number
Average Value
LOANS ORIGINATED
7
$71,050
35
$64,415
26
$64,587
4
$29,752
9
$44,402
APPLICATIONS APPROVED, NOT ACCEPTED
0
$0
3
$72,730
5
$52,540
1
$55,640
1
$72,570
APPLICATIONS DENIED
0
$0
14
$52,354
35
$51,393
7
$18,869
3
$58,540
APPLICATIONS WITHDRAWN
2
$76,440
8
$55,214
22
$50,733
2
$32,175
1
$52,250
FILES CLOSED FOR INCOMPLETENESS
0
$0
1
$264,150
2
$77,650
0
$0
0
$0
Aggregated Statistics For Year 1999 (Based on 2 partial tracts)
A) FHA, FSA/RHS & VA Home Purchase Loans
B) Conventional Home Purchase Loans
C) Refinancings
D) Home Improvement Loans
F) Non-occupant Loans on < 5 Family Dwellings (A B C & D)
Detailed PMIC statistics for the following Tracts:0052.02
, 0060.04
2005 - 2018 National Fire Incident Reporting System (NFIRS) incidents
According to the data from the years 2005 - 2018 the average number of fires per year is 12. The highest number of fire incidents - 29 took place in 2006, and the least - 0 in 2010. The data has a growing trend.
When looking into fire subcategories, the most incidents belonged to: Outside Fires (62.0%), and Mobile Property/Vehicle Fires (25.3%).
Fire incident types reported to NFIRS in Zip Code 93518


 Nearest zip codes: 93205, 93531, 93240, 93220, 93561, 93283.


 According to the data from the years 2005 - 2018 the average number of fires per year is 12. The highest number of fire incidents - 29 took place in 2006, and the least - 0 in 2010. The data has a growing trend.
 When looking into fire subcategories, the most incidents belonged to: Outside Fires (62.0%), and Mobile Property/Vehicle Fires (25.3%).