Estimated zip code population in 2022: 1,126 Zip code population in 2010: 2,138 Zip code population in 2000: 1,600
Houses and condos: 665 Renter-occupied apartments: 62
% of renters here:
11%
State:
44%
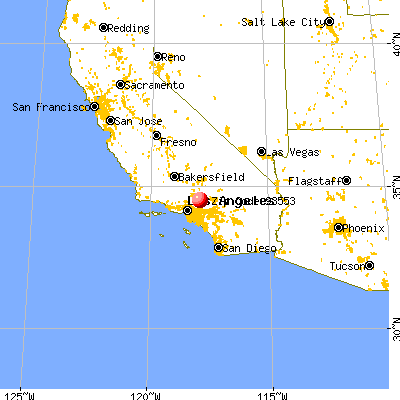
March 2022 cost of living index in zip code 93553: 115.6 (more than average, U.S. average is 100)
Land area: 86.5 sq. mi. Water area: 0.1 sq. mi.
Population density: 13 people per square mile
(very low).
OSM Map
General Map
Google Map
MSN Map
OSM Map
General Map
Google Map
MSN Map
OSM Map
General Map
Google Map
MSN Map
OSM Map
General Map
Google Map
MSN Map
Please wait while loading the map...
Real estate property taxes paid for housing units in 2022:
This zip code:
0.6% ($2,630)
California:
0.7% ($4,831)
Median real estate property taxes paid for housing units with mortgages in 2022: $2,949 (0.6%) Median real estate property taxes paid for housing units with no mortgage in 2022: $2,274 (0.9%)
Averages for the 2020 tax year for zip code 93553, filed in 2021:
Average Adjusted Gross Income (AGI) in 2020: $59,004 (Individual Income Tax Returns)
Here:
$59,004
State:
$95,910
Salary/wage: $54,802 (reported on 70.5% of returns)
Here:
$54,802
State:
$77,331
(% of AGI for various income ranges: 847.4% for AGIs below $25k, 3245.7% for AGIs $25k-50k, 5188.9% for AGIs $50k-75k, 9630.0% for AGIs $75k-100k, 16113.3% for AGIs $100k-200k)
Taxable interest for individuals: $517 (reported on 37.2% of returns)
This zip code:
$517
California:
$2,294
(% of AGI for various income ranges: 13.2% for AGIs below $25k, 7.1% for AGIs $25k-50k, 13.3% for AGIs $50k-75k, 44.0% for AGIs $75k-100k, 90.0% for AGIs $100k-200k)
Ordinary dividends: $2,500 (reported on 11.5% of returns)
Here:
$2,500
State:
$10,949
(% of AGI for various income ranges: 15.8% for AGIs below $25k, 15.0% for AGIs $25k-50k, 193.3% for AGIs $100k-200k)
Net capital gain/loss in AGI: +$6,711 (reported on 11.5% of returns)
Here:
+$6,711
State:
+$49,306
(% of AGI for various income ranges: 11.6% for AGIs below $25k, 75.7% for AGIs $25k-50k, 528.9% for AGIs $100k-200k)
Profit/loss from business: +$9,500 (reported on 19.2% of returns)
Here:
+$9,500
State:
+$15,671
(% of AGI for various income ranges: 285.8% for AGIs below $25k, 461.4% for AGIs $25k-50k, 472.0% for AGIs $75k-100k)
Taxable individual retirement arrangement distribution: $17,200 (reported on 5.1% of returns)
93553:
$17,200
California:
$23,505
(% of AGI for various income ranges: 134.7% for AGIs below $25k, 864.0% for AGIs $75k-100k)
Total itemized deductions: $30,225 (reported on 10.3% of returns)
Here:
$30,225
State:
$39,517
(% of AGI for various income ranges: 1273.3% for AGIs $50k-75k, 1413.3% for AGIs $100k-200k)
Charity contributions: $4,583 (reported on 7.7% of returns)
Here:
$4,583
State:
$12,598
(% of AGI for various income ranges: 80.0% for AGIs $50k-75k, 225.6% for AGIs $100k-200k)
Taxes paid: $7,875 (reported on 10.3% of returns)
93553:
$7,875
State:
$8,807
(% of AGI for various income ranges: 302.2% for AGIs $50k-75k, 397.8% for AGIs $100k-200k)
Earned income credit: $2,525 (reported on 20.5% of returns)
Here:
$2,525
State:
$2,074
(% of AGI for various income ranges: 158.4% for AGIs below $25k, 73.6% for AGIs $25k-50k)
Percentage of individuals using paid preparers for their 2020 taxes: 92.3%
Here:
92%
State:
92%
(% for various income ranges: 92.6% for AGIs below $25k, 94.4% for AGIs $25k-50k, 90.9% for AGIs $50k-75k, 87.5% for AGIs $75k-100k, 92.9% for AGIs $100k-200k)
Averages for the 2012 tax year for zip code 93553, filed in 2013:
Average Adjusted Gross Income (AGI) in 2012: $48,575 (Individual Income Tax Returns)
Here:
$48,575
State:
$72,726
Salary/wage: $47,977 (reported on 74.0% of returns)
Here:
$47,977
State:
$59,079
(% of AGI for various income ranges: 57.2% for AGIs below $25k, 69.7% for AGIs $25k-50k, 69.6% for AGIs $50k-75k, 79.1% for AGIs $75k-100k, 77.8% for AGIs $100k-200k)
Taxable interest for individuals: $361 (reported on 40.3% of returns)
This zip code:
$361
California:
$2,146
(% of AGI for various income ranges: 0.6% for AGIs below $25k, 0.3% for AGIs $25k-50k, 0.3% for AGIs $50k-75k, 0.2% for AGIs $75k-100k, 0.3% for AGIs $100k-200k)
Ordinary dividends: $2,210 (reported on 13.0% of returns)
Here:
$2,210
State:
$9,308
(% of AGI for various income ranges: 3.0% for AGIs below $25k, 0.8% for AGIs $50k-75k, 0.5% for AGIs $100k-200k)
Net capital gain/loss in AGI: +$500 (reported on 10.4% of returns)
Here:
+$500
State:
+$30,460
Profit/loss from business: +$9,314 (reported on 18.2% of returns)
Here:
+$9,314
State:
+$17,064
(% of AGI for various income ranges: 15.4% for AGIs below $25k, 6.4% for AGIs $25k-50k, 4.2% for AGIs $75k-100k)
Taxable individual retirement arrangement distribution: $11,143 (reported on 9.1% of returns)
93553:
$11,143
California:
$19,557
Total itemized deductions: $21,610 (27% of AGI, reported on 39.0% of returns)
Here:
$21,610
State:
$34,004
Here:
27.5% of AGI
State:
22.7% of AGI
(% of AGI for various income ranges: 10.4% for AGIs below $25k, 17.9% for AGIs $25k-50k, 19.0% for AGIs $50k-75k, 19.6% for AGIs $75k-100k, 17.0% for AGIs $100k-200k)
Charity contributions: $2,475 (reported on 31.2% of returns)
Here:
$2,475
State:
$4,659
(% of AGI for various income ranges: 1.4% for AGIs $25k-50k, 2.0% for AGIs $50k-75k, 2.1% for AGIs $75k-100k, 1.7% for AGIs $100k-200k)
Taxes paid: $6,307 (reported on 39.0% of returns)
93553:
$6,307
State:
$14,448
(% of AGI for various income ranges: 2.1% for AGIs below $25k, 3.3% for AGIs $25k-50k, 4.4% for AGIs $50k-75k, 5.5% for AGIs $75k-100k, 6.8% for AGIs $100k-200k)
Earned income credit: $2,140 (reported on 19.5% of returns)
Here:
$2,140
State:
$2,286
(% of AGI for various income ranges: 7.7% for AGIs below $25k, 0.6% for AGIs $25k-50k)
Percentage of individuals using paid preparers for their 2012 taxes: 68.8%
Here:
69%
State:
64%
(% for various income ranges: 63.3% for AGIs below $25k, 73.7% for AGIs $25k-50k, 70.0% for AGIs $50k-75k, 75.0% for AGIs $75k-100k, 70.0% for AGIs $100k-200k)
Averages for the 2004 tax year for zip code 93553, filed in 2005:
Average Adjusted Gross Income (AGI) in 2004: $42,526 (Individual Income Tax Returns)
Here:
$42,526
State:
$58,600
Salary/wage: $40,618 (reported on 77.8% of returns)
Here:
$40,618
State:
$49,455
(% of AGI for various income ranges: 125.4% for AGIs below $10k, 65.4% for AGIs $10k-25k, 72.1% for AGIs $25k-50k, 81.2% for AGIs $50k-75k, 81.8% for AGIs $75k-100k, 67.5% for AGIs over 100k)
Taxable interest for individuals: $812 (reported on 46.0% of returns)
This zip code:
$812
California:
$2,365
(% of AGI for various income ranges: 3.2% for AGIs below $10k, 1.9% for AGIs $10k-25k, 1.3% for AGIs $25k-50k, 0.4% for AGIs $50k-75k, 0.5% for AGIs $75k-100k, 0.7% for AGIs over 100k)
Taxable dividends: $1,228 (reported on 21.0% of returns)
Here:
$1,228
State:
$4,746
(% of AGI for various income ranges: 1.5% for AGIs below $10k, 1.1% for AGIs $10k-25k, 1.1% for AGIs $25k-50k, 0.2% for AGIs $50k-75k, 0.2% for AGIs $75k-100k, 0.5% for AGIs over 100k)
Net capital gain/loss: +$10,531 (reported on 16.3% of returns)
Here:
+$10,531
State:
+$23,418
(% of AGI for various income ranges: 0.7% for AGIs $10k-25k, 1.6% for AGIs $25k-50k, -0.3% for AGIs $50k-75k, 2.6% for AGIs $75k-100k, 10.7% for AGIs over 100k)
Profit/loss from business: +$7,910 (reported on 19.6% of returns)
Here:
+$7,910
State:
+$16,826
(% of AGI for various income ranges: 1.3% for AGIs below $10k, 10.0% for AGIs $10k-25k, 2.8% for AGIs $25k-50k, 5.8% for AGIs $50k-75k, 1.8% for AGIs $75k-100k, 1.7% for AGIs over 100k)
IRA payment deduction: $2,188 (reported on 2.0% of returns)
93553:
$2,188
California:
$3,192
Total itemized deductions: $18,257 (26% of AGI, reported on 43.4% of returns)
Here:
$18,257
State:
$28,113
Here:
26.1% of AGI
State:
25.3% of AGI
(% of AGI for various income ranges: 15.8% for AGIs $10k-25k, 19.2% for AGIs $25k-50k, 20.0% for AGIs $50k-75k, 22.4% for AGIs $75k-100k, 17.1% for AGIs over 100k)
Charity contributions deductions: $2,727 (4% of AGI, reported on 39.5% of returns)
Here:
$2,727
State:
$3,923
Here:
3.8% of AGI
State:
3.3% of AGI
(% of AGI for various income ranges: 2.2% for AGIs $10k-25k, 2.1% for AGIs $25k-50k, 2.6% for AGIs $50k-75k, 3.3% for AGIs $75k-100k, 2.6% for AGIs over 100k)
Total tax: $5,361 (reported on 76.8% of returns)
93553:
$5,361
State:
$10,761
(% of AGI for various income ranges: 7.3% for AGIs below $10k, 4.8% for AGIs $10k-25k, 6.6% for AGIs $25k-50k, 8.4% for AGIs $50k-75k, 9.5% for AGIs $75k-100k, 14.4% for AGIs over 100k)
Earned income credit: $1,872 (reported on 18.6% of returns)
Here:
$1,872
State:
$1,763
Percentage of individuals using paid preparers for their 2004 taxes: 71.0%
Here:
71%
State:
66%
(% for various income ranges: 58.6% for AGIs below $10k, 68.2% for AGIs $10k-25k, 79.7% for AGIs $25k-50k, 72.5% for AGIs $50k-75k, 70.5% for AGIs $75k-100k, 80.0% for AGIs over 100k)
Household received Food Stamps/SNAP in the past 12 months: 11 Household did not receive Food Stamps/SNAP in the past 12 months: 544
Women who had a birth in the past 12 months: 9 (9 now married, 0 unmarried) Women who did not have a birth in the past 12 months: 115 (52 now married, 62 unmarried)
Housing units in zip code 93553 with a mortgage: 281 (48 second mortgage) Median monthly owner costs for units with a mortgage: $2,156 Median monthly owner costs for units without a mortgage: $527
Residents with income below the poverty level in 2022:
This zip code:
18.5%
Whole state:
12.2%
Residents with income below 50% of the poverty level in 2022:
This zip code:
6.3%
Whole state:
6.2%
Median number of rooms in houses and condos:
Here:
5.2
State:
6.0
Median number of rooms in apartments:
Here:
1.5
State:
3.9
Notable locations in this zip code not listed on our city pages
Notable locations in zip code 93553: Horse Flats Campground (A), McFarland Ranch (B), Camp Hidden Valley (C), Pasadena Camp (D), Conservation Camp Thirtyseven (E), Valyermo Ranch (F), Eagles Roost Picnic Ground (G), Kratka Ridge Ski Area (H), Mount Waterman Ski Area (I), Cooper Canyon Trail Camp (J), Burkhart Ranch (K), Cobbleita Ranch (L), East Ranch (M), Little Cedars Campground (N), Islip Trailhead (O), Camp Valcrest (P), Camp Singing Pines (Q), Camp Pajarito (R), Camp Glenwood (S), Camp Cumorah Crest (T). Display/hide their locations on the map
Churches in zip code 93553 include: Foursquare Church of Pearblossom (A), Pearblossom Community Methodist Church (B), Saint Andrews Abbey (C). Display/hide their locations on the map
Parks in zip code 93553 include: Pine Hollow Picnic Area (1), Ridge Crest Picnic Ground (2), Vista Picnic Ground (3), Pearblossom Park (4), Devils Punchbowl County Park (5). Display/hide their locations on the map
In group quarters: 21 (-1 institutionalized population)
Size of family households: 363 2-persons, 23 3-persons, 25 4-persons, 10 5-persons
Size of nonfamily households: 123 1-person, 28 2-persons
60 married couples with children.
15 single-parent households (15 men).
82.5% of residents of 93553 zip code speak English at home.
9.6% of residents speak Spanish at home (68% very well, 25% well, 8% not well).
8.9% of residents speak other Indo-European language at home (91% very well, 9% not well).
Foreign born population: 130 (11.6%) (80.3% of them are naturalized citizens)
This zip code:
11.6%
Whole state:
26.7%
27%Honduras
18%Ecuador
15%Bhutan
12%Sweden
7%United Kingdom, excluding England and Scotland
7%France
6%Germany
10%English
8%German
5%Arab
4%Swedish
3%Scotch-Irish
2%American
1%European
Year of entry for the foreign-born population
212010 or later
82000 to 2009
21990 to 1999
109Before 1990
Public elementary/middle school in in zip code 93553 not listed on the city page:
Housing units lacking complete plumbing facilities: 8.2% Housing units lacking complete kitchen facilities: 9.1%
39.7%Electricity
33.3%Bottled, tank, or LP gas
12.2%Utility gas
7.2%Other fuel
6.3%Wood
1.8%Fuel oil, kerosene, etc.
Population in 1990: 1,106. Population change in the 1990s: +494 (+44.7%).
Place of birth for U.S.-born residents:
This state: 800
Northeast: 28
Midwest: 30
South: 51
West: 67
44% of the 93553 zip code residents lived in the same house 5 years ago. Out of people who lived in different houses, 83% lived in this county. Out of people who lived in different counties, 50% lived in California.
95% of the 93553 zip code residents lived in the same house 1 year ago. Out of people who lived in different houses, 100% moved from this county.
Private vs. public school enrollment:
Students in private schools in grades 1 to 8 (elementary and middle school):
Here:
0.0%
California:
10.5%
Students in private schools in grades 9 to 12 (high school): 8
Here:
47.3%
California:
8.5%
Students in private undergraduate colleges:
Here:
0.0%
California:
15.9%
Occupation by median earnings in the past 12 months ($)
66,088Education, training, and library occupations
61,832Construction and extraction occupations
56,330Office and administrative support occupations
Top industries in this zip code by the number of employees in 2005:
Health Care and Social Assistance: Vocational Rehabilitation Services (20-49 employees: 1 establishment)
Educational Services: Exam Preparation and Tutoring (10-19: 1)
Finance and Insurance: Direct Title Insurance Carriers (5-9: 1)
Administrative and Support and Waste Management and Remediation Services: Janitorial Services (5-9: 1)
Other Services (except Public Administration): General Automotive Repair (5-9: 1)
Other Services (except Public Administration): Computer and Office Machine Repair and Maintenance (5-9: 1)
Real Estate and Rental and Leasing: Offices of Real Estate Appraisers (1-4: 1)
People in group quarters in 2010:
3 people in other noninstitutional facilities
People in group quarters in 2000:
20 people in religious group quarters
Fatal accident statistics in 2014:
Fatal accident count: 1
Vehicles involved in fatal accidents: 1
Fatal accidents caused by drunken drivers: 0
Fatalities: 1
Persons involved in fatal accidents: 1
Pedestrians involved in fatal accidents: 1
Fatal accident statistics in 2013:
Fatal accident count: 1
Vehicles involved in fatal accidents: 1
Fatal accidents caused by drunken drivers: 0
Fatalities: 1
Persons involved in fatal accidents: 1
Pedestrians involved in fatal accidents: 0
Home Mortgage Disclosure Act Aggregated Statistics For Year 2009 (Based on 8 partial tracts)
A) FHA, FSA/RHS & VA Home Purchase Loans
B) Conventional Home Purchase Loans
C) Refinancings
D) Home Improvement Loans
F) Non-occupant Loans on < 5 Family Dwellings (A B C & D)
G) Loans On Manufactured Home Dwelling (A B C & D)
Number
Average Value
Number
Average Value
Number
Average Value
Number
Average Value
Number
Average Value
Number
Average Value
LOANS ORIGINATED
9
$139,814
10
$159,831
26
$169,444
2
$35,435
5
$131,186
5
$157,464
APPLICATIONS APPROVED, NOT ACCEPTED
1
$275,330
1
$76,560
8
$172,444
0
$0
0
$0
1
$174,650
APPLICATIONS DENIED
2
$84,460
3
$150,240
33
$196,776
2
$163,600
3
$130,080
3
$120,157
APPLICATIONS WITHDRAWN
2
$73,450
1
$190,280
19
$208,496
0
$0
1
$198,570
2
$214,395
FILES CLOSED FOR INCOMPLETENESS
1
$153,110
0
$0
2
$285,890
0
$0
0
$0
0
$0
Aggregated Statistics For Year 2008 (Based on 8 partial tracts)
A) FHA, FSA/RHS & VA Home Purchase Loans
B) Conventional Home Purchase Loans
C) Refinancings
D) Home Improvement Loans
F) Non-occupant Loans on < 5 Family Dwellings (A B C & D)
G) Loans On Manufactured Home Dwelling (A B C & D)
Number
Average Value
Number
Average Value
Number
Average Value
Number
Average Value
Number
Average Value
Number
Average Value
LOANS ORIGINATED
10
$223,312
12
$192,842
31
$159,580
8
$163,928
12
$146,312
3
$271,053
APPLICATIONS APPROVED, NOT ACCEPTED
2
$239,240
2
$260,030
9
$247,926
1
$177,110
2
$169,975
1
$125,900
APPLICATIONS DENIED
2
$312,805
4
$250,078
42
$242,910
5
$149,204
8
$172,536
4
$183,052
APPLICATIONS WITHDRAWN
0
$0
1
$215,320
19
$221,924
1
$179,430
1
$298,570
3
$179,800
FILES CLOSED FOR INCOMPLETENESS
0
$0
1
$172,480
7
$293,960
0
$0
2
$220,135
0
$0
Aggregated Statistics For Year 2007 (Based on 8 partial tracts)
A) FHA, FSA/RHS & VA Home Purchase Loans
B) Conventional Home Purchase Loans
C) Refinancings
D) Home Improvement Loans
E) Loans on Dwellings For 5+ Families
F) Non-occupant Loans on < 5 Family Dwellings (A B C & D)
G) Loans On Manufactured Home Dwelling (A B C & D)
Number
Average Value
Number
Average Value
Number
Average Value
Number
Average Value
Number
Average Value
Number
Average Value
Number
Average Value
LOANS ORIGINATED
3
$251,647
36
$214,808
77
$213,674
15
$146,523
1
$299,050
8
$184,705
18
$210,705
APPLICATIONS APPROVED, NOT ACCEPTED
0
$0
7
$207,979
15
$263,545
1
$140,070
0
$0
1
$374,360
3
$183,617
APPLICATIONS DENIED
0
$0
32
$261,006
77
$289,859
8
$110,538
1
$344,510
13
$245,683
4
$148,505
APPLICATIONS WITHDRAWN
0
$0
4
$340,712
37
$255,479
4
$225,432
0
$0
1
$281,140
1
$185,930
FILES CLOSED FOR INCOMPLETENESS
0
$0
8
$235,184
13
$236,763
0
$0
0
$0
5
$256,050
0
$0
Aggregated Statistics For Year 2006 (Based on 8 partial tracts)
A) FHA, FSA/RHS & VA Home Purchase Loans
B) Conventional Home Purchase Loans
C) Refinancings
D) Home Improvement Loans
F) Non-occupant Loans on < 5 Family Dwellings (A B C & D)
G) Loans On Manufactured Home Dwelling (A B C & D)
Number
Average Value
Number
Average Value
Number
Average Value
Number
Average Value
Number
Average Value
Number
Average Value
LOANS ORIGINATED
3
$255,580
82
$208,296
119
$222,082
18
$168,745
11
$178,406
11
$189,410
APPLICATIONS APPROVED, NOT ACCEPTED
0
$0
17
$184,235
22
$248,605
2
$146,875
2
$130,730
0
$0
APPLICATIONS DENIED
0
$0
43
$238,798
84
$240,393
22
$200,406
8
$182,864
7
$208,790
APPLICATIONS WITHDRAWN
1
$253,590
24
$209,752
71
$237,769
7
$165,297
5
$205,904
1
$332,610
FILES CLOSED FOR INCOMPLETENESS
0
$0
3
$96,387
13
$173,259
0
$0
3
$136,850
0
$0
Aggregated Statistics For Year 2005 (Based on 8 partial tracts)
B) Conventional Home Purchase Loans
C) Refinancings
D) Home Improvement Loans
F) Non-occupant Loans on < 5 Family Dwellings (A B C & D)
G) Loans On Manufactured Home Dwelling (A B C & D)
Number
Average Value
Number
Average Value
Number
Average Value
Number
Average Value
Number
Average Value
LOANS ORIGINATED
75
$191,911
116
$191,496
27
$83,177
9
$175,244
13
$165,483
APPLICATIONS APPROVED, NOT ACCEPTED
13
$180,328
19
$221,919
5
$103,460
2
$159,270
2
$126,325
APPLICATIONS DENIED
25
$186,454
77
$201,588
13
$168,517
7
$199,940
6
$212,635
APPLICATIONS WITHDRAWN
20
$209,387
59
$200,113
7
$186,109
4
$146,332
2
$248,280
FILES CLOSED FOR INCOMPLETENESS
4
$184,228
9
$189,346
0
$0
0
$0
0
$0
Aggregated Statistics For Year 2004 (Based on 8 partial tracts)
A) FHA, FSA/RHS & VA Home Purchase Loans
B) Conventional Home Purchase Loans
C) Refinancings
D) Home Improvement Loans
F) Non-occupant Loans on < 5 Family Dwellings (A B C & D)
G) Loans On Manufactured Home Dwelling (A B C & D)
Number
Average Value
Number
Average Value
Number
Average Value
Number
Average Value
Number
Average Value
Number
Average Value
LOANS ORIGINATED
5
$153,644
76
$157,883
137
$149,718
14
$92,715
13
$152,058
7
$132,536
APPLICATIONS APPROVED, NOT ACCEPTED
0
$0
11
$186,693
28
$160,505
5
$70,980
1
$190,840
1
$107,840
APPLICATIONS DENIED
0
$0
23
$189,446
64
$164,879
18
$37,831
3
$106,313
6
$174,917
APPLICATIONS WITHDRAWN
0
$0
12
$152,713
54
$147,894
8
$73,990
3
$114,650
2
$118,790
FILES CLOSED FOR INCOMPLETENESS
0
$0
1
$249,620
14
$160,991
1
$40,550
0
$0
1
$107,670
Aggregated Statistics For Year 2003 (Based on 8 partial tracts)
A) FHA, FSA/RHS & VA Home Purchase Loans
B) Conventional Home Purchase Loans
C) Refinancings
D) Home Improvement Loans
F) Non-occupant Loans on < 5 Family Dwellings (A B C & D)
Number
Average Value
Number
Average Value
Number
Average Value
Number
Average Value
Number
Average Value
LOANS ORIGINATED
13
$140,391
50
$128,312
151
$124,654
8
$26,188
10
$117,171
APPLICATIONS APPROVED, NOT ACCEPTED
0
$0
10
$150,777
27
$175,279
6
$35,135
4
$183,230
APPLICATIONS DENIED
3
$150,790
19
$154,292
84
$118,174
6
$22,485
8
$185,066
APPLICATIONS WITHDRAWN
0
$0
17
$148,321
37
$134,601
4
$105,560
4
$159,342
FILES CLOSED FOR INCOMPLETENESS
2
$101,735
1
$97,680
7
$117,710
0
$0
0
$0
Aggregated Statistics For Year 2002 (Based on 2 partial tracts)
A) FHA, FSA/RHS & VA Home Purchase Loans
B) Conventional Home Purchase Loans
C) Refinancings
D) Home Improvement Loans
F) Non-occupant Loans on < 5 Family Dwellings (A B C & D)
Number
Average Value
Number
Average Value
Number
Average Value
Number
Average Value
Number
Average Value
LOANS ORIGINATED
1
$149,590
6
$124,612
10
$112,793
0
$0
2
$144,370
APPLICATIONS APPROVED, NOT ACCEPTED
0
$0
0
$0
2
$127,915
0
$0
1
$46,290
APPLICATIONS DENIED
0
$0
1
$73,320
6
$112,525
1
$7,760
0
$0
APPLICATIONS WITHDRAWN
0
$0
0
$0
6
$127,512
0
$0
0
$0
FILES CLOSED FOR INCOMPLETENESS
0
$0
0
$0
1
$100,620
0
$0
0
$0
Aggregated Statistics For Year 2001 (Based on 2 partial tracts)
A) FHA, FSA/RHS & VA Home Purchase Loans
B) Conventional Home Purchase Loans
C) Refinancings
D) Home Improvement Loans
F) Non-occupant Loans on < 5 Family Dwellings (A B C & D)
Number
Average Value
Number
Average Value
Number
Average Value
Number
Average Value
Number
Average Value
LOANS ORIGINATED
2
$99,010
3
$104,097
6
$110,697
1
$75,730
1
$88,040
APPLICATIONS APPROVED, NOT ACCEPTED
0
$0
0
$0
2
$94,595
0
$0
0
$0
APPLICATIONS DENIED
0
$0
1
$62,620
4
$89,645
1
$61,550
1
$38,530
APPLICATIONS WITHDRAWN
0
$0
1
$51,110
2
$74,525
0
$0
0
$0
FILES CLOSED FOR INCOMPLETENESS
0
$0
0
$0
1
$75,730
0
$0
0
$0
Aggregated Statistics For Year 2000 (Based on 2 partial tracts)
A) FHA, FSA/RHS & VA Home Purchase Loans
B) Conventional Home Purchase Loans
C) Refinancings
D) Home Improvement Loans
F) Non-occupant Loans on < 5 Family Dwellings (A B C & D)
Number
Average Value
Number
Average Value
Number
Average Value
Number
Average Value
Number
Average Value
LOANS ORIGINATED
1
$213,280
4
$115,135
3
$108,823
1
$35,860
1
$50,840
APPLICATIONS APPROVED, NOT ACCEPTED
0
$0
1
$66,360
2
$87,370
0
$0
1
$26,760
APPLICATIONS DENIED
0
$0
1
$51,650
4
$103,360
1
$18,730
1
$37,460
APPLICATIONS WITHDRAWN
0
$0
1
$73,590
2
$100,350
0
$0
1
$34,520
FILES CLOSED FOR INCOMPLETENESS
0
$0
1
$93,390
0
$0
0
$0
0
$0
Aggregated Statistics For Year 1999 (Based on 3 partial tracts)
A) FHA, FSA/RHS & VA Home Purchase Loans
B) Conventional Home Purchase Loans
C) Refinancings
D) Home Improvement Loans
F) Non-occupant Loans on < 5 Family Dwellings (A B C & D)


 Nearest zip codes: 93543, 91702, 93563, 93544, 93552, 93591.


 (Students: 255, Location: 12828 E. AVE. W, Grades: KG-8)


