Estimated zip code population in 2022: 1,851 Zip code population in 2010: 1,818 Zip code population in 2000: 1,988
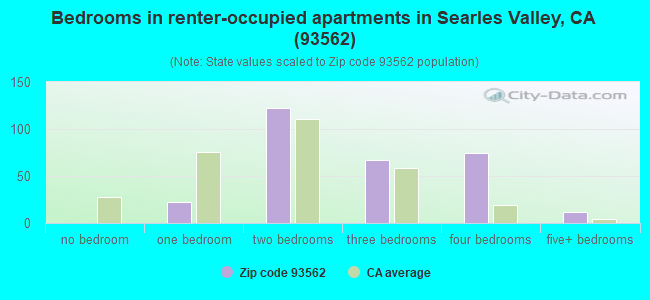
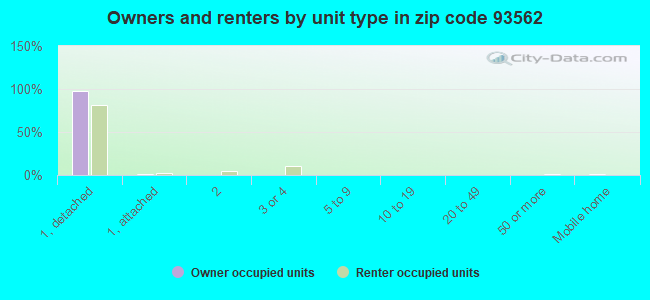
Houses and condos: 1,013 Renter-occupied apartments: 295
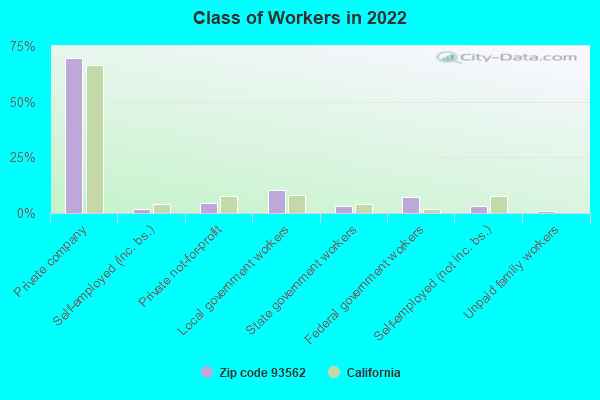
% of renters here:
39%
State:
44%
March 2022 cost of living index in zip code 93562: 71.2 (very low, U.S. average is 100)
Land area: 39.5 sq. mi. Water area: 0.2 sq. mi.
Population density: 47 people per square mile
(very low).
OSM Map
General Map
Google Map
MSN Map
OSM Map
General Map
Google Map
MSN Map
OSM Map
General Map
Google Map
MSN Map
OSM Map
General Map
Google Map
MSN Map
Please wait while loading the map...
Real estate property taxes paid for housing units in 2022:
This zip code:
0.9% ($706)
California:
0.7% ($4,831)
Median real estate property taxes paid for housing units with mortgages in 2022: $856 (0.8%) Median real estate property taxes paid for housing units with no mortgage in 2022: $696 (1.1%)
Business Search- 14 Million verified businesses
Males: 1,047
(56.6%)
Females: 803
(43.4%)
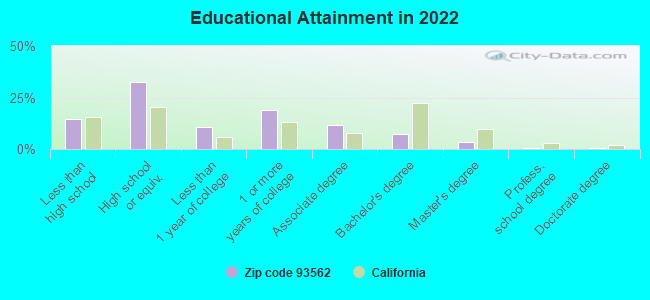
For population 25 years and over in 93562:
High school or higher: 83.9%
Bachelor's degree or higher: 11.5%
Graduate or professional degree: 4.4%
Unemployed: 6.8%
Mean travel time to work (commute): 16.7 minutes
For population 15 years and over in 93562:
Never married: 30.2%
Now married: 56.9%
Separated: 2.3%
Widowed: 4.6%
Divorced: 5.9%
Zip code 93562 compared to state average:
Median household income below state average.
Median house value significantly below state average.
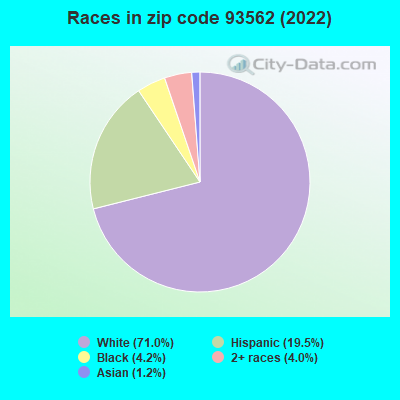
Hispanic race population percentage below state average.
Foreign-born population percentage significantly below state average.
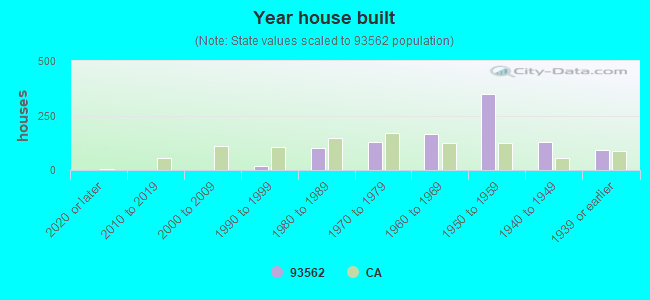
House age above state average.
Percentage of population with a bachelor's degree or higher significantly below state average.
Averages for the 2020 tax year for zip code 93562, filed in 2021:
Average Adjusted Gross Income (AGI) in 2020: $45,685 (Individual Income Tax Returns)
Here:
$45,685
State:
$95,910
Salary/wage: $41,933 (reported on 79.2% of returns)
Here:
$41,933
State:
$77,331
(% of AGI for various income ranges: 965.6% for AGIs below $25k, 3394.4% for AGIs $25k-50k, 6014.0% for AGIs $50k-75k, 8252.5% for AGIs $75k-100k, 16277.5% for AGIs $100k-200k)
Taxable interest for individuals: $300 (reported on 18.9% of returns)
This zip code:
$300
California:
$2,294
(% of AGI for various income ranges: 4.4% for AGIs below $25k, 34.0% for AGIs $50k-75k, 12.5% for AGIs $100k-200k)
Ordinary dividends: $1,100 (reported on 3.8% of returns)
Here:
$1,100
State:
$10,949
(% of AGI for various income ranges: 12.2% for AGIs below $25k)
Taxable individual retirement arrangement distribution: $10,200 (reported on 5.7% of returns)
93562:
$10,200
California:
$23,505
(% of AGI for various income ranges: 170.0% for AGIs below $25k)
Earned income credit: $2,253 (reported on 28.3% of returns)
Here:
$2,253
State:
$2,074
(% of AGI for various income ranges: 143.9% for AGIs below $25k, 87.8% for AGIs $25k-50k)
Percentage of individuals using paid preparers for their 2020 taxes: 92.5%
Here:
92%
State:
92%
(% for various income ranges: 95.8% for AGIs below $25k, 90.9% for AGIs $25k-50k, 83.3% for AGIs $50k-75k, 100.0% for AGIs $75k-100k, 85.7% for AGIs $100k-200k)
Averages for the 2012 tax year for zip code 93562, filed in 2013:
Average Adjusted Gross Income (AGI) in 2012: $44,289 (Individual Income Tax Returns)
Here:
$44,289
State:
$72,726
Salary/wage: $45,277 (reported on 81.5% of returns)
Here:
$45,277
State:
$59,079
(% of AGI for various income ranges: 63.5% for AGIs below $25k, 76.4% for AGIs $25k-50k, 90.7% for AGIs $50k-75k, 92.0% for AGIs $75k-100k, 80.9% for AGIs $100k-200k)
Taxable interest for individuals: $317 (reported on 22.2% of returns)
This zip code:
$317
California:
$2,146
(% of AGI for various income ranges: 0.4% for AGIs below $25k, 0.2% for AGIs $50k-75k, 0.1% for AGIs $100k-200k)
Ordinary dividends: $600 (reported on 5.6% of returns)
Here:
$600
State:
$9,308
Profit/loss from business: +$6,329 (reported on 13.0% of returns)
Here:
+$6,329
State:
+$17,064
(% of AGI for various income ranges: 12.4% for AGIs below $25k, 3.5% for AGIs $25k-50k)
Taxable individual retirement arrangement distribution: $11,400 (reported on 7.4% of returns)
93562:
$11,400
California:
$19,557
Total itemized deductions: $16,444 (18% of AGI, reported on 16.7% of returns)
Here:
$16,444
State:
$34,004
Here:
17.9% of AGI
State:
22.7% of AGI
(% of AGI for various income ranges: 11.2% for AGIs $50k-75k, 11.1% for AGIs $100k-200k)
Charity contributions: $4,083 (reported on 11.1% of returns)
Here:
$4,083
State:
$4,659
(% of AGI for various income ranges: 1.3% for AGIs $50k-75k, 2.4% for AGIs $100k-200k)
Taxes paid: $6,433 (reported on 16.7% of returns)
93562:
$6,433
State:
$14,448
(% of AGI for various income ranges: 3.4% for AGIs $50k-75k, 5.4% for AGIs $100k-200k)
Earned income credit: $2,233 (reported on 27.8% of returns)
Here:
$2,233
State:
$2,286
(% of AGI for various income ranges: 10.7% for AGIs below $25k, 1.7% for AGIs $25k-50k)
Percentage of individuals using paid preparers for their 2012 taxes: 48.1%
Here:
48%
State:
64%
(% for various income ranges: 34.8% for AGIs below $25k, 50.0% for AGIs $25k-50k, 63.6% for AGIs $50k-75k, 60.0% for AGIs $75k-100k, 60.0% for AGIs $100k-200k)
Averages for the 2004 tax year for zip code 93562, filed in 2005:
Average Adjusted Gross Income (AGI) in 2004: $39,127 (Individual Income Tax Returns)
Here:
$39,127
State:
$58,600
Salary/wage: $38,760 (reported on 87.8% of returns)
Here:
$38,760
State:
$49,455
(% of AGI for various income ranges: 105.6% for AGIs below $10k, 64.9% for AGIs $10k-25k, 85.5% for AGIs $25k-50k, 95.4% for AGIs $50k-75k, 87.2% for AGIs $75k-100k, 76.8% for AGIs over 100k)
Taxable interest for individuals: $475 (reported on 32.1% of returns)
This zip code:
$475
California:
$2,365
(% of AGI for various income ranges: 0.5% for AGIs below $10k, 1.0% for AGIs $10k-25k, 0.3% for AGIs $25k-50k, 0.3% for AGIs $50k-75k, 0.4% for AGIs $75k-100k, 0.4% for AGIs over 100k)
Taxable dividends: $574 (reported on 12.2% of returns)
Here:
$574
State:
$4,746
(% of AGI for various income ranges: 1.9% for AGIs below $10k, 0.4% for AGIs $10k-25k, 0.1% for AGIs $50k-75k, 0.4% for AGIs $75k-100k)
Profit/loss from business: +$342 (reported on 7.6% of returns)
Here:
+$342
State:
+$16,826
Total itemized deductions: $14,500 (19% of AGI, reported on 18.9% of returns)
Here:
$14,500
State:
$28,113
Here:
19.5% of AGI
State:
25.3% of AGI
(% of AGI for various income ranges: 5.3% for AGIs $25k-50k, 6.3% for AGIs $50k-75k, 10.4% for AGIs $75k-100k, 12.2% for AGIs over 100k)
Charity contributions deductions: $3,566 (5% of AGI, reported on 16.7% of returns)
Here:
$3,566
State:
$3,923
Here:
4.7% of AGI
State:
3.3% of AGI
(% of AGI for various income ranges: 0.9% for AGIs $25k-50k, 1.3% for AGIs $50k-75k, 2.4% for AGIs $75k-100k, 2.9% for AGIs over 100k)
Total tax: $4,824 (reported on 70.7% of returns)
93562:
$4,824
State:
$10,761
(% of AGI for various income ranges: 1.9% for AGIs below $10k, 2.6% for AGIs $10k-25k, 5.9% for AGIs $25k-50k, 8.7% for AGIs $50k-75k, 11.2% for AGIs $75k-100k, 14.4% for AGIs over 100k)
Earned income credit: $1,717 (reported on 21.3% of returns)
Here:
$1,717
State:
$1,763
Percentage of individuals using paid preparers for their 2004 taxes: 53.8%
Here:
54%
State:
66%
(% for various income ranges: 39.4% for AGIs below $10k, 59.8% for AGIs $10k-25k, 47.7% for AGIs $25k-50k, 57.6% for AGIs $50k-75k, 72.5% for AGIs $75k-100k, 72.7% for AGIs over 100k)
Household received Food Stamps/SNAP in the past 12 months: 155 Household did not receive Food Stamps/SNAP in the past 12 months: 606
Women who had a birth in the past 12 months: 19 (19 now married, 0 unmarried) Women who did not have a birth in the past 12 months: 294 (163 now married, 129 unmarried)
Housing units in zip code 93562 with a mortgage: 103 Median monthly owner costs for units with a mortgage: $870 Median monthly owner costs for units without a mortgage: $368
Residents with income below the poverty level in 2022:
This zip code:
20.5%
Whole state:
12.2%
Residents with income below 50% of the poverty level in 2022:
This zip code:
9.9%
Whole state:
6.2%
Median number of rooms in houses and condos:
Here:
5.9
State:
6.0
Median number of rooms in apartments:
Here:
5.3
State:
3.9
Notable locations in this zip code not listed on our city pages
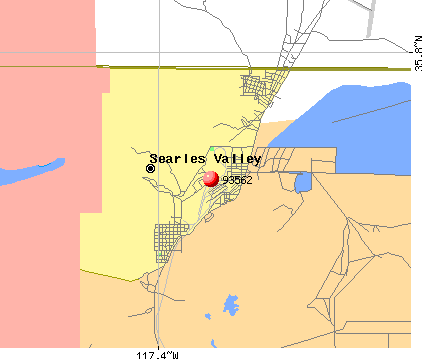
Notable locations in zip code 93562: Searles Valley Minerals Fire Department West End Station (A), San Bernardino County Fire Department Station 57 Trona (B), Searles Valley Minerals Fire Department (C), Trona Branch San Bernardino County Library (D). Display/hide their locations on the map
Size of family households: 285 2-persons, 79 3-persons, 71 4-persons, 30 5-persons, 19 6-persons, 25 7-or-more-persons
Size of nonfamily households: 200 1-person, 40 2-persons
374 married couples with children.
146 single-parent households (124 men, 22 women).
91.5% of residents of 93562 zip code speak English at home.
5.8% of residents speak Spanish at home (100% very well).
0.5% of residents speak other Indo-European language at home (50% very well, 25% well, 25% not at all).
1.4% of residents speak Asian or Pacific Island language at home (38% very well, 50% well, 12% not well).
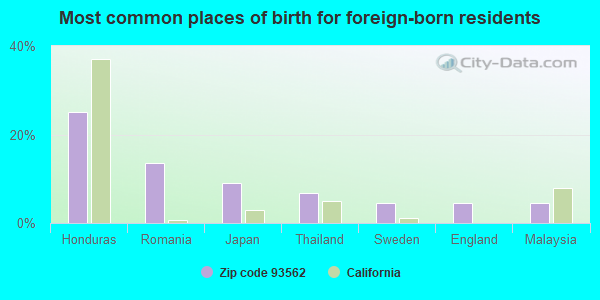
Foreign born population: 44 (2.4%) (53.8% of them are naturalized citizens)
This zip code:
2.4%
Whole state:
26.7%
25%Honduras
14%Romania
9%Japan
7%Thailand
5%Sweden
5%England
5%Malaysia
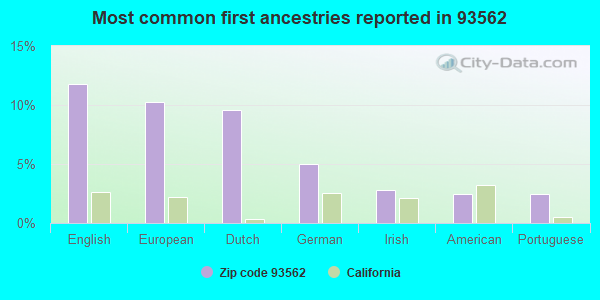
12%English
10%European
10%Dutch
5%German
3%Irish
2%American
2%Portuguese
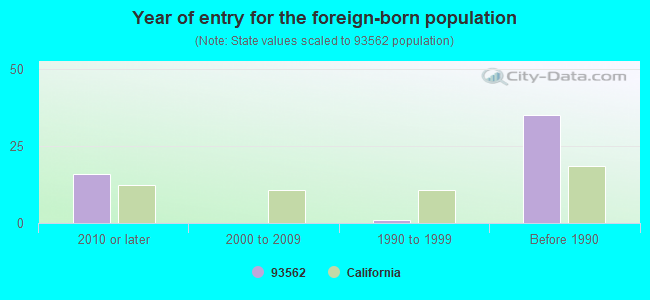
Year of entry for the foreign-born population
162010 or later
02000 to 2009
11990 to 1999
35Before 1990
Facilities with environmental interests located in this zip code:
ACE COGENERATION FACILITY (12801 MARIPOSA STREET in TRONA, CA)
AIR MAJOR (AIRS/AFS) STATE MASTER (California - Hazardous Waste Tracking) - HAZARDOU WASTE PROGRAM (Integrated Compliance Information System) - ICIS-09-1994-0029, FORMAL ENFORCEMENT ACTION CRITERIA AND HAZARDOUS AIR POLLUTANT INVENTORY (Inventory of air pollution sources) HAZARDOUS WASTE BIENNIAL REPORTER (Resource Conservation and Recovery Act (tracking hazardous waste)) Large Quantity Generators, more that 1000 kg of hazardous waste/month (Resource Conservation and Recovery Act (tracking hazardous waste)) TRI REPORTER (Tracking of toxic chemicals releasing facilities) Business SIC classification: ELECTRIC SERVICES Business NAICS classification: FOSSIL FUEL ELECTRIC POWER GENERATION. Organizations: TRONA OPERATING PARTNERS (CONTACT/OPERATOR)
, ACE COGENERATION COMPANY (CONTACT/OWNER)
Alternative names: ACE COGENERATION CO.
CHEVRON USA INC TRONA BULK PLT (82724 TRONA RD in TRONA, CA)
(Resource Conservation and Recovery Act (tracking hazardous waste)) Organizations: CHEVRON USA INC/TRONA RAILWAY CO (CONTACT/OWNER)
AASGARD ELDRIDGE CONST INC (82700 TRONA RD in TRONA, CA)
TRANSPORTER (Resource Conservation and Recovery Act (tracking hazardous waste))
KERR MCGEE CHEMICAL CORP (13200 MAIN ST BOILER ASH SITE in TRONA, CA)
Small Quantity Generators, between 100 kg and 1000 kg of hazardous waste/month (Resource Conservation and Recovery Act (tracking hazardous waste)) - notification Alternative names: KERR MCGEE CHE;WESTEND ;TRONA
AMOND COMPANY (STOCKWELL MINE ROAD in TRONA, CA)
CRITERIA AND HAZARDOUS AIR POLLUTANT INVENTORY (Inventory of air pollution sources) Business SIC classification: CONSTRUCTION SAND AND GRAVEL
HOMEWOOD CANYON DISPOSAL SITE (OFF TRONA-WILDWOOD RD ON HOMEW in TRONA, CA)
CRITERIA AND HAZARDOUS AIR POLLUTANT INVENTORY (Inventory of air pollution sources) Business SIC classification: REFUSE SYSTEMS Business NAICS classification: SOLID WASTE LANDFILL.
HONDO / IMC - WEST END (80201 TRONA ROAD in TRONA, CA)
CRITERIA AND HAZARDOUS AIR POLLUTANT INVENTORY (Inventory of air pollution sources) Business SIC classification: CRUSHED AND BROKEN LIMESTONE
KERR MCGEE CHEMICAL CORP D.S. (SEARLES LAKE in TRONA, CA)
CRITERIA AND HAZARDOUS AIR POLLUTANT INVENTORY (Inventory of air pollution sources) Business SIC classification: REFUSE SYSTEMS Business NAICS classification: SOLID WASTE LANDFILL.
Housing units lacking complete plumbing facilities: 10.8% Housing units lacking complete kitchen facilities: 8.0%
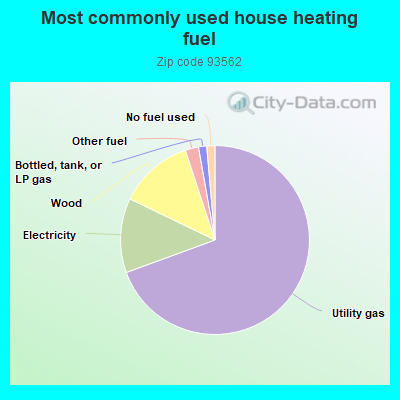
69.7%Utility gas
12.8%Electricity
12.8%Wood
2.3%Other fuel
1.4%Bottled, tank, or LP gas
1.4%No fuel used
Population in 1990: 3,189.
Place of birth for U.S.-born residents:
This state: 1,159
Northeast: 134
Midwest: 61
South: 239
West: 189
54% of the 93562 zip code residents lived in the same house 5 years ago. Out of people who lived in different houses, 60% lived in this county. Out of people who lived in different counties, 50% lived in California.
79% of the 93562 zip code residents lived in the same house 1 year ago. Out of people who lived in different houses, 37% moved from this county. Out of people who lived in different houses, 51% moved from different county within same state. Out of people who lived in different houses, 6% moved from different state. Out of people who lived in different houses, 2% moved from abroad.
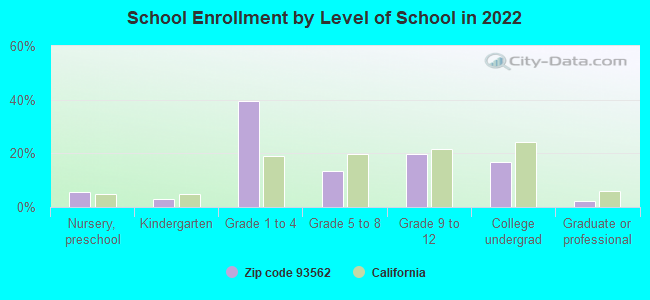
Private vs. public school enrollment:
Students in private schools in grades 1 to 8 (elementary and middle school): 11
Here:
3.8%
California:
10.5%
Students in private schools in grades 9 to 12 (high school):
Here:
0.0%
California:
8.5%
Students in private undergraduate colleges: 2
Here:
3.1%
California:
15.9%
Occupation by median earnings in the past 12 months ($)
105,309Construction and extraction occupations
103,034Production occupations
100,663Management occupations
71,802Life, physical, and social science occupations
58,853Installation, maintenance, and repair occupations
34,204Material moving occupations
Top industries in this zip code by the number of employees in 2005:
Mining: Potash, Soda, and Borate Mineral Mining (100-249 employees: 1 establishment, 50-99 employees: 1 establishment)
Administrative and Support and Waste Management and Remediation Services: Temporary Help Services (100-249: 1)
Mining: Gold Ore Mining (20-49: 1)
Finance and Insurance: Credit Unions (10-19: 1)
Wholesale Trade: Other Chemical and Allied Products Merchant Wholesalers (10-19: 1)
Construction: Electrical Contractors (10-19: 1)
Accommodation and Food Services: Limited-Service Restaurants (5-9: 1)
Other Services (except Public Administration): Religious Organizations (1-4: 2)
Fatal accident statistics in 2010:
Fatal accident count: 2
Vehicles involved in fatal accidents: 2
Fatal accidents caused by drunken drivers: 2
Fatalities: 2
Persons involved in fatal accidents: 4
Pedestrians involved in fatal accidents: 0
Home Mortgage Disclosure Act Aggregated Statistics For Year 2008 (Based on 2 partial tracts)
C) Refinancings
Number
Average Value
LOANS ORIGINATED
0
$0
APPLICATIONS APPROVED, NOT ACCEPTED
0
$0
APPLICATIONS DENIED
1
$90,270
APPLICATIONS WITHDRAWN
0
$0
FILES CLOSED FOR INCOMPLETENESS
0
$0
Aggregated Statistics For Year 2007 (Based on 2 partial tracts)
B) Conventional Home Purchase Loans
C) Refinancings
D) Home Improvement Loans
Number
Average Value
Number
Average Value
Number
Average Value
LOANS ORIGINATED
1
$73,390
1
$77,880
0
$0
APPLICATIONS APPROVED, NOT ACCEPTED
1
$85,990
0
$0
0
$0
APPLICATIONS DENIED
1
$51,510
2
$59,770
1
$29,940
APPLICATIONS WITHDRAWN
0
$0
1
$141,120
0
$0
FILES CLOSED FOR INCOMPLETENESS
0
$0
0
$0
0
$0
Aggregated Statistics For Year 2006 (Based on 2 partial tracts)
B) Conventional Home Purchase Loans
C) Refinancings
F) Non-occupant Loans on < 5 Family Dwellings (A B C & D)
Number
Average Value
Number
Average Value
Number
Average Value
LOANS ORIGINATED
1
$80,730
2
$71,020
1
$42,380
APPLICATIONS APPROVED, NOT ACCEPTED
0
$0
0
$0
0
$0
APPLICATIONS DENIED
1
$69,050
3
$87,583
1
$41,060
APPLICATIONS WITHDRAWN
1
$44,570
2
$82,595
0
$0
FILES CLOSED FOR INCOMPLETENESS
0
$0
0
$0
0
$0
Aggregated Statistics For Year 2005 (Based on 2 partial tracts)
B) Conventional Home Purchase Loans
C) Refinancings
D) Home Improvement Loans
Number
Average Value
Number
Average Value
Number
Average Value
LOANS ORIGINATED
1
$56,510
1
$145,200
0
$0
APPLICATIONS APPROVED, NOT ACCEPTED
0
$0
0
$0
0
$0
APPLICATIONS DENIED
1
$76,750
3
$77,587
1
$30,040
APPLICATIONS WITHDRAWN
1
$82,160
1
$99,450
0
$0
FILES CLOSED FOR INCOMPLETENESS
0
$0
0
$0
0
$0
Aggregated Statistics For Year 2004 (Based on 2 partial tracts)
B) Conventional Home Purchase Loans
C) Refinancings
D) Home Improvement Loans
Number
Average Value
Number
Average Value
Number
Average Value
LOANS ORIGINATED
1
$69,610
1
$62,120
0
$0
APPLICATIONS APPROVED, NOT ACCEPTED
0
$0
1
$40,800
0
$0
APPLICATIONS DENIED
1
$45,080
3
$67,200
1
$32,180
APPLICATIONS WITHDRAWN
0
$0
1
$83,180
0
$0
FILES CLOSED FOR INCOMPLETENESS
0
$0
0
$0
0
$0
Aggregated Statistics For Year 2003 (Based on 2 partial tracts)
B) Conventional Home Purchase Loans
C) Refinancings
Number
Average Value
Number
Average Value
LOANS ORIGINATED
1
$27,230
1
$66,810
APPLICATIONS APPROVED, NOT ACCEPTED
0
$0
1
$29,380
APPLICATIONS DENIED
0
$0
2
$54,060
APPLICATIONS WITHDRAWN
0
$0
1
$82,260
FILES CLOSED FOR INCOMPLETENESS
0
$0
0
$0
Aggregated Statistics For Year 2002 (Based on 2 partial tracts)
C) Refinancings
Number
Average Value
LOANS ORIGINATED
1
$42,230
APPLICATIONS APPROVED, NOT ACCEPTED
1
$38,910
APPLICATIONS DENIED
2
$37,840
APPLICATIONS WITHDRAWN
1
$84,810
FILES CLOSED FOR INCOMPLETENESS
0
$0
Aggregated Statistics For Year 2001 (Based on 2 partial tracts)
C) Refinancings
Number
Average Value
LOANS ORIGINATED
0
$0
APPLICATIONS APPROVED, NOT ACCEPTED
0
$0
APPLICATIONS DENIED
1
$45,130
APPLICATIONS WITHDRAWN
1
$34,880
FILES CLOSED FOR INCOMPLETENESS
0
$0
Aggregated Statistics For Year 2000 (Based on 2 partial tracts)
C) Refinancings
Number
Average Value
LOANS ORIGINATED
0
$0
APPLICATIONS APPROVED, NOT ACCEPTED
0
$0
APPLICATIONS DENIED
1
$57,940
APPLICATIONS WITHDRAWN
1
$22,180
FILES CLOSED FOR INCOMPLETENESS
0
$0
Aggregated Statistics For Year 1999 (Based on 1 partial tract)

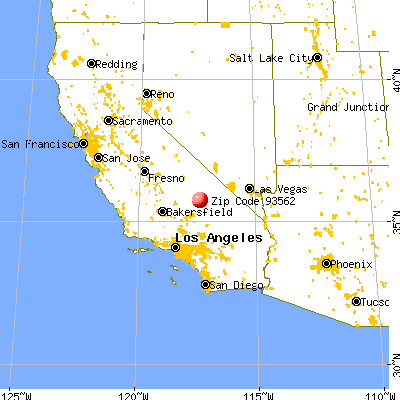


 Nearest zip codes: 93592, 93555, 93528, 93558, 93554, 93522.