Estimated zip code population in 2022: 46,232
Zip code population in 2010: 45,614
Zip code population in 2000: 46,851
Houses and condos: 16,062
Renter-occupied apartments: 3,743
% of renters here:
24%State:
44%
March 2022 cost of living index in zip code 93611: 96.4
(near average, U.S. average is 100)
Land area: 11.2
sq. mi.
Water area: 0.0
sq. mi.
Population density: 4,130 people per square mile (average).
OSM Map
General Map
Google Map
MSN Map
OSM Map
General Map
Google Map
MSN Map
OSM Map
General Map
Google Map
MSN Map
OSM Map
General Map
Google Map
MSN Map
Please wait while loading the map...
Real estate property taxes paid for housing units in 2022:
This zip code:
0.8% ($3,641)California:
0.7% ($4,831)
Median real estate property taxes paid for housing units with mortgages in 2022: $3,779 (0.8%)
Median real estate property taxes paid for housing units with no mortgage in 2022: $3,457 (0.8%)
Profiles of local businesses
Business Search - 14 Million verified businesses
Males: 21,912 Females: 24,321
For population 25 years and over in 93611:
High school or higher: 92.2%Bachelor's degree or higher: 39.4%Graduate or professional degree: 14.5%Unemployed: 4.9%Mean travel time to work (commute): 23.3 minutes
For population 15 years and over in 93611:
Never married: 27.3%Now married: 57.1%Separated: 0.9%Widowed: 6.1%Divorced: 8.5%
Zip code 93611 compared to state average:
Median house value below state average. Foreign-born population percentage below state average. Renting percentage below state average. Length of stay since moving in above state average. Number of rooms per house above state average. House age significantly below state average. 23,322 50.4% White 13,528 29.3% Hispanic or Latino 4,979 10.8% Asian 2,260 4.9% Two or more races 1,600 3.5% Black 270 0.6% Some other race 166 0.4% American Indian 104 0.2% Native Hawaiian and Other
Data:
Median household income ($)
Median household income (% change since 2000)
Household income diversity
Ratio of average income to average house value (%)
Ratio of average income to average rent
Median household income ($) - White
Median household income ($) - Black or African American
Median household income ($) - Asian
Median household income ($) - Hispanic or Latino
Median household income ($) - American Indian and Alaska Native
Median household income ($) - Multirace
Median household income ($) - Other Race
Median household income for houses/condos with a mortgage ($)
Median household income for apartments without a mortgage ($)
Races - White alone (%)
Races - White alone (% change since 2000)
Races - Black alone (%)
Races - Black alone (% change since 2000)
Races - American Indian alone (%)
Races - American Indian alone (% change since 2000)
Races - Asian alone (%)
Races - Asian alone (% change since 2000)
Races - Hispanic (%)
Races - Hispanic (% change since 2000)
Races - Native Hawaiian and Other Pacific Islander alone (%)
Races - Native Hawaiian and Other Pacific Islander alone (% change since 2000)
Races - Two or more races (%)
Races - Two or more races (% change since 2000)
Races - Other race alone (%)
Races - Other race alone (% change since 2000)
Racial diversity
Unemployment (%)
Unemployment (% change since 2000)
Unemployment (%) - White
Unemployment (%) - Black or African American
Unemployment (%) - Asian
Unemployment (%) - Hispanic or Latino
Unemployment (%) - American Indian and Alaska Native
Unemployment (%) - Multirace
Unemployment (%) - Other Race
Population density (people per square mile)
Population - Males (%)
Population - Females (%)
Population - Males (%) - White
Population - Males (%) - Black or African American
Population - Males (%) - Asian
Population - Males (%) - Hispanic or Latino
Population - Males (%) - American Indian and Alaska Native
Population - Males (%) - Multirace
Population - Males (%) - Other Race
Population - Females (%) - White
Population - Females (%) - Black or African American
Population - Females (%) - Asian
Population - Females (%) - Hispanic or Latino
Population - Females (%) - American Indian and Alaska Native
Population - Females (%) - Multirace
Population - Females (%) - Other Race
Coronavirus confirmed cases (May 28, 2024)
Deaths caused by coronavirus (May 28, 2024)
Coronavirus confirmed cases (per 100k population) (May 28, 2024)
Deaths caused by coronavirus (per 100k population) (May 28, 2024)
Daily increase in number of cases (May 28, 2024)
Weekly increase in number of cases (May 28, 2024)
Cases doubled (in days) (May 28, 2024)
Hospitalized patients (Apr 18, 2022)
Negative test results (Apr 18, 2022)
Total test results (Apr 18, 2022)
COVID Vaccine doses distributed (per 100k population) (Sep 19, 2023)
COVID Vaccine doses administered (per 100k population) (Sep 19, 2023)
COVID Vaccine doses distributed (Sep 19, 2023)
COVID Vaccine doses administered (Sep 19, 2023)
Likely homosexual households (%)
Likely homosexual households (% change since 2000)
Likely homosexual households - Lesbian couples (%)
Likely homosexual households - Lesbian couples (% change since 2000)
Likely homosexual households - Gay men (%)
Likely homosexual households - Gay men (% change since 2000)
Cost of living index
Median gross rent ($)
Median contract rent ($)
Median monthly housing costs ($)
Median house or condo value ($)
Median house or condo value ($ change since 2000)
Mean house or condo value by units in structure - 1, detached ($)
Mean house or condo value by units in structure - 1, attached ($)
Mean house or condo value by units in structure - 2 ($)
Mean house or condo value by units in structure by units in structure - 3 or 4 ($)
Mean house or condo value by units in structure - 5 or more ($)
Mean house or condo value by units in structure - Boat, RV, van, etc. ($)
Mean house or condo value by units in structure - Mobile home ($)
Median house or condo value ($) - White
Median house or condo value ($) - Black or African American
Median house or condo value ($) - Asian
Median house or condo value ($) - Hispanic or Latino
Median house or condo value ($) - American Indian and Alaska Native
Median house or condo value ($) - Multirace
Median house or condo value ($) - Other Race
Median resident age
Resident age diversity
Median resident age - Males
Median resident age - Females
Median resident age - White
Median resident age - Black or African American
Median resident age - Asian
Median resident age - Hispanic or Latino
Median resident age - American Indian and Alaska Native
Median resident age - Multirace
Median resident age - Other Race
Median resident age - Males - White
Median resident age - Males - Black or African American
Median resident age - Males - Asian
Median resident age - Males - Hispanic or Latino
Median resident age - Males - American Indian and Alaska Native
Median resident age - Males - Multirace
Median resident age - Males - Other Race
Median resident age - Females - White
Median resident age - Females - Black or African American
Median resident age - Females - Asian
Median resident age - Females - Hispanic or Latino
Median resident age - Females - American Indian and Alaska Native
Median resident age - Females - Multirace
Median resident age - Females - Other Race
Commute - mean travel time to work (minutes)
Travel time to work - Less than 5 minutes (%)
Travel time to work - Less than 5 minutes (% change since 2000)
Travel time to work - 5 to 9 minutes (%)
Travel time to work - 5 to 9 minutes (% change since 2000)
Travel time to work - 10 to 19 minutes (%)
Travel time to work - 10 to 19 minutes (% change since 2000)
Travel time to work - 20 to 29 minutes (%)
Travel time to work - 20 to 29 minutes (% change since 2000)
Travel time to work - 30 to 39 minutes (%)
Travel time to work - 30 to 39 minutes (% change since 2000)
Travel time to work - 40 to 59 minutes (%)
Travel time to work - 40 to 59 minutes (% change since 2000)
Travel time to work - 60 to 89 minutes (%)
Travel time to work - 60 to 89 minutes (% change since 2000)
Travel time to work - 90 or more minutes (%)
Travel time to work - 90 or more minutes (% change since 2000)
Marital status - Never married (%)
Marital status - Now married (%)
Marital status - Separated (%)
Marital status - Widowed (%)
Marital status - Divorced (%)
Median family income ($)
Median family income (% change since 2000)
Median non-family income ($)
Median non-family income (% change since 2000)
Median per capita income ($)
Median per capita income (% change since 2000)
Median family income ($) - White
Median family income ($) - Black or African American
Median family income ($) - Asian
Median family income ($) - Hispanic or Latino
Median family income ($) - American Indian and Alaska Native
Median family income ($) - Multirace
Median family income ($) - Other Race
Median year house/condo built
Median year apartment built
Year house built - Built 2005 or later (%)
Year house built - Built 2000 to 2004 (%)
Year house built - Built 1990 to 1999 (%)
Year house built - Built 1980 to 1989 (%)
Year house built - Built 1970 to 1979 (%)
Year house built - Built 1960 to 1969 (%)
Year house built - Built 1950 to 1959 (%)
Year house built - Built 1940 to 1949 (%)
Year house built - Built 1939 or earlier (%)
Average household size
Household density (households per square mile)
Average household size - White
Average household size - Black or African American
Average household size - Asian
Average household size - Hispanic or Latino
Average household size - American Indian and Alaska Native
Average household size - Multirace
Average household size - Other Race
Occupied housing units (%)
Vacant housing units (%)
Owner occupied housing units (%)
Renter occupied housing units (%)
Vacancy status - For rent (%)
Vacancy status - For sale only (%)
Vacancy status - Rented or sold, not occupied (%)
Vacancy status - For seasonal, recreational, or occasional use (%)
Vacancy status - For migrant workers (%)
Vacancy status - Other vacant (%)
Residents with income below the poverty level (%)
Residents with income below 50% of the poverty level (%)
Children below poverty level (%)
Poor families by family type - Married-couple family (%)
Poor families by family type - Male, no wife present (%)
Poor families by family type - Female, no husband present (%)
Poverty status for native-born residents (%)
Poverty status for foreign-born residents (%)
Poverty among high school graduates not in families (%)
Poverty among people who did not graduate high school not in families (%)
Residents with income below the poverty level (%) - White
Residents with income below the poverty level (%) - Black or African American
Residents with income below the poverty level (%) - Asian
Residents with income below the poverty level (%) - Hispanic or Latino
Residents with income below the poverty level (%) - American Indian and Alaska Native
Residents with income below the poverty level (%) - Multirace
Residents with income below the poverty level (%) - Other Race
Air pollution - Air Quality Index (AQI)
Air pollution - CO
Air pollution - NO2
Air pollution - SO2
Air pollution - Ozone
Air pollution - PM10
Air pollution - PM25
Air pollution - Pb
Crime - Murders per 100,000 population
Crime - Rapes per 100,000 population
Crime - Robberies per 100,000 population
Crime - Assaults per 100,000 population
Crime - Burglaries per 100,000 population
Crime - Thefts per 100,000 population
Crime - Auto thefts per 100,000 population
Crime - Arson per 100,000 population
Crime - City-data.com crime index
Crime - Violent crime index
Crime - Property crime index
Crime - Murders per 100,000 population (5 year average)
Crime - Rapes per 100,000 population (5 year average)
Crime - Robberies per 100,000 population (5 year average)
Crime - Assaults per 100,000 population (5 year average)
Crime - Burglaries per 100,000 population (5 year average)
Crime - Thefts per 100,000 population (5 year average)
Crime - Auto thefts per 100,000 population (5 year average)
Crime - Arson per 100,000 population (5 year average)
Crime - City-data.com crime index (5 year average)
Crime - Violent crime index (5 year average)
Crime - Property crime index (5 year average)
1996 Presidential Elections Results (%) - Democratic Party (Clinton)
1996 Presidential Elections Results (%) - Republican Party (Dole)
1996 Presidential Elections Results (%) - Other
2000 Presidential Elections Results (%) - Democratic Party (Gore)
2000 Presidential Elections Results (%) - Republican Party (Bush)
2000 Presidential Elections Results (%) - Other
2004 Presidential Elections Results (%) - Democratic Party (Kerry)
2004 Presidential Elections Results (%) - Republican Party (Bush)
2004 Presidential Elections Results (%) - Other
2008 Presidential Elections Results (%) - Democratic Party (Obama)
2008 Presidential Elections Results (%) - Republican Party (McCain)
2008 Presidential Elections Results (%) - Other
2012 Presidential Elections Results (%) - Democratic Party (Obama)
2012 Presidential Elections Results (%) - Republican Party (Romney)
2012 Presidential Elections Results (%) - Other
2016 Presidential Elections Results (%) - Democratic Party (Clinton)
2016 Presidential Elections Results (%) - Republican Party (Trump)
2016 Presidential Elections Results (%) - Other
2020 Presidential Elections Results (%) - Democratic Party (Biden)
2020 Presidential Elections Results (%) - Republican Party (Trump)
2020 Presidential Elections Results (%) - Other
Ancestries Reported - Arab (%)
Ancestries Reported - Czech (%)
Ancestries Reported - Danish (%)
Ancestries Reported - Dutch (%)
Ancestries Reported - English (%)
Ancestries Reported - French (%)
Ancestries Reported - French Canadian (%)
Ancestries Reported - German (%)
Ancestries Reported - Greek (%)
Ancestries Reported - Hungarian (%)
Ancestries Reported - Irish (%)
Ancestries Reported - Italian (%)
Ancestries Reported - Lithuanian (%)
Ancestries Reported - Norwegian (%)
Ancestries Reported - Polish (%)
Ancestries Reported - Portuguese (%)
Ancestries Reported - Russian (%)
Ancestries Reported - Scotch-Irish (%)
Ancestries Reported - Scottish (%)
Ancestries Reported - Slovak (%)
Ancestries Reported - Subsaharan African (%)
Ancestries Reported - Swedish (%)
Ancestries Reported - Swiss (%)
Ancestries Reported - Ukrainian (%)
Ancestries Reported - United States (%)
Ancestries Reported - Welsh (%)
Ancestries Reported - West Indian (%)
Ancestries Reported - Other (%)
Educational Attainment - No schooling completed (%)
Educational Attainment - Less than high school (%)
Educational Attainment - High school or equivalent (%)
Educational Attainment - Less than 1 year of college (%)
Educational Attainment - 1 or more years of college (%)
Educational Attainment - Associate degree (%)
Educational Attainment - Bachelor's degree (%)
Educational Attainment - Master's degree (%)
Educational Attainment - Professional school degree (%)
Educational Attainment - Doctorate degree (%)
School Enrollment - Nursery, preschool (%)
School Enrollment - Kindergarten (%)
School Enrollment - Grade 1 to 4 (%)
School Enrollment - Grade 5 to 8 (%)
School Enrollment - Grade 9 to 12 (%)
School Enrollment - College undergrad (%)
School Enrollment - Graduate or professional (%)
School Enrollment - Not enrolled in school (%)
School enrollment - Public schools (%)
School enrollment - Private schools (%)
School enrollment - Not enrolled (%)
Median number of rooms in houses and condos
Median number of rooms in apartments
Housing units lacking complete plumbing facilities (%)
Housing units lacking complete kitchen facilities (%)
Density of houses
Urban houses (%)
Rural houses (%)
Households with people 60 years and over (%)
Households with people 65 years and over (%)
Households with people 75 years and over (%)
Households with one or more nonrelatives (%)
Households with no nonrelatives (%)
Population in households (%)
Family households (%)
Nonfamily households (%)
Population in families (%)
Family households with own children (%)
Median number of bedrooms in owner occupied houses
Mean number of bedrooms in owner occupied houses
Median number of bedrooms in renter occupied houses
Mean number of bedrooms in renter occupied houses
Median number of vehichles in owner occupied houses
Mean number of vehichles in owner occupied houses
Median number of vehichles in renter occupied houses
Mean number of vehichles in renter occupied houses
Mortgage status - with mortgage (%)
Mortgage status - with second mortgage (%)
Mortgage status - with home equity loan (%)
Mortgage status - with both second mortgage and home equity loan (%)
Mortgage status - without a mortgage (%)
Average family size
Average family size - White
Average family size - Black or African American
Average family size - Asian
Average family size - Hispanic or Latino
Average family size - American Indian and Alaska Native
Average family size - Multirace
Average family size - Other Race
Geographical mobility - Same house 1 year ago (%)
Geographical mobility - Moved within same county (%)
Geographical mobility - Moved from different county within same state (%)
Geographical mobility - Moved from different state (%)
Geographical mobility - Moved from abroad (%)
Place of birth - Born in state of residence (%)
Place of birth - Born in other state (%)
Place of birth - Native, outside of US (%)
Place of birth - Foreign born (%)
Housing units in structures - 1, detached (%)
Housing units in structures - 1, attached (%)
Housing units in structures - 2 (%)
Housing units in structures - 3 or 4 (%)
Housing units in structures - 5 to 9 (%)
Housing units in structures - 10 to 19 (%)
Housing units in structures - 20 to 49 (%)
Housing units in structures - 50 or more (%)
Housing units in structures - Mobile home (%)
Housing units in structures - Boat, RV, van, etc. (%)
House/condo owner moved in on average (years ago)
Renter moved in on average (years ago)
Year householder moved into unit - Moved in 1999 to March 2000 (%)
Year householder moved into unit - Moved in 1995 to 1998 (%)
Year householder moved into unit - Moved in 1990 to 1994 (%)
Year householder moved into unit - Moved in 1980 to 1989 (%)
Year householder moved into unit - Moved in 1970 to 1979 (%)
Year householder moved into unit - Moved in 1969 or earlier (%)
Means of transportation to work - Drove car alone (%)
Means of transportation to work - Carpooled (%)
Means of transportation to work - Public transportation (%)
Means of transportation to work - Bus or trolley bus (%)
Means of transportation to work - Streetcar or trolley car (%)
Means of transportation to work - Subway or elevated (%)
Means of transportation to work - Railroad (%)
Means of transportation to work - Ferryboat (%)
Means of transportation to work - Taxicab (%)
Means of transportation to work - Motorcycle (%)
Means of transportation to work - Bicycle (%)
Means of transportation to work - Walked (%)
Means of transportation to work - Other means (%)
Working at home (%)
Industry diversity
Most Common Industries - Agriculture, forestry, fishing and hunting, and mining (%)
Most Common Industries - Agriculture, forestry, fishing and hunting (%)
Most Common Industries - Mining, quarrying, and oil and gas extraction (%)
Most Common Industries - Construction (%)
Most Common Industries - Manufacturing (%)
Most Common Industries - Wholesale trade (%)
Most Common Industries - Retail trade (%)
Most Common Industries - Transportation and warehousing, and utilities (%)
Most Common Industries - Transportation and warehousing (%)
Most Common Industries - Utilities (%)
Most Common Industries - Information (%)
Most Common Industries - Finance and insurance, and real estate and rental and leasing (%)
Most Common Industries - Finance and insurance (%)
Most Common Industries - Real estate and rental and leasing (%)
Most Common Industries - Professional, scientific, and management, and administrative and waste management services (%)
Most Common Industries - Professional, scientific, and technical services (%)
Most Common Industries - Management of companies and enterprises (%)
Most Common Industries - Administrative and support and waste management services (%)
Most Common Industries - Educational services, and health care and social assistance (%)
Most Common Industries - Educational services (%)
Most Common Industries - Health care and social assistance (%)
Most Common Industries - Arts, entertainment, and recreation, and accommodation and food services (%)
Most Common Industries - Arts, entertainment, and recreation (%)
Most Common Industries - Accommodation and food services (%)
Most Common Industries - Other services, except public administration (%)
Most Common Industries - Public administration (%)
Occupation diversity
Most Common Occupations - Management, business, science, and arts occupations (%)
Most Common Occupations - Management, business, and financial occupations (%)
Most Common Occupations - Management occupations (%)
Most Common Occupations - Business and financial operations occupations (%)
Most Common Occupations - Computer, engineering, and science occupations (%)
Most Common Occupations - Computer and mathematical occupations (%)
Most Common Occupations - Architecture and engineering occupations (%)
Most Common Occupations - Life, physical, and social science occupations (%)
Most Common Occupations - Education, legal, community service, arts, and media occupations (%)
Most Common Occupations - Community and social service occupations (%)
Most Common Occupations - Legal occupations (%)
Most Common Occupations - Education, training, and library occupations (%)
Most Common Occupations - Arts, design, entertainment, sports, and media occupations (%)
Most Common Occupations - Healthcare practitioners and technical occupations (%)
Most Common Occupations - Health diagnosing and treating practitioners and other technical occupations (%)
Most Common Occupations - Health technologists and technicians (%)
Most Common Occupations - Service occupations (%)
Most Common Occupations - Healthcare support occupations (%)
Most Common Occupations - Protective service occupations (%)
Most Common Occupations - Fire fighting and prevention, and other protective service workers including supervisors (%)
Most Common Occupations - Law enforcement workers including supervisors (%)
Most Common Occupations - Food preparation and serving related occupations (%)
Most Common Occupations - Building and grounds cleaning and maintenance occupations (%)
Most Common Occupations - Personal care and service occupations (%)
Most Common Occupations - Sales and office occupations (%)
Most Common Occupations - Sales and related occupations (%)
Most Common Occupations - Office and administrative support occupations (%)
Most Common Occupations - Natural resources, construction, and maintenance occupations (%)
Most Common Occupations - Farming, fishing, and forestry occupations (%)
Most Common Occupations - Construction and extraction occupations (%)
Most Common Occupations - Installation, maintenance, and repair occupations (%)
Most Common Occupations - Production, transportation, and material moving occupations (%)
Most Common Occupations - Production occupations (%)
Most Common Occupations - Transportation occupations (%)
Most Common Occupations - Material moving occupations (%)
People in Group quarters - Institutionalized population (%)
People in Group quarters - Correctional institutions (%)
People in Group quarters - Federal prisons and detention centers (%)
People in Group quarters - Halfway houses (%)
People in Group quarters - Local jails and other confinement facilities (including police lockups) (%)
People in Group quarters - Military disciplinary barracks (%)
People in Group quarters - State prisons (%)
People in Group quarters - Other types of correctional institutions (%)
People in Group quarters - Nursing homes (%)
People in Group quarters - Hospitals/wards, hospices, and schools for the handicapped (%)
People in Group quarters - Hospitals/wards and hospices for chronically ill (%)
People in Group quarters - Hospices or homes for chronically ill (%)
People in Group quarters - Military hospitals or wards for chronically ill (%)
People in Group quarters - Other hospitals or wards for chronically ill (%)
People in Group quarters - Hospitals or wards for drug/alcohol abuse (%)
People in Group quarters - Mental (Psychiatric) hospitals or wards (%)
People in Group quarters - Schools, hospitals, or wards for the mentally retarded (%)
People in Group quarters - Schools, hospitals, or wards for the physically handicapped (%)
People in Group quarters - Institutions for the deaf (%)
People in Group quarters - Institutions for the blind (%)
People in Group quarters - Orthopedic wards and institutions for the physically handicapped (%)
People in Group quarters - Wards in general hospitals for patients who have no usual home elsewhere (%)
People in Group quarters - Wards in military hospitals for patients who have no usual home elsewhere (%)
People in Group quarters - Juvenile institutions (%)
People in Group quarters - Long-term care (%)
People in Group quarters - Homes for abused, dependent, and neglected children (%)
People in Group quarters - Residential treatment centers for emotionally disturbed children (%)
People in Group quarters - Training schools for juvenile delinquents (%)
People in Group quarters - Short-term care, detention or diagnostic centers for delinquent children (%)
People in Group quarters - Type of juvenile institution unknown (%)
People in Group quarters - Noninstitutionalized population (%)
People in Group quarters - College dormitories (includes college quarters off campus) (%)
People in Group quarters - Military quarters (%)
People in Group quarters - On base (%)
People in Group quarters - Barracks, unaccompanied personnel housing (UPH), (Enlisted/Officer), ;and similar group living quarters for military personnel (%)
People in Group quarters - Transient quarters for temporary residents (%)
People in Group quarters - Military ships (%)
People in Group quarters - Group homes (%)
People in Group quarters - Homes or halfway houses for drug/alcohol abuse (%)
People in Group quarters - Homes for the mentally ill (%)
People in Group quarters - Homes for the mentally retarded (%)
People in Group quarters - Homes for the physically handicapped (%)
People in Group quarters - Other group homes (%)
People in Group quarters - Religious group quarters (%)
People in Group quarters - Dormitories (%)
People in Group quarters - Agriculture workers' dormitories on farms (%)
People in Group quarters - Job Corps and vocational training facilities (%)
People in Group quarters - Other workers' dormitories (%)
People in Group quarters - Crews of maritime vessels (%)
People in Group quarters - Other nonhousehold living situations (%)
People in Group quarters - Other noninstitutional group quarters (%)
Residents speaking English at home (%)
Residents speaking English at home - Born in the United States (%)
Residents speaking English at home - Native, born elsewhere (%)
Residents speaking English at home - Foreign born (%)
Residents speaking Spanish at home (%)
Residents speaking Spanish at home - Born in the United States (%)
Residents speaking Spanish at home - Native, born elsewhere (%)
Residents speaking Spanish at home - Foreign born (%)
Residents speaking other language at home (%)
Residents speaking other language at home - Born in the United States (%)
Residents speaking other language at home - Native, born elsewhere (%)
Residents speaking other language at home - Foreign born (%)
Class of Workers - Employee of private company (%)
Class of Workers - Self-employed in own incorporated business (%)
Class of Workers - Private not-for-profit wage and salary workers (%)
Class of Workers - Local government workers (%)
Class of Workers - State government workers (%)
Class of Workers - Federal government workers (%)
Class of Workers - Self-employed workers in own not incorporated business and Unpaid family workers (%)
House heating fuel used in houses and condos - Utility gas (%)
House heating fuel used in houses and condos - Bottled, tank, or LP gas (%)
House heating fuel used in houses and condos - Electricity (%)
House heating fuel used in houses and condos - Fuel oil, kerosene, etc. (%)
House heating fuel used in houses and condos - Coal or coke (%)
House heating fuel used in houses and condos - Wood (%)
House heating fuel used in houses and condos - Solar energy (%)
House heating fuel used in houses and condos - Other fuel (%)
House heating fuel used in houses and condos - No fuel used (%)
House heating fuel used in apartments - Utility gas (%)
House heating fuel used in apartments - Bottled, tank, or LP gas (%)
House heating fuel used in apartments - Electricity (%)
House heating fuel used in apartments - Fuel oil, kerosene, etc. (%)
House heating fuel used in apartments - Coal or coke (%)
House heating fuel used in apartments - Wood (%)
House heating fuel used in apartments - Solar energy (%)
House heating fuel used in apartments - Other fuel (%)
House heating fuel used in apartments - No fuel used (%)
Armed forces status - In Armed Forces (%)
Armed forces status - Civilian (%)
Armed forces status - Civilian - Veteran (%)
Armed forces status - Civilian - Nonveteran (%)
Fatal accidents locations in years 2005-2021
Fatal accidents locations in 2005
Fatal accidents locations in 2006
Fatal accidents locations in 2007
Fatal accidents locations in 2008
Fatal accidents locations in 2009
Fatal accidents locations in 2010
Fatal accidents locations in 2011
Fatal accidents locations in 2012
Fatal accidents locations in 2013
Fatal accidents locations in 2014
Fatal accidents locations in 2015
Fatal accidents locations in 2016
Fatal accidents locations in 2017
Fatal accidents locations in 2018
Fatal accidents locations in 2019
Fatal accidents locations in 2020
Fatal accidents locations in 2021
Alcohol use - People drinking some alcohol every month (%)
Alcohol use - People not drinking at all (%)
Alcohol use - Average days/month drinking alcohol
Alcohol use - Average drinks/week
Alcohol use - Average days/year people drink much
Audiometry - Average condition of hearing (%)
Audiometry - People that can hear a whisper from across a quiet room (%)
Audiometry - People that can hear normal voice from across a quiet room (%)
Audiometry - Ears ringing, roaring, buzzing (%)
Audiometry - Had a job exposure to loud noise (%)
Audiometry - Had off-work exposure to loud noise (%)
Blood Pressure & Cholesterol - Has high blood pressure (%)
Blood Pressure & Cholesterol - Checking blood pressure at home (%)
Blood Pressure & Cholesterol - Frequently checking blood cholesterol (%)
Blood Pressure & Cholesterol - Has high cholesterol level (%)
Consumer Behavior - Money monthly spent on food at supermarket/grocery store
Consumer Behavior - Money monthly spent on food at other stores
Consumer Behavior - Money monthly spent on eating out
Consumer Behavior - Money monthly spent on carryout/delivered foods
Consumer Behavior - Income spent on food at supermarket/grocery store (%)
Consumer Behavior - Income spent on food at other stores (%)
Consumer Behavior - Income spent on eating out (%)
Consumer Behavior - Income spent on carryout/delivered foods (%)
Current Health Status - General health condition (%)
Current Health Status - Blood donors (%)
Current Health Status - Has blood ever tested for HIV virus (%)
Current Health Status - Left-handed people (%)
Dermatology - People using sunscreen (%)
Diabetes - Diabetics (%)
Diabetes - Had a blood test for high blood sugar (%)
Diabetes - People taking insulin (%)
Diet Behavior & Nutrition - Diet health (%)
Diet Behavior & Nutrition - Milk product consumption (# of products/month)
Diet Behavior & Nutrition - Meals not home prepared (#/week)
Diet Behavior & Nutrition - Meals from fast food or pizza place (#/week)
Diet Behavior & Nutrition - Ready-to-eat foods (#/month)
Diet Behavior & Nutrition - Frozen meals/pizza (#/month)
Drug Use - People that ever used marijuana or hashish (%)
Drug Use - Ever used hard drugs (%)
Drug Use - Ever used any form of cocaine (%)
Drug Use - Ever used heroin (%)
Drug Use - Ever used methamphetamine (%)
Health Insurance - People covered by health insurance (%)
Kidney Conditions-Urology - Avg. # of times urinating at night
Medical Conditions - People with asthma (%)
Medical Conditions - People with anemia (%)
Medical Conditions - People with psoriasis (%)
Medical Conditions - People with overweight (%)
Medical Conditions - Elderly people having difficulties in thinking or remembering (%)
Medical Conditions - People who ever received blood transfusion (%)
Medical Conditions - People having trouble seeing even with glass/contacts (%)
Medical Conditions - People with arthritis (%)
Medical Conditions - People with gout (%)
Medical Conditions - People with congestive heart failure (%)
Medical Conditions - People with coronary heart disease (%)
Medical Conditions - People with angina pectoris (%)
Medical Conditions - People who ever had heart attack (%)
Medical Conditions - People who ever had stroke (%)
Medical Conditions - People with emphysema (%)
Medical Conditions - People with thyroid problem (%)
Medical Conditions - People with chronic bronchitis (%)
Medical Conditions - People with any liver condition (%)
Medical Conditions - People who ever had cancer or malignancy (%)
Mental Health - People who have little interest in doing things (%)
Mental Health - People feeling down, depressed, or hopeless (%)
Mental Health - People who have trouble sleeping or sleeping too much (%)
Mental Health - People feeling tired or having little energy (%)
Mental Health - People with poor appetite or overeating (%)
Mental Health - People feeling bad about themself (%)
Mental Health - People who have trouble concentrating on things (%)
Mental Health - People moving or speaking slowly or too fast (%)
Mental Health - People having thoughts they would be better off dead (%)
Oral Health - Average years since last visit a dentist
Oral Health - People embarrassed because of mouth (%)
Oral Health - People with gum disease (%)
Oral Health - General health of teeth and gums (%)
Oral Health - Average days a week using dental floss/device
Oral Health - Average days a week using mouthwash for dental problem
Oral Health - Average number of teeth
Pesticide Use - Households using pesticides to control insects (%)
Pesticide Use - Households using pesticides to kill weeds (%)
Physical Activity - People doing vigorous-intensity work activities (%)
Physical Activity - People doing moderate-intensity work activities (%)
Physical Activity - People walking or bicycling (%)
Physical Activity - People doing vigorous-intensity recreational activities (%)
Physical Activity - People doing moderate-intensity recreational activities (%)
Physical Activity - Average hours a day doing sedentary activities
Physical Activity - Average hours a day watching TV or videos
Physical Activity - Average hours a day using computer
Physical Functioning - People having limitations keeping them from working (%)
Physical Functioning - People limited in amount of work they can do (%)
Physical Functioning - People that need special equipment to walk (%)
Physical Functioning - People experiencing confusion/memory problems (%)
Physical Functioning - People requiring special healthcare equipment (%)
Prescription Medications - Average number of prescription medicines taking
Preventive Aspirin Use - Adults 40+ taking low-dose aspirin (%)
Reproductive Health - Vaginal deliveries (%)
Reproductive Health - Cesarean deliveries (%)
Reproductive Health - Deliveries resulted in a live birth (%)
Reproductive Health - Pregnancies resulted in a delivery (%)
Reproductive Health - Women breastfeeding newborns (%)
Reproductive Health - Women that had a hysterectomy (%)
Reproductive Health - Women that had both ovaries removed (%)
Reproductive Health - Women that have ever taken birth control pills (%)
Reproductive Health - Women taking birth control pills (%)
Reproductive Health - Women that have ever used Depo-Provera or injectables (%)
Reproductive Health - Women that have ever used female hormones (%)
Sexual Behavior - People 18+ that ever had sex (vaginal, anal, or oral) (%)
Sexual Behavior - Males 18+ that ever had vaginal sex with a woman (%)
Sexual Behavior - Males 18+ that ever performed oral sex on a woman (%)
Sexual Behavior - Males 18+ that ever had anal sex with a woman (%)
Sexual Behavior - Males 18+ that ever had any sex with a man (%)
Sexual Behavior - Females 18+ that ever had vaginal sex with a man (%)
Sexual Behavior - Females 18+ that ever performed oral sex on a man (%)
Sexual Behavior - Females 18+ that ever had anal sex with a man (%)
Sexual Behavior - Females 18+ that ever had any kind of sex with a woman (%)
Sexual Behavior - Average age people first had sex
Sexual Behavior - Average number of female sex partners in lifetime (males 18+)
Sexual Behavior - Average number of female vaginal sex partners in lifetime (males 18+)
Sexual Behavior - Average age people first performed oral sex on a woman (18+)
Sexual Behavior - Average number of woman performed oral sex on in lifetime (18+)
Sexual Behavior - Average number of male sex partners in lifetime (males 18+)
Sexual Behavior - Average number of male anal sex partners in lifetime (males 18+)
Sexual Behavior - Average age people first performed oral sex on a man (18+)
Sexual Behavior - Average number of male oral sex partners in lifetime (18+)
Sexual Behavior - People using protection when performing oral sex (%)
Sexual Behavior - Average number of times people have vaginal or anal sex a year
Sexual Behavior - People having sex without condom (%)
Sexual Behavior - Average number of male sex partners in lifetime (females 18+)
Sexual Behavior - Average number of male vaginal sex partners in lifetime (females 18+)
Sexual Behavior - Average number of female sex partners in lifetime (females 18+)
Sexual Behavior - Circumcised males 18+ (%)
Sleep Disorders - Average hours sleeping at night
Sleep Disorders - People that has trouble sleeping (%)
Smoking-Cigarette Use - People smoking cigarettes (%)
Taste & Smell - People 40+ having problems with smell (%)
Taste & Smell - People 40+ having problems with taste (%)
Taste & Smell - People 40+ that ever had wisdom teeth removed (%)
Taste & Smell - People 40+ that ever had tonsils teeth removed (%)
Taste & Smell - People 40+ that ever had a loss of consciousness because of a head injury (%)
Taste & Smell - People 40+ that ever had a broken nose or other serious injury to face or skull (%)
Taste & Smell - People 40+ that ever had two or more sinus infections (%)
Weight - Average height (inches)
Weight - Average weight (pounds)
Weight - Average BMI
Weight - People that are obese (%)
Weight - People that ever were obese (%)
Weight - People trying to lose weight (%)
Urban population: 37,672
Rural population: 8,559
Estimated median house/condo value in 2022: $462,680
93611:
$462,680California:
$715,900
According to our research of California and other state lists, there were 36 registered sex offenders living in 93611 zip code as of May 28, 2024 . The ratio of all residents to sex offenders in zip code 93611 is 1,352 to 1.The ratio of registered sex offenders to all residents in this zip code is lower than the state average.
Median resident age: This zip code:
38.8 yearsCalifornia median age:
37.9 years
Average household size: This zip code:
3.0 peopleCalifornia:
2.8 people
Averages for the 2020 tax year for zip code 93611, filed in 2021:
Average Adjusted Gross Income (AGI) in 2020: $81,030 (Individual Income Tax Returns) Here:
$81,030State:
$95,910
Salary/wage: $69,860 (reported on 80.3% of returns )Here:
$69,860State:
$77,331
(% of AGI for various income ranges: 1192.5% for AGIs below $25k , 3659.0% for AGIs $25k-50k , 6994.1% for AGIs $50k-75k , 10161.6% for AGIs $75k-100k , 20729.4% for AGIs $100k-200k , 68912.9% for AGIs over 200k ) Taxable interest for individuals: $829 (reported on 45.9% of returns )This zip code:
$829California:
$2,294
(% of AGI for various income ranges: 13.0% for AGIs below $25k , 18.6% for AGIs $25k-50k , 40.6% for AGIs $50k-75k , 59.3% for AGIs $75k-100k , 113.8% for AGIs $100k-200k , 686.9% for AGIs over 200k ) Ordinary dividends: $4,534 (reported on 17.6% of returns )(% of AGI for various income ranges: 22.7% for AGIs below $25k , 36.3% for AGIs $25k-50k , 72.5% for AGIs $50k-75k , 131.2% for AGIs $75k-100k , 204.9% for AGIs $100k-200k , 1724.0% for AGIs over 200k ) Net capital gain/loss in AGI: +$17,029 (reported on 17.7% of returns )Here:
+$17,029State:
+$49,306
(% of AGI for various income ranges: 9.7% for AGIs below $25k , 31.6% for AGIs $25k-50k , 70.9% for AGIs $50k-75k , 127.7% for AGIs $75k-100k , 419.7% for AGIs $100k-200k , 12386.7% for AGIs over 200k ) Profit/loss from business: +$14,657 (reported on 16.3% of returns )Here:
+$14,657State:
+$15,671
(% of AGI for various income ranges: 113.1% for AGIs below $25k , 226.8% for AGIs $25k-50k , 349.0% for AGIs $50k-75k , 219.3% for AGIs $75k-100k , 527.8% for AGIs $100k-200k , 4390.5% for AGIs over 200k ) Taxable individual retirement arrangement distribution: $18,002 (reported on 8.5% of returns )93611:
$18,002California:
$23,505
(% of AGI for various income ranges: 51.6% for AGIs below $25k , 110.9% for AGIs $25k-50k , 209.3% for AGIs $50k-75k , 254.7% for AGIs $75k-100k , 579.2% for AGIs $100k-200k , 1501.0% for AGIs over 200k ) Self-employed (Keogh) retirement plans: $18,964 (reported on 0.5% of returns )93611:
$18,964California:
$30,163
(% of AGI for various income ranges: 5.6% for AGIs $25k-50k , 22.5% for AGIs $100k-200k , 326.4% for AGIs over 200k ) Total itemized deductions: $31,853 (reported on 14.9% of returns )Here:
$31,853State:
$39,517
(% of AGI for various income ranges: 83.1% for AGIs below $25k , 160.9% for AGIs $25k-50k , 484.6% for AGIs $50k-75k , 886.4% for AGIs $75k-100k , 1803.3% for AGIs $100k-200k , 7244.3% for AGIs over 200k ) Charity contributions: $9,575 (reported on 12.5% of returns )(% of AGI for various income ranges: 5.0% for AGIs below $25k , 18.0% for AGIs $25k-50k , 72.4% for AGIs $50k-75k , 146.9% for AGIs $75k-100k , 406.8% for AGIs $100k-200k , 2951.9% for AGIs over 200k ) Taxes paid: $8,278 (reported on 14.8% of returns )(% of AGI for various income ranges: 14.8% for AGIs below $25k , 35.4% for AGIs $25k-50k , 129.1% for AGIs $50k-75k , 267.4% for AGIs $75k-100k , 535.0% for AGIs $100k-200k , 1430.7% for AGIs over 200k ) Earned income credit: $2,004 (reported on 11.1% of returns )(% of AGI for various income ranges: 70.2% for AGIs below $25k , 66.9% for AGIs $25k-50k , 1.2% for AGIs $50k-75k ) Percentage of individuals using paid preparers for their 2020 taxes: 93.0%(% for various income ranges: 92.4% for AGIs below $25k , 93.5% for AGIs $25k-50k , 92.4% for AGIs $50k-75k , 92.2% for AGIs $75k-100k , 93.9% for AGIs $100k-200k , 93.3% for AGIs over 200k )
Averages for the 2012 tax year for zip code 93611, filed in 2013:
Average Adjusted Gross Income (AGI) in 2012: $66,846 (Individual Income Tax Returns) Here:
$66,846State:
$72,726
Salary/wage: $58,870 (reported on 83.3% of returns )Here:
$58,870State:
$59,079
(% of AGI for various income ranges: 70.1% for AGIs below $25k , 73.3% for AGIs $25k-50k , 74.7% for AGIs $50k-75k , 76.0% for AGIs $75k-100k , 80.5% for AGIs $100k-200k , 56.1% for AGIs over 200k ) Taxable interest for individuals: $869 (reported on 47.4% of returns )This zip code:
$869California:
$2,146
(% of AGI for various income ranges: 1.2% for AGIs below $25k , 0.6% for AGIs $25k-50k , 0.6% for AGIs $50k-75k , 0.4% for AGIs $75k-100k , 0.4% for AGIs $100k-200k , 1.1% for AGIs over 200k ) Ordinary dividends: $3,143 (reported on 18.0% of returns )(% of AGI for various income ranges: 1.6% for AGIs below $25k , 1.0% for AGIs $25k-50k , 0.9% for AGIs $50k-75k , 0.8% for AGIs $75k-100k , 0.6% for AGIs $100k-200k , 1.0% for AGIs over 200k ) Net capital gain/loss in AGI: +$3,743 (reported on 14.8% of returns )Here:
+$3,743State:
+$30,460
(% of AGI for various income ranges: 0.1% for AGIs $50k-75k , 0.3% for AGIs $75k-100k , 0.8% for AGIs $100k-200k , 3.0% for AGIs over 200k ) Profit/loss from business: +$16,278 (reported on 16.7% of returns )Here:
+$16,278State:
+$17,064
(% of AGI for various income ranges: 9.1% for AGIs below $25k , 5.8% for AGIs $25k-50k , 3.3% for AGIs $50k-75k , 3.1% for AGIs $75k-100k , 2.8% for AGIs $100k-200k , 5.4% for AGIs over 200k ) Taxable individual retirement arrangement distribution: $14,665 (reported on 9.4% of returns )93611:
$14,665California:
$19,557
(% of AGI for various income ranges: 3.2% for AGIs below $25k , 2.3% for AGIs $25k-50k , 2.4% for AGIs $50k-75k , 2.0% for AGIs $75k-100k , 1.9% for AGIs $100k-200k , 1.7% for AGIs over 200k ) Self-employment retirement plans: $16,046 (reported on 0.7% of returns )93611:
$16,046California:
$24,530
(% of AGI for various income ranges: 0.2% for AGIs $50k-75k , 0.2% for AGIs $100k-200k , 0.4% for AGIs over 200k ) Total itemized deductions: $24,791 (23% of AGI, reported on 46.2% of returns )Here:
$24,791State:
$34,004
Here:
23.2% of AGIState:
22.7% of AGI
(% of AGI for various income ranges: 12.8% for AGIs below $25k , 14.1% for AGIs $25k-50k , 17.4% for AGIs $50k-75k , 17.9% for AGIs $75k-100k , 18.7% for AGIs $100k-200k , 16.2% for AGIs over 200k ) Charity contributions: $3,668 (reported on 39.8% of returns )(% of AGI for various income ranges: 0.9% for AGIs below $25k , 1.3% for AGIs $25k-50k , 2.1% for AGIs $50k-75k , 2.3% for AGIs $75k-100k , 2.6% for AGIs $100k-200k , 2.3% for AGIs over 200k ) Taxes paid: $8,732 (reported on 46.1% of returns )93611:
$8,732State:
$14,448
(% of AGI for various income ranges: 2.4% for AGIs below $25k , 3.0% for AGIs $25k-50k , 4.6% for AGIs $50k-75k , 5.3% for AGIs $75k-100k , 6.9% for AGIs $100k-200k , 9.2% for AGIs over 200k ) Earned income credit: $2,152 (reported on 14.1% of returns )(% of AGI for various income ranges: 5.7% for AGIs below $25k , 1.2% for AGIs $25k-50k ) Percentage of individuals using paid preparers for their 2012 taxes: 55.4%(% for various income ranges: 47.4% for AGIs below $25k , 52.8% for AGIs $25k-50k , 58.4% for AGIs $50k-75k , 59.8% for AGIs $75k-100k , 62.6% for AGIs $100k-200k , 78.7% for AGIs over 200k )
Averages for the 2004 tax year for zip code 93611, filed in 2005:
Average Adjusted Gross Income (AGI) in 2004: $61,145 (Individual Income Tax Returns) Here:
$61,145State:
$58,600
Salary/wage: $54,544 (reported on 84.9% of returns )Here:
$54,544State:
$49,455
(% of AGI for various income ranges: 148.7% for AGIs below $10k , 71.7% for AGIs $10k-25k , 76.1% for AGIs $25k-50k , 82.1% for AGIs $50k-75k , 84.5% for AGIs $75k-100k , 68.8% for AGIs over 100k ) Taxable interest for individuals: $1,201 (reported on 60.4% of returns )This zip code:
$1,201California:
$2,365
(% of AGI for various income ranges: 7.1% for AGIs below $10k , 2.5% for AGIs $10k-25k , 1.4% for AGIs $25k-50k , 1.1% for AGIs $50k-75k , 0.7% for AGIs $75k-100k , 1.1% for AGIs over 100k ) Taxable dividends: $1,993 (reported on 24.1% of returns )(% of AGI for various income ranges: 6.0% for AGIs below $10k , 1.8% for AGIs $10k-25k , 0.9% for AGIs $25k-50k , 0.6% for AGIs $50k-75k , 0.5% for AGIs $75k-100k , 0.8% for AGIs over 100k ) Net capital gain/loss: +$10,503 (reported on 20.8% of returns )Here:
+$10,503State:
+$23,418
(% of AGI for various income ranges: -0.1% for AGIs below $10k , 0.4% for AGIs $10k-25k , 0.4% for AGIs $25k-50k , 0.8% for AGIs $50k-75k , 1.1% for AGIs $75k-100k , 6.9% for AGIs over 100k ) Profit/loss from business: +$19,426 (reported on 18.3% of returns )Here:
+$19,426State:
+$16,826
(% of AGI for various income ranges: 13.3% for AGIs below $10k , 7.6% for AGIs $10k-25k , 6.6% for AGIs $25k-50k , 4.4% for AGIs $50k-75k , 3.6% for AGIs $75k-100k , 6.8% for AGIs over 100k ) IRA payment deduction: $3,271 (reported on 2.9% of returns )93611:
$3,271California:
$3,192
(% of AGI for various income ranges: 0.2% for AGIs below $10k , 0.2% for AGIs $10k-25k , 0.3% for AGIs $25k-50k , 0.2% for AGIs $50k-75k , 0.1% for AGIs $75k-100k , 0.1% for AGIs over 100k ) Self-employed pension: $14,900 (reported on 1.3% of returns )Here:
$14,900California:
$17,688
(% of AGI for various income ranges: 0.1% for AGIs $25k-50k , 0.2% for AGIs $50k-75k , 0.1% for AGIs $75k-100k , 0.5% for AGIs over 100k ) Total itemized deductions: $23,850 (26% of AGI, reported on 54.8% of returns )Here:
$23,850State:
$28,113
Here:
25.7% of AGIState:
25.3% of AGI
(% of AGI for various income ranges: 27.2% for AGIs below $10k , 16.0% for AGIs $10k-25k , 23.4% for AGIs $25k-50k , 28.1% for AGIs $50k-75k , 22.7% for AGIs $75k-100k , 18.1% for AGIs over 100k ) Charity contributions deductions: $3,283 (3% of AGI, reported on 49.9% of returns )Here:
3.4% of AGIState:
3.3% of AGI
(% of AGI for various income ranges: 1.3% for AGIs below $10k , 1.4% for AGIs $10k-25k , 2.3% for AGIs $25k-50k , 2.8% for AGIs $50k-75k , 2.9% for AGIs $75k-100k , 2.8% for AGIs over 100k ) Total tax: $9,098 (reported on 80.9% of returns )93611:
$9,098State:
$10,761
(% of AGI for various income ranges: 6.4% for AGIs below $10k , 4.7% for AGIs $10k-25k , 6.6% for AGIs $25k-50k , 7.7% for AGIs $50k-75k , 9.1% for AGIs $75k-100k , 17.2% for AGIs over 100k ) Earned income credit: $1,663 (reported on 9.4% of returns )Percentage of individuals using paid preparers for their 2004 taxes: 59.1%(% for various income ranges: 46.8% for AGIs below $10k , 53.5% for AGIs $10k-25k , 59.8% for AGIs $25k-50k , 63.1% for AGIs $50k-75k , 63.5% for AGIs $75k-100k , 69.0% for AGIs over 100k )
Estimated median household income in 2022: This zip code:
$113,234California:
$91,551
Nearest zip codes: 93612 ,
93727 ,
93710 ,
93726 ,
93720 ,
93703 .
Tarpey Village Zip Code Map
Percentage of family households: This zip code:
55.8%California:
46.8%
Percentage of households with unmarried partners: This zip code:
6.6%California:
48.1%
Likely homosexual households (counted as self-reported same-sex unmarried-partner households)
Lesbian couples: 0.1% of all households Gay men: 0.1% of all households
Household received Food Stamps/SNAP in the past 12 months: 1,300Household did not receive Food Stamps/SNAP in the past 12 months: 14,037
Women who had a birth in the past 12 months: 598 (477 now married , 119 unmarried) Women who did not have a birth in the past 12 months: 9,912 (4,576 now married , 5,309 unmarried)
Housing units in zip code 93611 with a mortgage: 8,927 (644
second mortgage , 47
home equity loan , 491
both second mortgage and home equity loan )
Houses without a mortgage: 243
Median monthly owner costs for units with a mortgage: $2,152
Median monthly owner costs for units without a mortgage: $748
Residents with income below the poverty level in 2022:
This zip code:
5.4%Whole state:
12.2%
Residents with income below 50% of the poverty level in 2022:
This zip code:
2.2%Whole state:
6.2%
Median number of rooms in houses and condos: Median number of rooms in apartments:
Year house built (houses)
121 2020 or later1,565 2010 to 20194,136 2000 to 20094,306 1990 to 19992,675 1980 to 19892,449 1970 to 1979367 1960 to 1969121 1950 to 195966 1940 to 1949232 1939 or earlier
Zip code 93611 household income distribution in 2022 318 Less than $10,000137 $10,000 to $14,999194 $15,000 to $19,999283 $20,000 to $24,999325 $25,000 to $29,999387 $30,000 to $34,999426 $35,000 to $39,999246 $40,000 to $44,999348 $45,000 to $49,999720 $50,000 to $59,9991,229 $60,000 to $74,9991,955 $75,000 to $99,9992,050 $100,000 to $124,9991,367 $125,000 to $149,9992,624 $150,000 to $199,9992,817 $200,000 or moreEstimate of home value of owner-occupied houses/condos in 2022 in zip code 93611 21 Less than $10,00015 $25,000 to $29,99939 $40,000 to $49,99957 $50,000 to $59,99912 $100,000 to $124,99921 $150,000 to $174,99922 $175,000 to $199,999382 $200,000 to $249,999563 $250,000 to $299,9992,807 $300,000 to $399,9993,021 $400,000 to $499,9992,810 $500,000 to $749,999312 $750,000 to $999,99930 $1,000,000 to $1,499,99944 $1,500,000 to $1,999,999181 $2,000,000 or moreRent paid by renters in 2022 in zip code 93611 16 $450 to $49917 $600 to $64918 $700 to $74948 $750 to $79972 $800 to $89939 $900 to $999400 $1,000 to $1,249685 $1,250 to $1,4991,446 $1,500 to $1,999525 $2,000 to $2,499188 $2,500 to $2,99963 $3,000 to $3,49973 $3,500 or more140 No cash rent
Median gross rent in 2022: $1,997.
Median price asked for vacant for-sale houses and condos in 2022: $402,328.
Estimated median house (or condo) value in 2022 for: White Non-Hispanic householders: $469,247Black or African American householders: $381,188American Indian or Alaska Native householders: $406,262Asian householders: $441,784Some other race householders: $389,546Two or more races householders: $426,859Hispanic or Latino householders: $416,113Estimated median house or condo value in 2022: $462,680
93611:
$462,680California:
$715,900
Lower value quartile - upper value quartile: $376,616 - $579,652
Mean price in 2022: Detached houses: $430,053Here:
$430,053State:
$988,808
Townhouses or other attached units: $327,946Here:
$327,946State:
$838,546
In 2-unit structures: $266,681Here:
$266,681State:
$1,138,100
In 3-to-4-unit structures: $960,808Here:
$960,808State:
$824,253
In 5-or-more-unit structures: $465,677Here:
$465,677State:
$730,996
Mobile homes: $134,403Here:
$134,403State:
$184,506
Occupied boats, RVs, vans, etc.: $236,377Here:
$236,377State:
$204,957
Housing units in structures:
One, detached: 13,547One, attached: 409Two: 583 or 4: 4105 to 9: 64010 to 19: 10320 to 49: 10650 or more: 722Mobile homes: 40Boats, RVs, vans, etc.: 19Unemployment : 4.9%
Means of transportation to work in zip code 93611 74.5% 16,055 Drove a car alone10.0% 2,152 Carpooled0.2% 51 Bus or trolley bus0.0% 9 Taxi0.1% 20 Motorcycle0.0% 6 Bicycle0.8% 166 Walked0.3% 70 Other means13.7% 2,947 Worked at homeTravel time to work (commute) in zip code 93611 361 Less than 5 minutes2,210 5 to 9 minutes1,949 10 to 14 minutes3,669 15 to 19 minutes3,482 20 to 24 minutes1,900 25 to 29 minutes2,221 30 to 34 minutes325 35 to 39 minutes278 40 to 44 minutes1,003 45 to 59 minutes507 60 to 89 minutes499 90 or more minutes
Percentage of zip code residents living and working in this county: 93.5%
Household type by relationship:
Households: 46,232
Male householders: 7,920 (920 living alone ), Female householders: 7,561 (1,551 living alone )9,641 spouses (9,574 opposite-sex spouses ), 706 unmarried partners , (692 opposite-sex unmarried partners ), 14,885 children (13,809 natural , 253 adopted , 815 stepchildren ), 1,138 grandchildren , 497 brothers or sisters , 925 parents , 16 foster children , 806 other relatives , 1,629 non-relatives In group quarters: 437 (-1 institutionalized population )
Size of family households: 5,060 2-persons , 2,438 3-persons , 2,668 4-persons , 1,225 5-persons , 654 6-persons , 309 7-or-more-persons
Size of nonfamily households: 2,476 1-person , 394 2-persons , 135 3-persons , 31 4-persons , 22 5-persons
7,934 married couples with children. single-parent households (811 men , 1,438 women ).
77.6% of residents of 93611 zip code speak English at home. of residents speak Spanish at home (67% very well, 22% well, 10% not well, 1% not at all ).of residents speak other Indo-European language at home (74% very well, 16% well, 6% not well, 4% not at all ).of residents speak Asian or Pacific Island language at home (56% very well, 28% well, 12% not well, 3% not at all ).of residents speak other language at home (93% very well, 7% well ).
Foreign born population: 5,758 (12.5%)
(73.4%
of them are naturalized citizens )
This zip code:
12.5%Whole state:
26.7%
22% Honduras 9% Malaysia 8% Bhutan 7% Indonesia 6% Thailand 5% Japan 4% Liberia 9% English 6% German 5% Irish 3% American 3% Italian 3% European 2% Nigerian
Year of entry for the foreign-born population
1,240 2010 or later 1,093 2000 to 2009 1,112 1990 to 1999 2,755 Before 1990
There are
199 Medical Specialists in Zip Code 93611 .
Major facilities with environmental interests located in this zip code:
NAPPORN AUTOMOTIVE (141 SUNNYSIDE in CLOVIS, CA)
STATE MASTER (California - Hazardous Waste Tracking) - HAZARDOU WASTE PROGRAM Small Quantity Generators, between 100 kg and 1000 kg of hazardous waste/month (Resource Conservation and Recovery Act (tracking hazardous waste)) - notification Alternative names: NOPPORN AUTOMOTIVE
ALTA SIERRA INTERMEDIATE (380 W. TEAGUE AVE. in CLOVIS, CA)
(National Center for Education Statistics) - STATE ID-6109912 Organizations: CLOVIS UNIFIED (SCHOOL DISTRICT)
ENTERPRISE ALTERNATIVE (IND. ST.) (1550 HERNDON in CLOVIS, CA)
(National Center for Education Statistics) - STATE ID-1030469 Organizations: CLOVIS UNIFIED (SCHOOL DISTRICT)
EXCEL HIGH (1685 DAVID E. COOK WAY in CLOVIS, CA)
(National Center for Education Statistics) - STATE ID-1030634 Organizations: CLOVIS UNIFIED (SCHOOL DISTRICT)
FREEDOM ELEMENTARY (2955 GETTYSBURG AVE. in CLOVIS, CA)
(National Center for Education Statistics) - STATE ID-6120091 Organizations: CLOVIS UNIFIED (SCHOOL DISTRICT)
GARFIELD ELEMENTARY (1315 N. PEACH AVE. in CLOVIS, CA)
(National Center for Education Statistics) - STATE ID-6110258 Organizations: CLOVIS UNIFIED (SCHOOL DISTRICT)
GATEWAY HIGH (CONT.) (5689 E. HERNDON AVE. in CLOVIS, CA)
(National Center for Education Statistics) - STATE ID-1031004 Organizations: CLOVIS UNIFIED (SCHOOL DISTRICT)
GETTYSBURG ELEMENTARY (2100 GETTYSBURG in CLOVIS, CA)
(National Center for Education Statistics) - STATE ID-6106660 Organizations: CLOVIS UNIFIED (SCHOOL DISTRICT)
JEFFERSON ELEMENTARY (1880 FOWLER AVE. in CLOVIS, CA)
(National Center for Education Statistics) - STATE ID-6005870 Organizations: CLOVIS UNIFIED (SCHOOL DISTRICT)
CENTURY ELEMENTARY (965 N. SUNNYSIDE AVE. in CLOVIS, CA)
(National Center for Education Statistics) - STATE ID-6117550 Organizations: CLOVIS UNIFIED (SCHOOL DISTRICT)
MIRAMONTE ELEMENTARY (1590 BELLAIRE in CLOVIS, CA)
(National Center for Education Statistics) - STATE ID-6097026 Organizations: CLOVIS UNIFIED (SCHOOL DISTRICT)
CEDARWOOD ELEMENTARY (2851 PALO ALTO AVE. in CLOVIS, CA)
(National Center for Education Statistics) - STATE ID-6113575 Organizations: CLOVIS UNIFIED (SCHOOL DISTRICT)
ECONO LUBE N TUNE NO 110 (2121 VILLA AVE in CLOVIS, CA)
Small Quantity Generators, between 100 kg and 1000 kg of hazardous waste/month (Resource Conservation and Recovery Act (tracking hazardous waste)) - notification Organizations: WATERS MARK (CONTACT/OWNER)
Housing units lacking complete plumbing facilities: 1.1%
Housing units lacking complete kitchen facilities: 2.7%
64.4% Utility gas 30.0% Electricity 3.3% Solar energy 1.7% Bottled, tank, or LP gas
Place of birth for U.S.-born residents:
This state: 32,446Northeast: 738Midwest: 2,479South: 1,890West: 2,333
58% of the 93611 zip code residents lived in the same house 5 years ago.
Out of people who lived in different houses, 72% lived in this county.
Out of people who lived in different counties, 50% lived in California.
89% of the 93611 zip code residents lived in the same house 1 year ago.
Out of people who lived in different houses, 69% moved from this county.
Out of people who lived in different houses, 23% moved from different county within same state.
Out of people who lived in different houses, 4% moved from different state.
Out of people who lived in different houses, 0% moved from abroad.
Private vs. public school enrollment:
Students in private schools in grades 1 to 8 (elementary and middle school): 292
Here:
5.0%California:
10.5%
Students in private schools in grades 9 to 12 (high school): 137
Students in private undergraduate colleges: 369
Here:
12.2%California:
15.9%
Occupation by median earnings in the past 12 months ($)
128,644 Legal occupations 110,098 Law enforcement workers including supervisors 100,891 Management occupations 97,802 Health diagnosing and treating practitioners and other technical occupations 91,833 Architecture and engineering occupations 86,988 Life, physical, and social science occupations
Companies with federal contracts located in this zip code:
J L ENTERPRISES (1098 ARROYO AVE in CLOVIS, CA; small business) in 6 contracts from 2003 to 2006
Contracts for Miscellaneous Items, Other Professional Services, Food Services by ArmySigned by year: 2000: $0; 2001: $0; 2002: $0; 2003: $1,980; 2004: $4,860; 2005: $9,831; 2006: $7,583.
Biggest contracts: with Army for Miscellaneous Items. Signed on 2005-01-12. Completion date: 2005-01-23.
with Army for Other Professional Services. Signed on 2006-03-24. Completion date: 2006-04-02.
with Army for Miscellaneous Items. Signed on 2004-05-26. Completion date: 2004-06-06.
, same as above. Signed on 2005-09-07. Completion date: 2005-09-11.
OWENS SEPTIC SERVICE (1495 TOLLHOUSE RD in CLOVIS, CA; small business)
$16,975 with Army for Operation of Government-Owned Facilities -- Sewage and Waste Facilities. Signed on 2006-04-13. Completion date: 2006-09-30.
Top industries in this zip code by the number of employees in 2005:
Accommodation and Food Services: Limited-Service Restaurants (20-49 employees: 7 establishments, 10-19 employees: 7 establishments, 5-9 employees: 3 establishments, 1-4 employees: 12 establishments)Construction: Plumbing, Heating, and Air-Conditioning Contractors (100-249: 1, 20-49: 1, 10-19: 2, 5-9: 1, 1-4: 4)Other Services (except Public Administration): Religious Organizations (50-99: 1, 20-49: 2, 10-19: 2, 5-9: 2, 1-4: 7)Construction: Drywall and Insulation Contractors (50-99: 1, 10-19: 6, 5-9: 2, 1-4: 3)Health Care and Social Assistance: Offices of Physicians (except Mental Health Specialists) (50-99: 1, 10-19: 2, 5-9: 4, 1-4: 25)Professional, Scientific, and Technical Services: Administrative Management and General Management Consulting Services (100-249: 1, 1-4: 5)Construction: Water and Sewer Line and Related Structures Construction (50-99: 1, 20-49: 1, 5-9: 1, 1-4: 1)Construction: Painting and Wall Covering Contractors (20-49: 2, 10-19: 1, 5-9: 2, 1-4: 9)
People in group quarters in 2010:
166 people in nursing facilities/skilled-nursing facilities
51 people in group homes intended for adults
28 people in group homes for juveniles (non-correctional)
24 people in workers' group living quarters and job corps centers
6 people in in-patient hospice facilities
6 people in residential treatment centers for adults
People in group quarters in 2000:
178 people in nursing homes
143 people in other noninstitutional group quarters
29 people in schools, hospitals, or wards for the intellectually disabled
18 people in homes for the mentally retarded
Fatal accident statistics in 2014:
Fatal accident count: 1Vehicles involved in fatal accidents: 2Fatal accidents caused by drunken drivers: 1Fatalities: 1Persons involved in fatal accidents: 3Pedestrians involved in fatal accidents: 0
Fatal accident statistics in 2013:
Fatal accident count: 1Vehicles involved in fatal accidents: 1Fatal accidents caused by drunken drivers: 0Fatalities: 1Persons involved in fatal accidents: 1Pedestrians involved in fatal accidents: 0
Home Mortgage Disclosure Act Aggregated Statistics For Year 2009(Based on 10 full and 16 partial tracts) A) FHA, FSA/RHS & VA B) Conventional C) Refinancings D) Home Improvement Loans E) Loans on Dwellings For 5+ Families F) Non-occupant Loans on G) Loans On Manufactured Number Average Value Number Average Value Number Average Value Number Average Value Number Average Value Number Average Value Number Average Value
LOANS ORIGINATED 963 $245,724 832 $241,417 2,221 $233,025 129 $146,947 1 $1,200,000 218 $178,930 17 $136,169 APPLICATIONS APPROVED, NOT ACCEPTED 63 $252,535 93 $236,125 257 $246,455 13 $140,817 1 $170,940 30 $207,855 4 $123,870 APPLICATIONS DENIED 97 $251,087 112 $302,865 810 $264,423 54 $105,837 0 $0 70 $186,404 8 $80,672 APPLICATIONS WITHDRAWN 88 $241,111 128 $282,823 475 $248,402 23 $126,504 0 $0 46 $194,290 6 $143,753 FILES CLOSED FOR INCOMPLETENESS 13 $222,642 17 $263,930 129 $271,253 9 $115,230 0 $0 7 $141,841 1 $7,150
Aggregated Statistics For Year 2008(Based on 10 full and 16 partial tracts) A) FHA, FSA/RHS & VA B) Conventional C) Refinancings D) Home Improvement Loans E) Loans on Dwellings For 5+ Families F) Non-occupant Loans on G) Loans On Manufactured Number Average Value Number Average Value Number Average Value Number Average Value Number Average Value Number Average Value Number Average Value
LOANS ORIGINATED 470 $269,711 1,148 $274,487 1,279 $246,155 164 $95,692 3 $7,071,313 256 $213,319 13 $115,725 APPLICATIONS APPROVED, NOT ACCEPTED 35 $275,850 220 $278,491 349 $273,065 38 $103,482 0 $0 62 $240,140 9 $87,859 APPLICATIONS DENIED 79 $255,041 230 $286,174 1,073 $299,926 154 $111,170 0 $0 115 $241,429 16 $119,378 APPLICATIONS WITHDRAWN 45 $275,000 176 $266,136 390 $282,910 34 $127,530 0 $0 50 $214,807 2 $103,940 FILES CLOSED FOR INCOMPLETENESS 3 $337,300 40 $271,861 115 $312,631 8 $122,125 0 $0 10 $220,879 0 $0
Aggregated Statistics For Year 2007(Based on 10 full and 16 partial tracts) A) FHA, FSA/RHS & VA B) Conventional C) Refinancings D) Home Improvement Loans E) Loans on Dwellings For 5+ Families F) Non-occupant Loans on G) Loans On Manufactured Number Average Value Number Average Value Number Average Value Number Average Value Number Average Value Number Average Value Number Average Value
LOANS ORIGINATED 15 $270,613 2,093 $274,334 2,491 $276,473 539 $115,232 4 $860,430 400 $250,292 35 $140,373 APPLICATIONS APPROVED, NOT ACCEPTED 1 $186,510 454 $270,009 724 $292,865 123 $135,373 0 $0 90 $243,369 13 $110,057 APPLICATIONS DENIED 4 $232,778 615 $291,118 1,786 $317,874 299 $159,759 0 $0 203 $314,425 35 $111,664 APPLICATIONS WITHDRAWN 5 $273,986 269 $304,089 786 $302,693 74 $146,124 0 $0 90 $274,368 8 $134,114 FILES CLOSED FOR INCOMPLETENESS 0 $0 70 $296,612 262 $308,713 21 $139,060 0 $0 16 $265,068 2 $110,775
Aggregated Statistics For Year 2006(Based on 10 full and 16 partial tracts) A) FHA, FSA/RHS & VA B) Conventional C) Refinancings D) Home Improvement Loans E) Loans on Dwellings For 5+ Families F) Non-occupant Loans on G) Loans On Manufactured Number Average Value Number Average Value Number Average Value Number Average Value Number Average Value Number Average Value Number Average Value
LOANS ORIGINATED 9 $277,730 3,198 $281,024 3,759 $276,855 780 $132,116 5 $3,750,572 611 $262,125 36 $151,089 APPLICATIONS APPROVED, NOT ACCEPTED 0 $0 601 $265,023 772 $291,361 184 $110,027 0 $0 150 $254,030 6 $145,995 APPLICATIONS DENIED 0 $0 755 $300,676 1,656 $304,291 351 $144,345 0 $0 166 $261,460 27 $147,123 APPLICATIONS WITHDRAWN 1 $328,450 509 $302,041 1,262 $304,064 160 $169,606 0 $0 111 $284,222 11 $152,895 FILES CLOSED FOR INCOMPLETENESS 1 $186,400 99 $309,368 281 $301,398 25 $155,818 0 $0 25 $320,105 0 $0
Aggregated Statistics For Year 2005(Based on 10 full and 16 partial tracts) A) FHA, FSA/RHS & VA B) Conventional C) Refinancings D) Home Improvement Loans E) Loans on Dwellings For 5+ Families F) Non-occupant Loans on G) Loans On Manufactured Number Average Value Number Average Value Number Average Value Number Average Value Number Average Value Number Average Value Number Average Value
LOANS ORIGINATED 2 $315,390 4,046 $269,049 4,973 $258,611 883 $130,415 4 $1,817,500 872 $241,668 66 $108,849 APPLICATIONS APPROVED, NOT ACCEPTED 3 $224,057 671 $267,932 757 $260,044 184 $128,448 0 $0 163 $236,318 20 $76,098 APPLICATIONS DENIED 1 $181,510 879 $280,045 1,506 $262,396 338 $133,282 0 $0 192 $261,217 44 $120,779 APPLICATIONS WITHDRAWN 2 $241,075 627 $296,104 1,721 $261,065 202 $180,494 0 $0 148 $257,236 17 $128,522 FILES CLOSED FOR INCOMPLETENESS 0 $0 109 $272,043 277 $283,443 50 $91,720 0 $0 15 $244,141 2 $98,615
Aggregated Statistics For Year 2004(Based on 10 full and 16 partial tracts) A) FHA, FSA/RHS & VA B) Conventional C) Refinancings D) Home Improvement Loans E) Loans on Dwellings For 5+ Families F) Non-occupant Loans on G) Loans On Manufactured Number Average Value Number Average Value Number Average Value Number Average Value Number Average Value Number Average Value Number Average Value
LOANS ORIGINATED 12 $211,907 4,141 $227,104 4,996 $212,740 712 $98,917 3 $548,187 750 $193,001 39 $116,630 APPLICATIONS APPROVED, NOT ACCEPTED 0 $0 574 $227,309 834 $212,359 130 $95,279 0 $0 107 $203,878 17 $84,974 APPLICATIONS DENIED 3 $100,130 531 $246,952 1,541 $219,553 380 $112,914 1 $479,170 131 $188,979 38 $78,753 APPLICATIONS WITHDRAWN 1 $162,180 461 $218,602 1,583 $214,049 181 $105,392 0 $0 110 $194,638 16 $106,295 FILES CLOSED FOR INCOMPLETENESS 0 $0 184 $239,853 305 $235,059 43 $71,669 0 $0 34 $195,981 5 $89,942
Aggregated Statistics For Year 2003(Based on 10 full and 16 partial tracts) A) FHA, FSA/RHS & VA B) Conventional C) Refinancings D) Home Improvement Loans E) Loans on Dwellings For 5+ Families F) Non-occupant Loans on Number Average Value Number Average Value Number Average Value Number Average Value Number Average Value Number Average Value
LOANS ORIGINATED 59 $176,869 3,726 $198,165 9,269 $171,109 441 $44,575 1 $4,995,000 690 $148,143 APPLICATIONS APPROVED, NOT ACCEPTED 3 $132,087 355 $201,823 1,119 $164,563 132 $61,364 0 $0 73 $168,919 APPLICATIONS DENIED 5 $152,326 416 $185,599 1,766 $173,176 195 $45,508 1 $728,210 98 $162,362 APPLICATIONS WITHDRAWN 4 $143,680 304 $199,754 1,534 $176,491 40 $73,531 0 $0 71 $139,661 FILES CLOSED FOR INCOMPLETENESS 0 $0 106 $208,391 353 $178,907 37 $46,122 0 $0 20 $140,886
Aggregated Statistics For Year 2002(Based on 4 full and 10 partial tracts) A) FHA, FSA/RHS & VA B) Conventional C) Refinancings D) Home Improvement Loans E) Loans on Dwellings For 5+ Families F) Non-occupant Loans on Number Average Value Number Average Value Number Average Value Number Average Value Number Average Value Number Average Value
LOANS ORIGINATED 119 $120,448 1,020 $152,573 2,664 $137,068 144 $34,678 6 $863,148 245 $110,434 APPLICATIONS APPROVED, NOT ACCEPTED 9 $94,754 88 $146,926 297 $138,101 62 $29,579 0 $0 29 $119,073 APPLICATIONS DENIED 13 $105,369 101 $146,099 546 $131,416 65 $34,264 0 $0 19 $116,923 APPLICATIONS WITHDRAWN 13 $107,546 102 $149,716 510 $139,515 16 $30,904 0 $0 17 $109,883 FILES CLOSED FOR INCOMPLETENESS 1 $149,000 35 $181,079 113 $145,696 1 $29,170 0 $0 4 $97,258
Aggregated Statistics For Year 2001(Based on 4 full and 10 partial tracts) A) FHA, FSA/RHS & VA B) Conventional C) Refinancings D) Home Improvement Loans E) Loans on Dwellings For 5+ Families F) Non-occupant Loans on Number Average Value Number Average Value Number Average Value Number Average Value Number Average Value Number Average Value
LOANS ORIGINATED 184 $125,832 773 $141,566 1,569 $127,975 80 $30,400 5 $385,192 124 $97,322 APPLICATIONS APPROVED, NOT ACCEPTED 5 $131,396 52 $130,114 175 $113,607 37 $39,774 0 $0 19 $115,573 APPLICATIONS DENIED 12 $105,751 98 $99,634 498 $109,291 56 $26,017 1 $415,830 21 $86,137 APPLICATIONS WITHDRAWN 11 $150,468 83 $136,761 482 $120,845 21 $42,451 0 $0 23 $119,495 FILES CLOSED FOR INCOMPLETENESS 6 $111,293 18 $167,877 93 $134,918 3 $47,993 0 $0 9 $132,400
Aggregated Statistics For Year 2000(Based on 4 full and 10 partial tracts) A) FHA, FSA/RHS & VA B) Conventional C) Refinancings D) Home Improvement Loans E) Loans on Dwellings For 5+ Families F) Non-occupant Loans on Number Average Value Number Average Value Number Average Value Number Average Value Number Average Value Number Average Value
LOANS ORIGINATED 208 $114,116 600 $120,922 366 $90,770 163 $27,674 2 $131,080 74 $80,652 APPLICATIONS APPROVED, NOT ACCEPTED 7 $124,184 56 $119,397 84 $94,208 58 $30,255 0 $0 7 $73,683 APPLICATIONS DENIED 22 $117,302 95 $116,553 350 $91,718 96 $27,281 1 $109,000 19 $88,877 APPLICATIONS WITHDRAWN 18 $102,091 46 $135,095 176 $91,217 17 $33,775 1 $640,320 9 $69,323 FILES CLOSED FOR INCOMPLETENESS 8 $152,488 19 $117,899 51 $109,933 1 $23,500 0 $0 5 $111,250
Aggregated Statistics For Year 1999(Based on 3 full and 7 partial tracts) A) FHA, FSA/RHS & VA B) Conventional C) Refinancings D) Home Improvement Loans E) Loans on Dwellings For 5+ Families F) Non-occupant Loans on Number Average Value Number Average Value Number Average Value Number Average Value Number Average Value Number Average Value
LOANS ORIGINATED 232 $119,643 509 $139,407 770 $114,927 151 $24,806 5 $143,196 61 $95,830 APPLICATIONS APPROVED, NOT ACCEPTED 8 $112,169 53 $129,192 148 $118,991 63 $28,827 0 $0 6 $99,305 APPLICATIONS DENIED 36 $118,119 80 $128,061 414 $92,054 79 $24,392 2 $124,000 19 $92,874 APPLICATIONS WITHDRAWN 20 $109,236 65 $139,168 258 $113,222 11 $43,180 1 $94,850 12 $115,337 FILES CLOSED FOR INCOMPLETENESS 4 $96,542 11 $140,134 88 $112,379 1 $20,620 1 $43,920 2 $90,435
Private Mortgage Insurance Companies Aggregated Statistics For Year 2009(Based on 10 full and 14 partial tracts) A) Conventional B) Refinancings C) Non-occupant Loans on Number Average Value Number Average Value Number Average Value
LOANS ORIGINATED 138 $284,698 50 $310,193 1 $195,000 APPLICATIONS APPROVED, NOT ACCEPTED 33 $290,797 6 $324,025 0 $0 APPLICATIONS DENIED 24 $281,179 12 $325,363 1 $195,000 APPLICATIONS WITHDRAWN 10 $201,779 7 $324,046 0 $0 FILES CLOSED FOR INCOMPLETENESS 4 $344,470 0 $0 2 $301,940
Aggregated Statistics For Year 2008(Based on 10 full and 16 partial tracts) A) Conventional B) Refinancings C) Non-occupant Loans on D) Loans On Manufactured Number Average Value Number Average Value Number Average Value Number Average Value
LOANS ORIGINATED 390 $303,408 76 $313,971 17 $277,311 1 $337,140 APPLICATIONS APPROVED, NOT ACCEPTED 129 $322,330 70 $316,321 4 $230,392 0 $0 APPLICATIONS DENIED 32 $317,382 10 $303,490 8 $309,152 0 $0 APPLICATIONS WITHDRAWN 22 $302,193 3 $294,000 4 $301,938 0 $0 FILES CLOSED FOR INCOMPLETENESS 8 $281,772 4 $267,690 4 $230,752 1 $127,200
Aggregated Statistics For Year 2007(Based on 10 full and 16 partial tracts) A) Conventional B) Refinancings C) Non-occupant Loans on D) Loans On Manufactured Number Average Value Number Average Value Number Average Value Number Average Value
LOANS ORIGINATED 221 $320,907 93 $338,868 14 $282,450 3 $260,370 APPLICATIONS APPROVED, NOT ACCEPTED 41 $367,328 34 $363,963 5 $315,660 1 $171,520 APPLICATIONS DENIED 5 $469,496 10 $478,994 0 $0 0 $0 APPLICATIONS WITHDRAWN 10 $325,969 11 $440,635 2 $297,000 0 $0 FILES CLOSED FOR INCOMPLETENESS 0 $0 0 $0 0 $0 0 $0
Aggregated Statistics For Year 2006(Based on 10 full and 16 partial tracts) A) Conventional B) Refinancings C) Non-occupant Loans on D) Loans On Manufactured Number Average Value Number Average Value Number Average Value Number Average Value
LOANS ORIGINATED 91 $347,247 62 $354,277 16 $294,465 1 $210,820 APPLICATIONS APPROVED, NOT ACCEPTED 15 $408,387 13 $309,166 4 $278,078 0 $0 APPLICATIONS DENIED 5 $422,894 5 $381,870 3 $421,697 0 $0 APPLICATIONS WITHDRAWN 3 $467,517 5 $384,046 1 $243,280 0 $0 FILES CLOSED FOR INCOMPLETENESS 3 $318,477 2 $300,985 0 $0 0 $0
Aggregated Statistics For Year 2005(Based on 10 full and 14 partial tracts) A) Conventional B) Refinancings C) Non-occupant Loans on D) Loans On Manufactured Number Average Value Number Average Value Number Average Value Number Average Value
LOANS ORIGINATED 193 $335,959 83 $303,201 40 $321,204 3 $101,833 APPLICATIONS APPROVED, NOT ACCEPTED 51 $337,431 18 $270,170 8 $260,725 0 $0 APPLICATIONS DENIED 3 $364,000 0 $0 0 $0 0 $0 APPLICATIONS WITHDRAWN 13 $335,695 7 $240,496 3 $276,650 1 $207,950 FILES CLOSED FOR INCOMPLETENESS 0 $0 0 $0 0 $0 0 $0
Aggregated Statistics For Year 2004(Based on 10 full and 16 partial tracts) A) Conventional B) Refinancings C) Non-occupant Loans on D) Loans On Manufactured Number Average Value Number Average Value Number Average Value Number Average Value
LOANS ORIGINATED 500 $271,777 155 $254,149 92 $232,753 20 $201,600 APPLICATIONS APPROVED, NOT ACCEPTED 97 $262,002 52 $211,069 22 $228,300 0 $0 APPLICATIONS DENIED 7 $201,943 0 $0 6 $184,600 0 $0 APPLICATIONS WITHDRAWN 18 $278,019 19 $267,867 0 $0 0 $0 FILES CLOSED FOR INCOMPLETENESS 8 $253,175 0 $0 2 $189,190 2 $189,190
Aggregated Statistics For Year 2003(Based on 10 full and 16 partial tracts) A) Conventional B) Refinancings C) Non-occupant Loans on Number Average Value Number Average Value Number Average Value
LOANS ORIGINATED 888 $225,023 407 $195,937 94 $182,310 APPLICATIONS APPROVED, NOT ACCEPTED 99 $219,366 109 $194,524 11 $146,425 APPLICATIONS DENIED 11 $230,664 8 $211,281 1 $317,000 APPLICATIONS WITHDRAWN 31 $230,694 21 $185,673 2 $122,475 FILES CLOSED FOR INCOMPLETENESS 0 $0 0 $0 0 $0
Aggregated Statistics For Year 2002(Based on 4 full and 10 partial tracts) A) Conventional B) Refinancings C) Non-occupant Loans on Number Average Value Number Average Value Number Average Value
LOANS ORIGINATED 248 $179,959 202 $159,342 24 $122,355 APPLICATIONS APPROVED, NOT ACCEPTED 33 $170,085 45 $173,275 3 $81,087 APPLICATIONS DENIED 4 $159,282 3 $164,840 0 $0 APPLICATIONS WITHDRAWN 8 $134,654 4 $166,108 1 $166,000 FILES CLOSED FOR INCOMPLETENESS 0 $0 0 $0 0 $0
Aggregated Statistics For Year 2001(Based on 4 full and 10 partial tracts) A) Conventional B) Refinancings C) Non-occupant Loans on Number Average Value Number Average Value Number Average Value
LOANS ORIGINATED 238 $163,941 154 $154,252 13 $95,852 APPLICATIONS APPROVED, NOT ACCEPTED 18 $170,543 26 $155,150 2 $100,130 APPLICATIONS DENIED 5 $144,542 1 $127,760 0 $0 APPLICATIONS WITHDRAWN 2 $187,000 14 $176,283 0 $0 FILES CLOSED FOR INCOMPLETENESS 1 $185,000 0 $0 0 $0
Aggregated Statistics For Year 2000(Based on 4 full and 10 partial tracts) A) Conventional B) Refinancings C) Non-occupant Loans on Number Average Value Number Average Value Number Average Value
LOANS ORIGINATED 181 $153,140 47 $143,776 15 $93,257 APPLICATIONS APPROVED, NOT ACCEPTED 16 $158,808 10 $151,870 0 $0 APPLICATIONS DENIED 2 $178,750 2 $261,775 1 $57,760 APPLICATIONS WITHDRAWN 0 $0 2 $165,380 0 $0 FILES CLOSED FOR INCOMPLETENESS 1 $110,760 1 $102,100 0 $0
Aggregated Statistics For Year 1999(Based on 3 full and 7 partial tracts) A) Conventional B) Refinancings C) Non-occupant Loans on Number Average Value Number Average Value Number Average Value
LOANS ORIGINATED 221 $156,216 129 $143,128 10 $113,791 APPLICATIONS APPROVED, NOT ACCEPTED 13 $177,218 27 $149,627 2 $94,500 APPLICATIONS DENIED 7 $157,863 3 $155,440 1 $99,000 APPLICATIONS WITHDRAWN 3 $111,320 0 $0 0 $0 FILES CLOSED FOR INCOMPLETENESS 2 $112,225 2 $173,820 0 $0
2005 - 2018 National Fire Incident Reporting System (NFIRS) incidents See full 2006 National Fire Incident Reporting System statistics for zip code 93611, California
Most common first names in zip code 93611 among deceased individuals Name Count Lived (average)
Robert 61 72.4 years Mary 61 81.3 years John 49 76.6 years James 47 73.2 years William 44 75.4 years Dorothy 40 81.1 years Richard 34 69.6 years Charles 33 77.5 years Helen 29 84.7 years George 29 80.8 years
Most common last names in zip code 93611 among deceased individuals Last name Count Lived (average)
Johnson 24 78.0 years Brown 23 79.9 years Smith 21 80.1 years Davis 17 77.8 years Jones 17 70.7 years Thompson 16 79.1 years Allen 13 77.6 years Miller 12 79.9 years Scott 11 80.1 years Taylor 10 68.6 years
Businesses in zip code 93611
Name Count Name Count
AutoZone 1 Pizza Hut 1 Blockbuster 2 Qdoba Mexican Grill 1 CVS 3 Quiznos 3 Cold Stone Creamery 1 Safeway 2 FedEx 5 Starbucks 3 H&R Block 3 Subway 2 Jack In The Box 1 T.J.Maxx 1 KFC 1 Taco Bell 2 Little Caesars Pizza 1 The Room Place 1 Long John Silver's 1 Toys"R"Us 1 OfficeMax 1 Trader Joe's 1 Panda Express 2 UPS 5 Papa John's Pizza 1 Vons 2 Penske 1 Walgreens 1
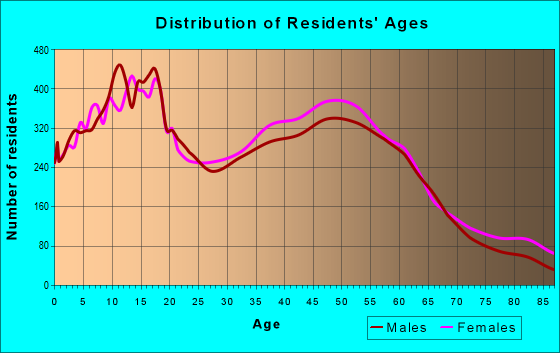
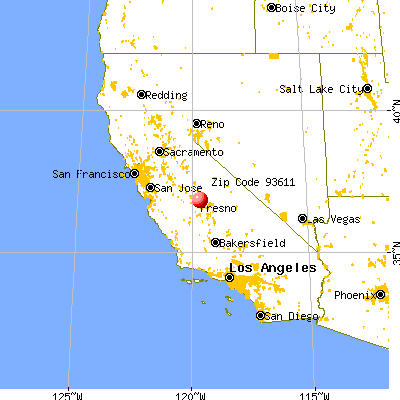


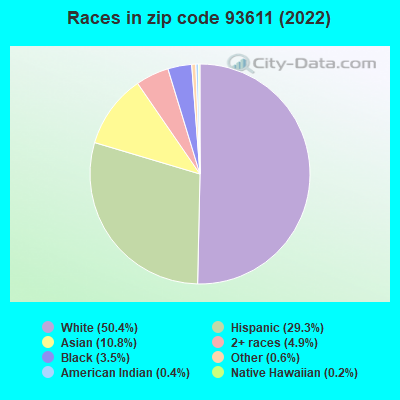


 Nearest zip codes: 93612, 93727, 93710, 93726, 93720, 93703.
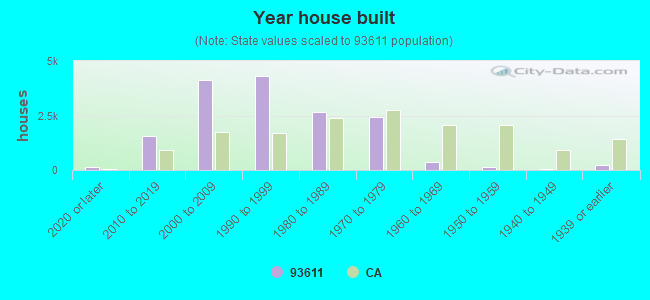

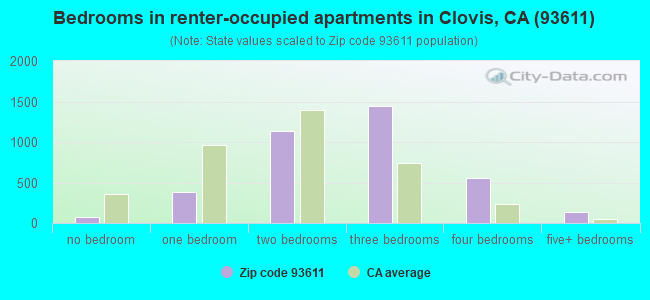
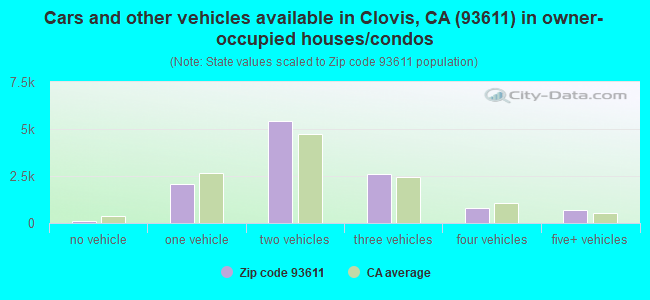
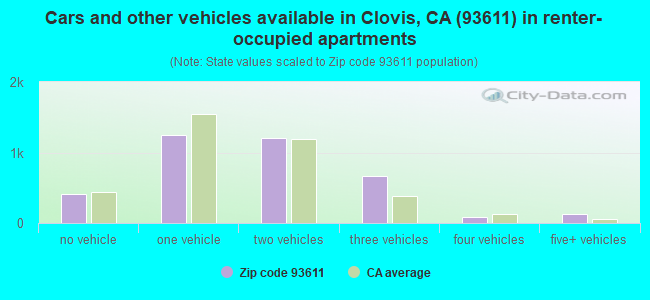


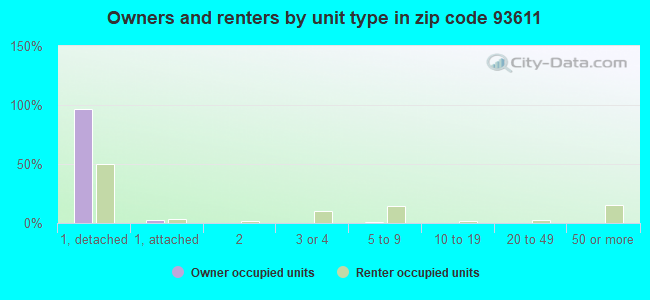
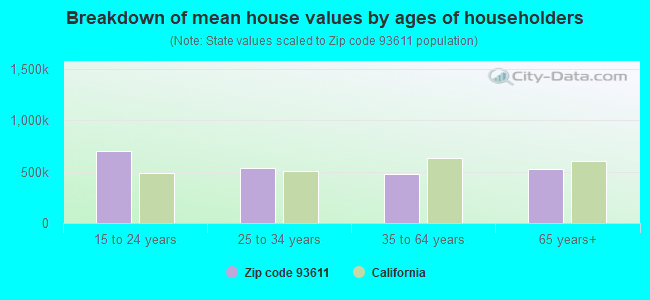


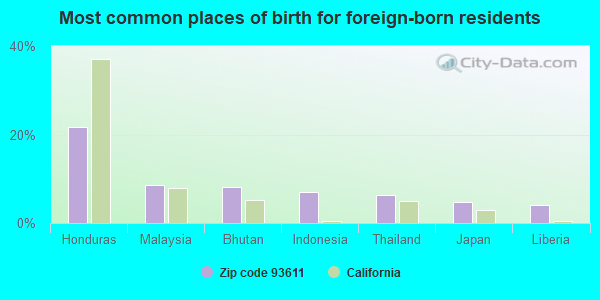
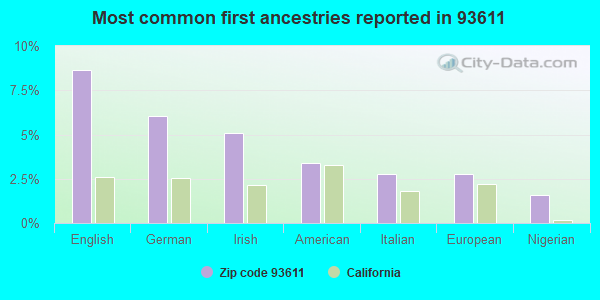
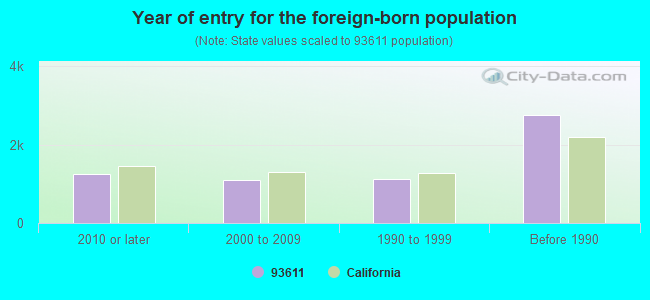


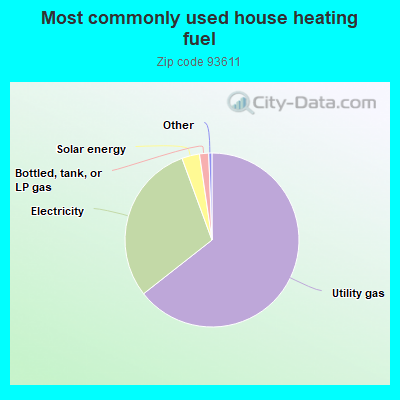
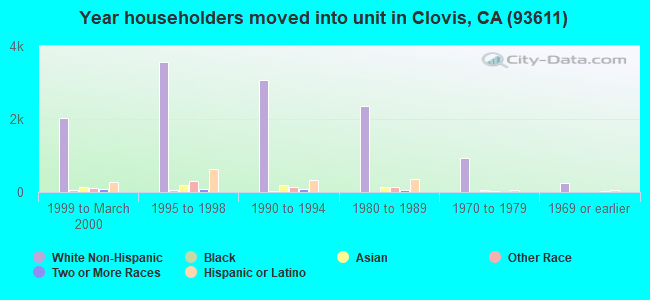
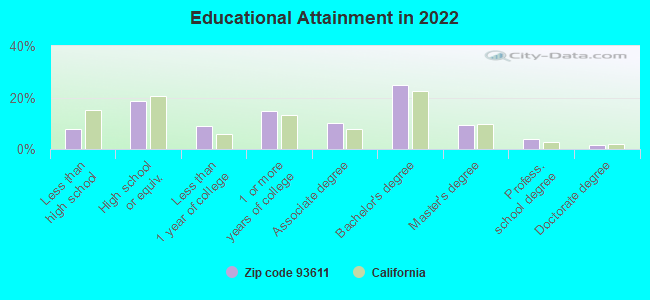
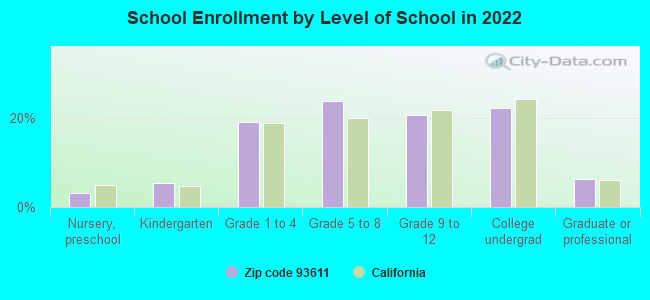
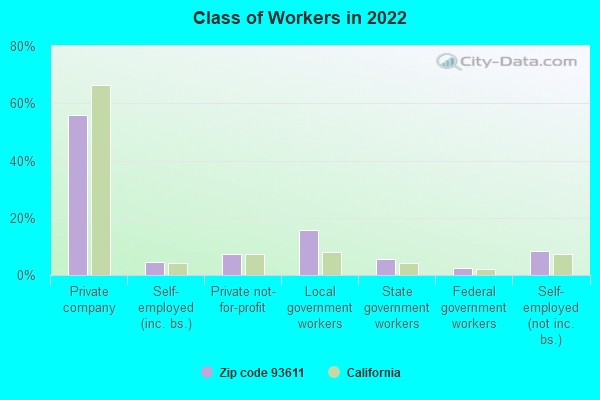
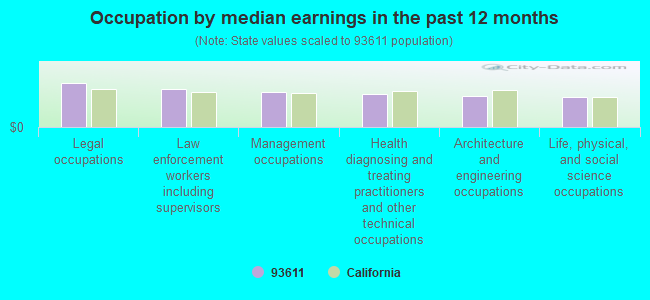
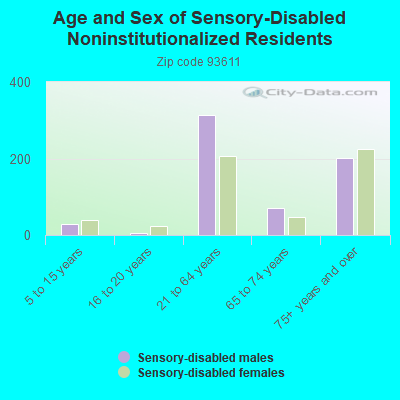

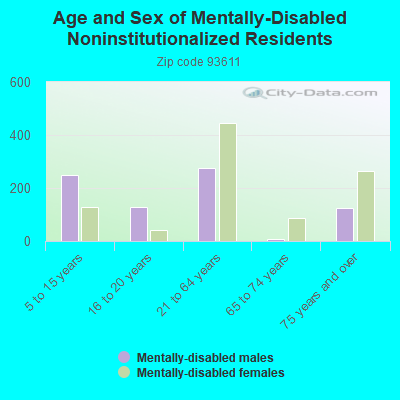
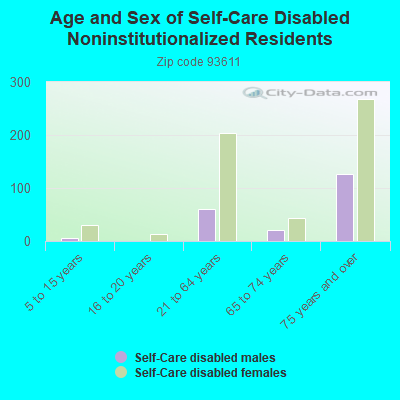
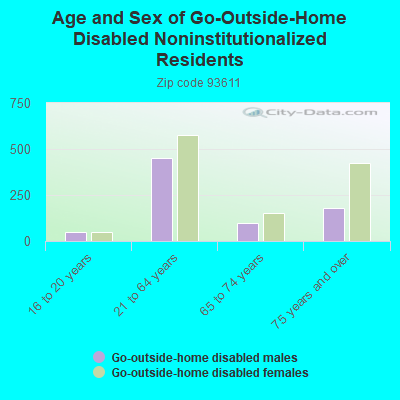
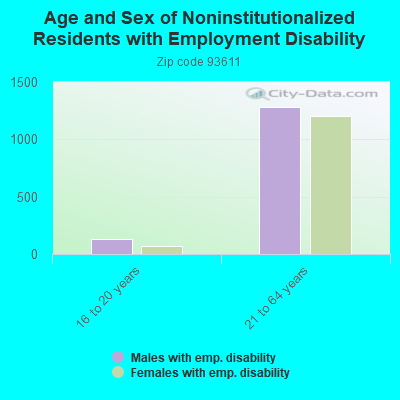

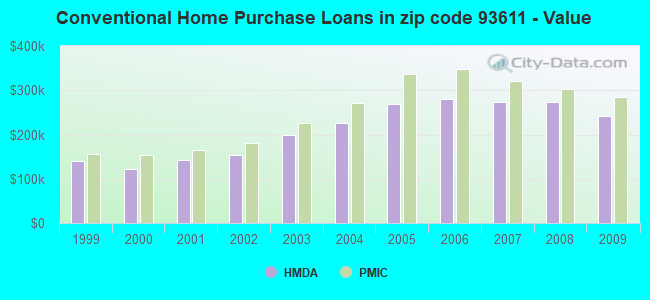
 According to the data from the years 2005 - 2018 the average number of fires per year is 91. The highest number of fire incidents - 128 took place in 2006, and the least - 44 in 2012. The data has a dropping trend.
 When looking into fire subcategories, the most incidents belonged to: Outside Fires (40.9%), and Structure Fires (39.4%).