Estimated zip code population in 2022: 2,145 Zip code population in 2010: 2,627 Zip code population in 2000: 1,957
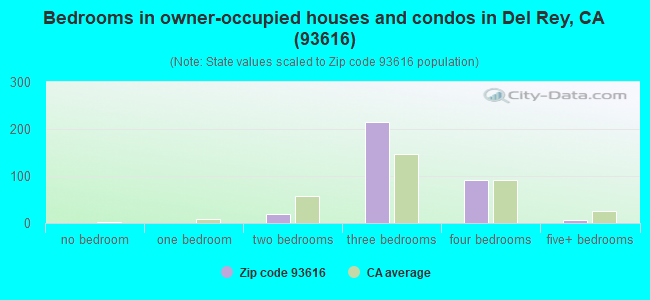
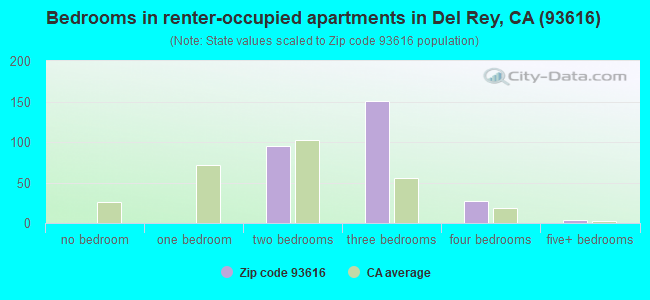
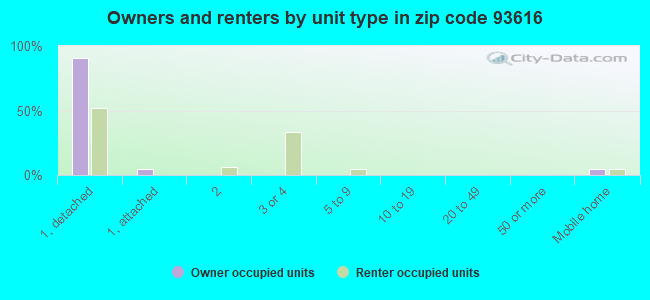
Houses and condos: 646 Renter-occupied apartments: 277
% of renters here:
45%
State:
44%
March 2022 cost of living index in zip code 93616: 94.4 (less than average, U.S. average is 100)
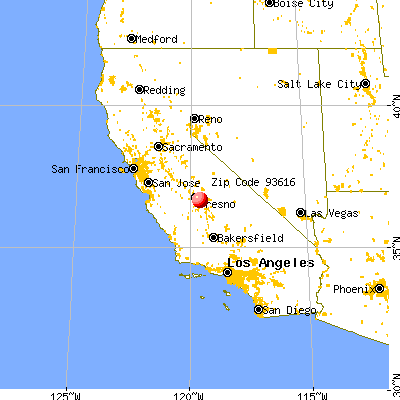
Land area: 13.9 sq. mi. Water area: 0.0 sq. mi.
Population density: 155 people per square mile
(very low).
OSM Map
General Map
Google Map
MSN Map
OSM Map
General Map
Google Map
MSN Map
OSM Map
General Map
Google Map
MSN Map
OSM Map
General Map
Google Map
MSN Map
Please wait while loading the map...
Real estate property taxes paid for housing units in 2022:
This zip code:
0.6% ($1,379)
California:
0.7% ($4,831)
Median real estate property taxes paid for housing units with mortgages in 2022: $1,423 (0.6%) Median real estate property taxes paid for housing units with no mortgage in 2022: $1,327 (0.6%)
Business Search- 14 Million verified businesses
Males: 1,089
(50.8%)
Females: 1,055
(49.2%)
For population 25 years and over in 93616:
High school or higher: 63.8%
Bachelor's degree or higher: 9.3%
Graduate or professional degree: 5.1%
Unemployed: 9.6%
Mean travel time to work (commute): 22.7 minutes
For population 15 years and over in 93616:
Never married: 32.7%
Now married: 52.5%
Separated: 1.1%
Widowed: 3.5%
Divorced: 10.2%
Zip code 93616 compared to state average:
Median household income below state average.
Median house value significantly below state average.
Unemployed percentage above state average.
Black race population percentage significantly below state average.
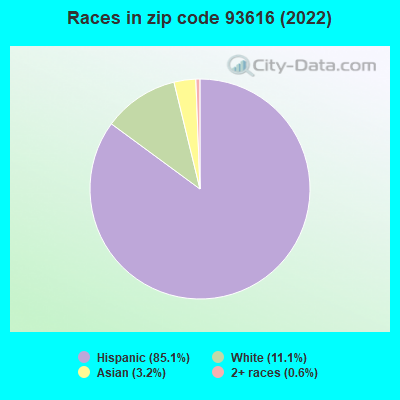
Hispanic race population percentage above state average.
Median age below state average.
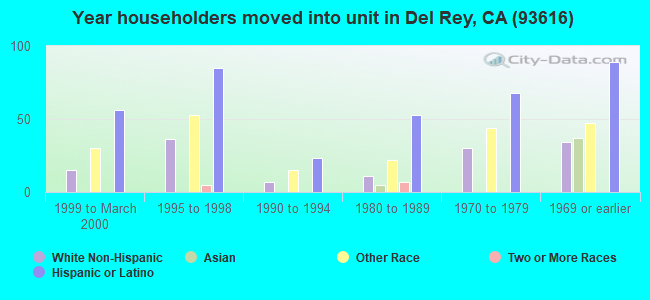
Length of stay since moving in significantly above state average.
Percentage of population with a bachelor's degree or higher significantly below state average.
Averages for the 2020 tax year for zip code 93616, filed in 2021:
Average Adjusted Gross Income (AGI) in 2020: $37,307 (Individual Income Tax Returns)
Here:
$37,307
State:
$95,910
Salary/wage: $32,754 (reported on 88.2% of returns)
Here:
$32,754
State:
$77,331
(% of AGI for various income ranges: 1825.0% for AGIs below $25k, 4373.2% for AGIs $25k-50k, 8553.8% for AGIs $50k-75k, 13350.0% for AGIs $75k-100k, 20716.7% for AGIs $100k-200k)
Taxable interest for individuals: $140 (reported on 13.6% of returns)
This zip code:
$140
California:
$2,294
(% of AGI for various income ranges: 1.1% for AGIs below $25k, 2.0% for AGIs $25k-50k, 5.0% for AGIs $50k-75k, 30.0% for AGIs $100k-200k)
Ordinary dividends: $4,333 (reported on 2.7% of returns)
Here:
$4,333
State:
$10,949
(% of AGI for various income ranges: 52.0% for AGIs $25k-50k)
Net capital gain/loss in AGI: +$8,250 (reported on 3.6% of returns)
Here:
+$8,250
State:
+$49,306
(% of AGI for various income ranges: 1650.0% for AGIs $75k-100k)
Profit/loss from business: +$3,267 (reported on 8.2% of returns)
Here:
+$3,267
State:
+$15,671
(% of AGI for various income ranges: 30.7% for AGIs below $25k, 52.4% for AGIs $25k-50k, 96.2% for AGIs $50k-75k)
Total itemized deductions: $31,880 (reported on 4.5% of returns)
Here:
$31,880
State:
$39,517
(% of AGI for various income ranges: 7970.0% for AGIs $75k-100k)
Charity contributions: $2,767 (reported on 2.7% of returns)
Here:
$2,767
State:
$12,598
(% of AGI for various income ranges: 103.8% for AGIs $50k-75k)
Taxes paid: $7,280 (reported on 4.5% of returns)
93616:
$7,280
State:
$8,807
(% of AGI for various income ranges: 68.8% for AGIs $25k-50k, 640.0% for AGIs $100k-200k)
Earned income credit: $2,532 (reported on 28.2% of returns)
Here:
$2,532
State:
$2,074
(% of AGI for various income ranges: 155.0% for AGIs below $25k, 140.4% for AGIs $25k-50k)
Percentage of individuals using paid preparers for their 2020 taxes: 89.1%
Here:
89%
State:
92%
(% for various income ranges: 83.7% for AGIs below $25k, 92.1% for AGIs $25k-50k, 92.3% for AGIs $50k-75k, 100.0% for AGIs $75k-100k, 100.0% for AGIs $100k-200k)
Averages for the 2012 tax year for zip code 93616, filed in 2013:
Average Adjusted Gross Income (AGI) in 2012: $29,960 (Individual Income Tax Returns)
Here:
$29,960
State:
$72,726
Salary/wage: $23,910 (reported on 91.0% of returns)
Here:
$23,910
State:
$59,079
(% of AGI for various income ranges: 78.5% for AGIs below $25k, 85.5% for AGIs $25k-50k, 82.2% for AGIs $50k-75k, 124.8% for AGIs $75k-100k)
Taxable interest for individuals: $213 (reported on 15.0% of returns)
This zip code:
$213
California:
$2,146
(% of AGI for various income ranges: 0.2% for AGIs $50k-75k, 0.2% for AGIs $100k-200k)
Ordinary dividends: $950 (reported on 4.0% of returns)
Here:
$950
State:
$9,308
Net capital gain/loss in AGI: +$7,200 (reported on 3.0% of returns)
Here:
+$7,200
State:
+$30,460
Profit/loss from business: +$9,744 (reported on 9.0% of returns)
Here:
+$9,744
State:
+$17,064
Taxable individual retirement arrangement distribution: $8,150 (reported on 2.0% of returns)
93616:
$8,150
California:
$19,557
Total itemized deductions: $24,189 (30% of AGI, reported on 9.0% of returns)
Here:
$24,189
State:
$34,004
Here:
30.0% of AGI
State:
22.7% of AGI
(% of AGI for various income ranges: 6.5% for AGIs $25k-50k, 12.8% for AGIs $50k-75k, 15.7% for AGIs $75k-100k, 11.5% for AGIs $100k-200k)
Charity contributions: $3,325 (reported on 8.0% of returns)
Here:
$3,325
State:
$4,659
Taxes paid: $6,867 (reported on 9.0% of returns)
93616:
$6,867
State:
$14,448
(% of AGI for various income ranges: 1.5% for AGIs $25k-50k, 3.2% for AGIs $50k-75k, 4.1% for AGIs $75k-100k, 4.5% for AGIs $100k-200k)
Earned income credit: $2,702 (reported on 43.0% of returns)
Here:
$2,702
State:
$2,286
(% of AGI for various income ranges: 10.8% for AGIs below $25k, 2.8% for AGIs $25k-50k)
Percentage of individuals using paid preparers for their 2012 taxes: 68.0%
Here:
68%
State:
64%
(% for various income ranges: 67.2% for AGIs below $25k, 70.0% for AGIs $25k-50k, 66.7% for AGIs $50k-75k, 66.7% for AGIs $75k-100k, 66.7% for AGIs $100k-200k)
Averages for the 2004 tax year for zip code 93616, filed in 2005:
Average Adjusted Gross Income (AGI) in 2004: $24,681 (Individual Income Tax Returns)
Here:
$24,681
State:
$58,600
Salary/wage: $22,592 (reported on 89.9% of returns)
Here:
$22,592
State:
$49,455
(% of AGI for various income ranges: 168.0% for AGIs below $10k, 83.7% for AGIs $10k-25k, 87.7% for AGIs $25k-50k, 80.6% for AGIs $50k-75k, 92.3% for AGIs $75k-100k, 47.5% for AGIs over 100k)
Taxable interest for individuals: $651 (reported on 22.0% of returns)
This zip code:
$651
California:
$2,365
(% of AGI for various income ranges: 4.1% for AGIs below $10k, 0.3% for AGIs $10k-25k, 0.4% for AGIs $25k-50k, 0.3% for AGIs $50k-75k, 0.2% for AGIs $75k-100k, 1.4% for AGIs over 100k)
Taxable dividends: $1,029 (reported on 7.7% of returns)
Here:
$1,029
State:
$4,746
(% of AGI for various income ranges: 1.6% for AGIs below $10k, 0.3% for AGIs $10k-25k, 0.4% for AGIs $25k-50k, 0.1% for AGIs $50k-75k, 0.4% for AGIs $75k-100k)
Net capital gain/loss: +$1,143 (reported on 4.7% of returns)
Here:
+$1,143
State:
+$23,418
Profit/loss from business: +$7,058 (reported on 7.8% of returns)
Here:
+$7,058
State:
+$16,826
(% of AGI for various income ranges: 11.0% for AGIs below $10k, 2.3% for AGIs $10k-25k, 3.1% for AGIs $25k-50k, 1.7% for AGIs $50k-75k)
Total itemized deductions: $16,614 (23% of AGI, reported on 9.9% of returns)
Here:
$16,614
State:
$28,113
Here:
23.4% of AGI
State:
25.3% of AGI
(% of AGI for various income ranges: 18.8% for AGIs below $10k, 5.6% for AGIs $25k-50k, 11.6% for AGIs $50k-75k, 14.9% for AGIs $75k-100k, 11.4% for AGIs over 100k)
Charity contributions deductions: $2,134 (3% of AGI, reported on 7.6% of returns)
Here:
$2,134
State:
$3,923
Here:
3.0% of AGI
State:
3.3% of AGI
Total tax: $3,525 (reported on 48.8% of returns)
93616:
$3,525
State:
$10,761
(% of AGI for various income ranges: 2.6% for AGIs below $10k, 2.1% for AGIs $10k-25k, 4.9% for AGIs $25k-50k, 9.1% for AGIs $50k-75k, 10.3% for AGIs $75k-100k, 18.4% for AGIs over 100k)
Earned income credit: $2,149 (reported on 44.1% of returns)
Here:
$2,149
State:
$1,763
Percentage of individuals using paid preparers for their 2004 taxes: 67.9%
Here:
68%
State:
66%
(% for various income ranges: 60.7% for AGIs below $10k, 70.0% for AGIs $10k-25k, 67.7% for AGIs $25k-50k, 73.1% for AGIs $50k-75k, 77.8% for AGIs $75k-100k, 85.0% for AGIs over 100k)
Household received Food Stamps/SNAP in the past 12 months: 220 Household did not receive Food Stamps/SNAP in the past 12 months: 420
Women who had a birth in the past 12 months: 22 (22 now married, 0 unmarried) Women who did not have a birth in the past 12 months: 544 (200 now married, 344 unmarried)
Housing units in zip code 93616 with a mortgage: 232 Median monthly owner costs for units with a mortgage: $1,477 Median monthly owner costs for units without a mortgage: $625
Residents with income below the poverty level in 2022:
This zip code:
28.7%
Whole state:
12.2%
Residents with income below 50% of the poverty level in 2022:
This zip code:
26.0%
Whole state:
6.2%
Median number of rooms in houses and condos:
Here:
5.6
State:
6.0
Median number of rooms in apartments:
Here:
4.9
State:
3.9
Notable locations in this zip code not listed on our city pages
Size of family households: 128 2-persons, 142 3-persons, 169 4-persons, 87 5-persons, 30 7-or-more-persons
Size of nonfamily households: 37 1-person, 5 2-persons
248 married couples with children.
302 single-parent households (16 men, 286 women).
27.2% of residents of 93616 zip code speak English at home.
72.8% of residents speak Spanish at home (44% very well, 27% well, 9% not well, 19% not at all).
1.1% of residents speak Asian or Pacific Island language at home (70% very well, 30% well).
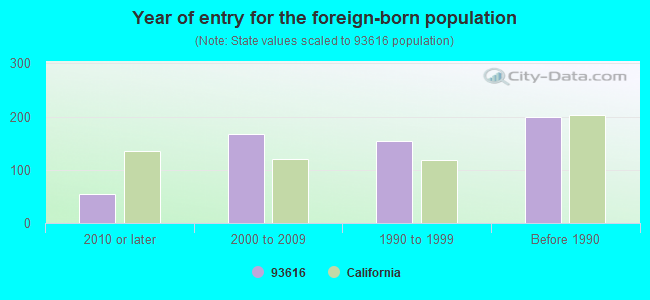
Foreign born population: 584 (27.2%) (27.7% of them are naturalized citizens)
This zip code:
27.2%
Whole state:
26.7%
97%Honduras
2%Indonesia
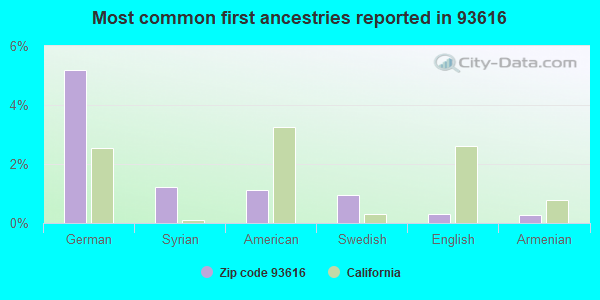
5%German
1%Syrian
1%American
1%Swedish
0%English
0%Armenian
Year of entry for the foreign-born population
542010 or later
1682000 to 2009
1551990 to 1999
200Before 1990
Housing units lacking complete kitchen facilities: 3.4%
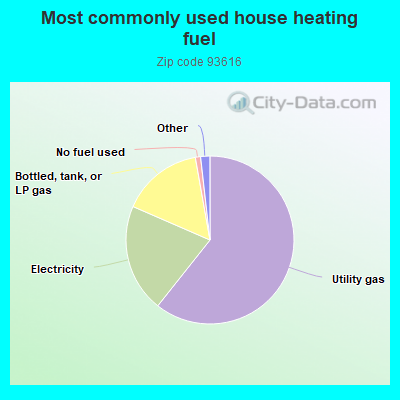
60.8%Utility gas
20.9%Electricity
15.7%Bottled, tank, or LP gas
1.0%No fuel used
0.8%Wood
0.5%Fuel oil, kerosene, etc.
0.5%Solar energy
Population in 1990: 1,923. Population change in the 1990s: +34 (+1.8%).
Place of birth for U.S.-born residents:
This state: 1,404
Northeast: 7
Midwest: 56
South: 89
67% of the 93616 zip code residents lived in the same house 5 years ago. Out of people who lived in different houses, 86% lived in this county.
101% of the 93616 zip code residents lived in the same house 1 year ago.
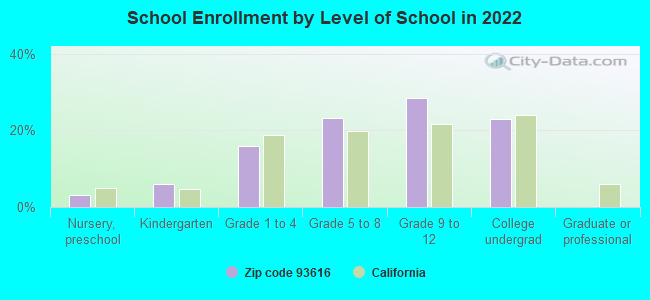
Private vs. public school enrollment:
Students in private schools in grades 1 to 8 (elementary and middle school):
Here:
0.0%
California:
10.5%
Students in private schools in grades 9 to 12 (high school):
Here:
0.0%
California:
8.5%
Students in private undergraduate colleges:
Here:
0.0%
California:
15.9%
Occupation by median earnings in the past 12 months ($)
53,706Sales and related occupations
47,814Health technologists and technicians
44,907Office and administrative support occupations
43,864Construction and extraction occupations
35,505Education, training, and library occupations
33,903Food preparation and serving related occupations
Top industries in this zip code by the number of employees in 2005:
Wholesale Trade: Other Grocery and Related Products Merchant Wholesalers (50-99 employees: 1 establishment, 10-19 employees: 1 establishment)
Accommodation and Food Services: Hotels (except Casino Hotels) and Motels (50-99: 1)
Mining: Drilling Oil and Gas Wells (20-49: 1)
Construction: Residential Remodelers (10-19: 1)
Management of Companies and Enterprises: Corporate, Subsidiary, and Regional Managing Offices (5-9: 1)
Other Services (except Public Administration): Commercial and Industrial Machinery and Equipment (except Automotive and Electronic) Repair and Maintenance (5-9: 1)
People in group quarters in 2010:
6 people in other noninstitutional facilities
Fatal accident statistics in 2014:
Fatal accident count: 1
Vehicles involved in fatal accidents: 2
Fatal accidents caused by drunken drivers: 0
Fatalities: 1
Persons involved in fatal accidents: 2
Pedestrians involved in fatal accidents: 0
Fatal accident statistics in 2013:
Fatal accident count: 1
Vehicles involved in fatal accidents: 2
Fatal accidents caused by drunken drivers: 0
Fatalities: 1
Persons involved in fatal accidents: 2
Pedestrians involved in fatal accidents: 0
Home Mortgage Disclosure Act Aggregated Statistics For Year 2009 (Based on 4 partial tracts)
A) FHA, FSA/RHS & VA Home Purchase Loans
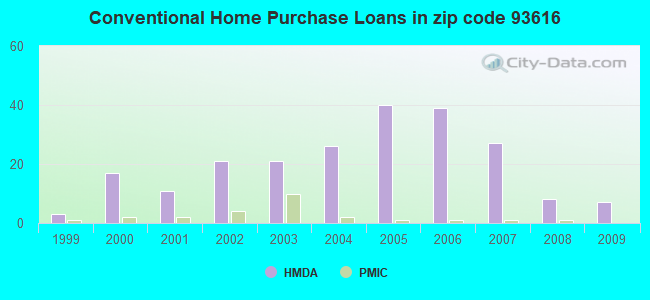
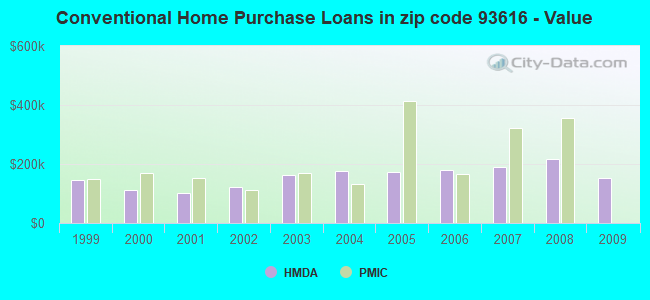
B) Conventional Home Purchase Loans
C) Refinancings
D) Home Improvement Loans
F) Non-occupant Loans on < 5 Family Dwellings (A B C & D)
G) Loans On Manufactured Home Dwelling (A B C & D)
Number
Average Value
Number
Average Value
Number
Average Value
Number
Average Value
Number
Average Value
Number
Average Value
LOANS ORIGINATED
4
$186,110
7
$151,511
22
$206,132
2
$103,770
4
$113,728
0
$0
APPLICATIONS APPROVED, NOT ACCEPTED
0
$0
0
$0
2
$209,070
0
$0
1
$83,890
0
$0
APPLICATIONS DENIED
4
$126,558
3
$130,597
24
$210,053
2
$68,280
6
$109,308
1
$296,430
APPLICATIONS WITHDRAWN
1
$209,550
0
$0
9
$217,106
1
$12,330
0
$0
0
$0
FILES CLOSED FOR INCOMPLETENESS
0
$0
0
$0
2
$155,875
0
$0
0
$0
0
$0
Aggregated Statistics For Year 2008 (Based on 4 partial tracts)
A) FHA, FSA/RHS & VA Home Purchase Loans
B) Conventional Home Purchase Loans
C) Refinancings
D) Home Improvement Loans
F) Non-occupant Loans on < 5 Family Dwellings (A B C & D)
Number
Average Value
Number
Average Value
Number
Average Value
Number
Average Value
Number
Average Value
LOANS ORIGINATED
7
$155,801
8
$217,616
24
$185,857
4
$117,910
7
$156,456
APPLICATIONS APPROVED, NOT ACCEPTED
2
$131,655
2
$258,510
4
$185,800
2
$110,110
1
$161,960
APPLICATIONS DENIED
3
$202,103
3
$262,580
29
$187,677
9
$50,730
5
$182,218
APPLICATIONS WITHDRAWN
2
$151,855
2
$201,215
9
$258,766
2
$51,390
2
$245,920
FILES CLOSED FOR INCOMPLETENESS
0
$0
2
$198,385
2
$234,115
0
$0
1
$213,250
Aggregated Statistics For Year 2007 (Based on 4 partial tracts)
A) FHA, FSA/RHS & VA Home Purchase Loans
B) Conventional Home Purchase Loans
C) Refinancings
D) Home Improvement Loans
F) Non-occupant Loans on < 5 Family Dwellings (A B C & D)
G) Loans On Manufactured Home Dwelling (A B C & D)
Number
Average Value
Number
Average Value
Number
Average Value
Number
Average Value
Number
Average Value
Number
Average Value
LOANS ORIGINATED
1
$172,230
27
$189,243
66
$213,913
15
$104,305
10
$158,256
1
$65,410
APPLICATIONS APPROVED, NOT ACCEPTED
0
$0
8
$218,526
14
$219,266
6
$142,828
1
$347,190
0
$0
APPLICATIONS DENIED
1
$103,940
15
$234,293
63
$224,346
8
$75,265
6
$246,927
0
$0
APPLICATIONS WITHDRAWN
0
$0
5
$218,072
22
$266,894
3
$128,087
2
$267,025
0
$0
FILES CLOSED FOR INCOMPLETENESS
0
$0
2
$247,245
10
$315,678
0
$0
0
$0
0
$0
Aggregated Statistics For Year 2006 (Based on 4 partial tracts)
B) Conventional Home Purchase Loans
C) Refinancings
D) Home Improvement Loans
F) Non-occupant Loans on < 5 Family Dwellings (A B C & D)
Number
Average Value
Number
Average Value
Number
Average Value
Number
Average Value
LOANS ORIGINATED
39
$181,229
73
$202,202
14
$105,420
9
$173,864
APPLICATIONS APPROVED, NOT ACCEPTED
17
$171,764
21
$233,046
5
$179,668
8
$189,614
APPLICATIONS DENIED
18
$223,894
39
$181,818
15
$67,111
7
$191,743
APPLICATIONS WITHDRAWN
7
$224,340
27
$203,314
2
$130,110
3
$159,213
FILES CLOSED FOR INCOMPLETENESS
6
$327,345
11
$315,475
0
$0
0
$0
Aggregated Statistics For Year 2005 (Based on 4 partial tracts)
B) Conventional Home Purchase Loans
C) Refinancings
D) Home Improvement Loans
F) Non-occupant Loans on < 5 Family Dwellings (A B C & D)
G) Loans On Manufactured Home Dwelling (A B C & D)
Number
Average Value
Number
Average Value
Number
Average Value
Number
Average Value
Number
Average Value
LOANS ORIGINATED
40
$171,278
77
$158,984
13
$132,689
14
$140,794
1
$60,930
APPLICATIONS APPROVED, NOT ACCEPTED
11
$148,576
17
$136,426
1
$90,740
4
$134,848
1
$68,820
APPLICATIONS DENIED
21
$184,073
41
$172,812
16
$106,018
7
$142,454
2
$48,230
APPLICATIONS WITHDRAWN
16
$223,677
37
$197,284
4
$219,660
5
$205,152
0
$0
FILES CLOSED FOR INCOMPLETENESS
2
$304,905
9
$153,816
0
$0
1
$169,610
0
$0
Aggregated Statistics For Year 2004 (Based on 4 partial tracts)
A) FHA, FSA/RHS & VA Home Purchase Loans
B) Conventional Home Purchase Loans
C) Refinancings
D) Home Improvement Loans
F) Non-occupant Loans on < 5 Family Dwellings (A B C & D)
G) Loans On Manufactured Home Dwelling (A B C & D)
Number
Average Value
Number
Average Value
Number
Average Value
Number
Average Value
Number
Average Value
Number
Average Value
LOANS ORIGINATED
1
$223,060
26
$175,642
67
$143,719
9
$75,642
9
$125,276
2
$104,385
APPLICATIONS APPROVED, NOT ACCEPTED
0
$0
5
$150,092
18
$147,866
1
$61,100
2
$98,270
1
$72,580
APPLICATIONS DENIED
0
$0
9
$144,109
56
$127,038
16
$105,960
4
$95,092
1
$78,850
APPLICATIONS WITHDRAWN
0
$0
8
$163,901
35
$137,531
3
$105,813
4
$113,750
0
$0
FILES CLOSED FOR INCOMPLETENESS
0
$0
1
$120,520
8
$116,946
1
$35,600
1
$149,950
0
$0
Aggregated Statistics For Year 2003 (Based on 4 partial tracts)
A) FHA, FSA/RHS & VA Home Purchase Loans
B) Conventional Home Purchase Loans
C) Refinancings
D) Home Improvement Loans
F) Non-occupant Loans on < 5 Family Dwellings (A B C & D)
Number
Average Value
Number
Average Value
Number
Average Value
Number
Average Value
Number
Average Value
LOANS ORIGINATED
2
$87,725
21
$163,400
101
$106,514
5
$40,600
7
$67,673
APPLICATIONS APPROVED, NOT ACCEPTED
0
$0
2
$237,165
12
$113,562
2
$97,105
2
$111,755
APPLICATIONS DENIED
0
$0
11
$138,015
34
$141,959
5
$54,650
4
$132,538
APPLICATIONS WITHDRAWN
0
$0
2
$108,370
26
$131,627
1
$17,120
1
$120,520
FILES CLOSED FOR INCOMPLETENESS
0
$0
0
$0
5
$128,322
1
$23,300
0
$0
Aggregated Statistics For Year 2002 (Based on 4 partial tracts)
A) FHA, FSA/RHS & VA Home Purchase Loans
B) Conventional Home Purchase Loans
C) Refinancings
D) Home Improvement Loans
F) Non-occupant Loans on < 5 Family Dwellings (A B C & D)
Number
Average Value
Number
Average Value
Number
Average Value
Number
Average Value
Number
Average Value
LOANS ORIGINATED
6
$104,433
21
$123,077
65
$107,486
3
$49,660
8
$73,768
APPLICATIONS APPROVED, NOT ACCEPTED
0
$0
0
$0
9
$124,588
1
$61,920
1
$110,600
APPLICATIONS DENIED
1
$88,340
4
$149,330
20
$96,732
5
$37,544
0
$0
APPLICATIONS WITHDRAWN
0
$0
1
$243,450
19
$128,633
2
$32,790
0
$0
FILES CLOSED FOR INCOMPLETENESS
0
$0
0
$0
2
$108,635
0
$0
0
$0
Aggregated Statistics For Year 2001 (Based on 4 partial tracts)
A) FHA, FSA/RHS & VA Home Purchase Loans
B) Conventional Home Purchase Loans
C) Refinancings
D) Home Improvement Loans
F) Non-occupant Loans on < 5 Family Dwellings (A B C & D)
Number
Average Value
Number
Average Value
Number
Average Value
Number
Average Value
Number
Average Value
LOANS ORIGINATED
7
$82,833
11
$100,149
40
$97,984
2
$19,900
5
$59,984
APPLICATIONS APPROVED, NOT ACCEPTED
0
$0
1
$73,960
5
$187,574
0
$0
0
$0
APPLICATIONS DENIED
1
$109,230
3
$92,170
26
$106,154
5
$14,852
1
$67,200
APPLICATIONS WITHDRAWN
1
$75,260
1
$97,930
19
$120,509
1
$56,840
2
$177,290
FILES CLOSED FOR INCOMPLETENESS
1
$75,260
2
$100,835
7
$161,267
0
$0
1
$67,200
Aggregated Statistics For Year 2000 (Based on 4 partial tracts)
A) FHA, FSA/RHS & VA Home Purchase Loans
B) Conventional Home Purchase Loans
C) Refinancings
D) Home Improvement Loans
F) Non-occupant Loans on < 5 Family Dwellings (A B C & D)
Number
Average Value
Number
Average Value
Number
Average Value
Number
Average Value
Number
Average Value
LOANS ORIGINATED
5
$94,314
17
$113,494
22
$75,470
5
$16,840
2
$78,120
APPLICATIONS APPROVED, NOT ACCEPTED
0
$0
3
$77,083
7
$68,424
2
$57,980
1
$70,780
APPLICATIONS DENIED
2
$101,080
4
$167,698
23
$77,769
4
$27,030
4
$72,080
APPLICATIONS WITHDRAWN
2
$60,790
2
$87,140
12
$62,198
1
$13,010
1
$72,580
FILES CLOSED FOR INCOMPLETENESS
0
$0
0
$0
1
$142,780
0
$0
0
$0
Aggregated Statistics For Year 1999 (Based on 2 partial tracts)
A) FHA, FSA/RHS & VA Home Purchase Loans
B) Conventional Home Purchase Loans
C) Refinancings
D) Home Improvement Loans
F) Non-occupant Loans on < 5 Family Dwellings (A B C & D)
Detailed PMIC statistics for the following Tracts:0016.00
, 0069.00
2006 - 2018 National Fire Incident Reporting System (NFIRS) incidents
Based on the data from the years 2006 - 2018 the average number of fire incidents per year is 27. The highest number of fire incidents - 40 took place in 2008, and the least - 5 in 2006. The data has a growing trend.
When looking into fire subcategories, the most incidents belonged to: Outside Fires (43.1%), and Mobile Property/Vehicle Fires (34.1%).
Fire incident types reported to NFIRS in Zip Code 93616


 Nearest zip codes: 93648, 93625, 93662, 93727, 93725, 93702.


 Based on the data from the years 2006 - 2018 the average number of fire incidents per year is 27. The highest number of fire incidents - 40 took place in 2008, and the least - 5 in 2006. The data has a growing trend.
 When looking into fire subcategories, the most incidents belonged to: Outside Fires (43.1%), and Mobile Property/Vehicle Fires (34.1%).