Estimated zip code population in 2022: 1,366 Zip code population in 2010: 1,229 Zip code population in 2000: 971
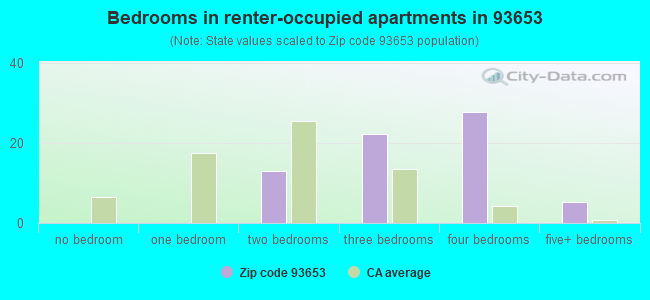
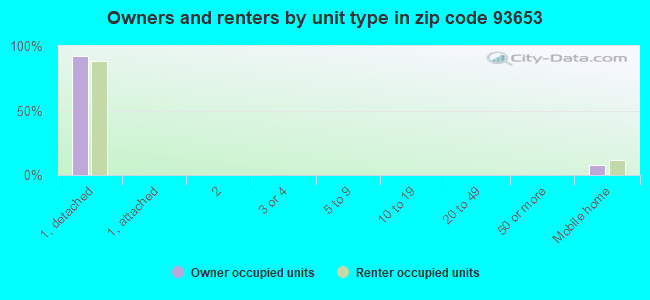
Houses and condos: 707 Renter-occupied apartments: 67
% of renters here:
12%
State:
44%
March 2022 cost of living index in zip code 93653: 96.3 (near average, U.S. average is 100)
Land area: 237.4 sq. mi. Water area: 3.7 sq. mi.
Population density: 6 people per square mile
(very low).
OSM Map
General Map
Google Map
MSN Map
OSM Map
General Map
Google Map
MSN Map
OSM Map
General Map
Google Map
MSN Map
OSM Map
General Map
Google Map
MSN Map
Please wait while loading the map...
Real estate property taxes paid for housing units in 2022:
This zip code:
0.5% ($2,509)
California:
0.7% ($4,831)
Median real estate property taxes paid for housing units with mortgages in 2022: $2,763 (0.6%) Median real estate property taxes paid for housing units with no mortgage in 2022: $2,409 (0.4%)
Business Search- 14 Million verified businesses
Males: 590
(43.2%)
Females: 775
(56.8%)
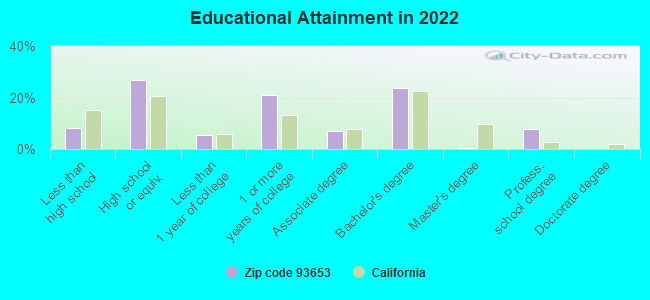
For population 25 years and over in 93653:
High school or higher: 91.2%
Bachelor's degree or higher: 31.7%
Graduate or professional degree: 8.1%
Unemployed: 6.2%
Mean travel time to work (commute): 39.7 minutes
For population 15 years and over in 93653:
Never married: 26.6%
Now married: 58.4%
Separated: 2.3%
Widowed: 4.4%
Divorced: 8.3%
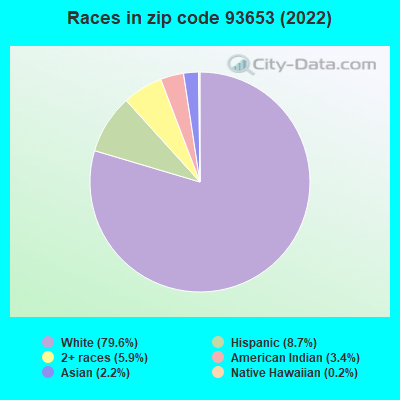
Zip code 93653 compared to state average:
Black race population percentage significantly below state average.
Hispanic race population percentage significantly below state average.
Median age significantly above state average.
Foreign-born population percentage significantly below state average.
Renting percentage significantly below state average.
Length of stay since moving in significantly above state average.
Averages for the 2020 tax year for zip code 93653, filed in 2021:
Average Adjusted Gross Income (AGI) in 2020: $69,082 (Individual Income Tax Returns)
Here:
$69,082
State:
$95,910
Salary/wage: $59,609 (reported on 69.4% of returns)
Here:
$59,609
State:
$77,331
(% of AGI for various income ranges: 1127.5% for AGIs below $25k, 3997.1% for AGIs $25k-50k, 7162.5% for AGIs $50k-75k, 8213.3% for AGIs $75k-100k, 12488.0% for AGIs $100k-200k)
Taxable interest for individuals: $400 (reported on 36.7% of returns)
This zip code:
$400
California:
$2,294
(% of AGI for various income ranges: 12.5% for AGIs below $25k, 8.6% for AGIs $25k-50k, 5.0% for AGIs $50k-75k, 90.0% for AGIs $75k-100k, 54.0% for AGIs $100k-200k)
Ordinary dividends: $1,657 (reported on 14.3% of returns)
Here:
$1,657
State:
$10,949
(% of AGI for various income ranges: 70.0% for AGIs $25k-50k, 134.0% for AGIs $100k-200k)
Net capital gain/loss in AGI: +$20,043 (reported on 14.3% of returns)
Here:
+$20,043
State:
+$49,306
(% of AGI for various income ranges: 51.2% for AGIs below $25k, 135.7% for AGIs $25k-50k, 2534.0% for AGIs $100k-200k)
Profit/loss from business: +$15,200 (reported on 14.3% of returns)
Here:
+$15,200
State:
+$15,671
(% of AGI for various income ranges: 377.5% for AGIs below $25k, 295.7% for AGIs $25k-50k, 1850.0% for AGIs $75k-100k)
Taxable individual retirement arrangement distribution: $26,200 (reported on 6.1% of returns)
93653:
$26,200
California:
$23,505
(% of AGI for various income ranges: 1965.0% for AGIs $50k-75k)
Total itemized deductions: $30,180 (reported on 10.2% of returns)
Here:
$30,180
State:
$39,517
(% of AGI for various income ranges: 757.1% for AGIs $25k-50k, 1958.0% for AGIs $100k-200k)
Charity contributions: $3,750 (reported on 8.2% of returns)
Here:
$3,750
State:
$12,598
(% of AGI for various income ranges: 300.0% for AGIs $100k-200k)
Taxes paid: $8,920 (reported on 10.2% of returns)
93653:
$8,920
State:
$8,807
(% of AGI for various income ranges: 200.0% for AGIs $25k-50k, 612.0% for AGIs $100k-200k)
Earned income credit: $2,171 (reported on 14.3% of returns)
Here:
$2,171
State:
$2,074
(% of AGI for various income ranges: 190.0% for AGIs below $25k)
Percentage of individuals using paid preparers for their 2020 taxes: 87.8%
Here:
88%
State:
92%
(% for various income ranges: 93.3% for AGIs below $25k, 90.9% for AGIs $25k-50k, 85.7% for AGIs $50k-75k, 80.0% for AGIs $75k-100k, 87.5% for AGIs $100k-200k, 66.7% for AGIs over 200k)
Averages for the 2012 tax year for zip code 93653, filed in 2013:
Average Adjusted Gross Income (AGI) in 2012: $50,235 (Individual Income Tax Returns)
Here:
$50,235
State:
$72,726
Salary/wage: $40,373 (reported on 69.8% of returns)
Here:
$40,373
State:
$59,079
(% of AGI for various income ranges: 52.8% for AGIs below $25k, 61.1% for AGIs $25k-50k, 74.7% for AGIs $50k-75k, 62.3% for AGIs $75k-100k, 41.4% for AGIs $100k-200k)
Taxable interest for individuals: $653 (reported on 39.5% of returns)
This zip code:
$653
California:
$2,146
(% of AGI for various income ranges: 0.5% for AGIs below $25k, 1.7% for AGIs $25k-50k, 0.3% for AGIs $50k-75k, 0.5% for AGIs $75k-100k, 0.1% for AGIs $100k-200k)
Ordinary dividends: $2,080 (reported on 11.6% of returns)
Here:
$2,080
State:
$9,308
Net capital gain/loss in AGI: +$4,300 (reported on 14.0% of returns)
Here:
+$4,300
State:
+$30,460
Profit/loss from business: +$9,625 (reported on 18.6% of returns)
Here:
+$9,625
State:
+$17,064
(% of AGI for various income ranges: 11.1% for AGIs below $25k, 12.9% for AGIs $25k-50k, 2.7% for AGIs $75k-100k)
Taxable individual retirement arrangement distribution: $15,620 (reported on 11.6% of returns)
93653:
$15,620
California:
$19,557
Total itemized deductions: $21,657 (24% of AGI, reported on 32.6% of returns)
Here:
$21,657
State:
$34,004
Here:
23.7% of AGI
State:
22.7% of AGI
(% of AGI for various income ranges: 16.4% for AGIs $25k-50k, 13.8% for AGIs $50k-75k, 18.7% for AGIs $75k-100k, 14.0% for AGIs $100k-200k)
Charity contributions: $2,390 (reported on 23.3% of returns)
Here:
$2,390
State:
$4,659
(% of AGI for various income ranges: 1.8% for AGIs below $25k, 0.9% for AGIs $50k-75k, 2.1% for AGIs $75k-100k, 1.0% for AGIs $100k-200k)
Taxes paid: $7,043 (reported on 32.6% of returns)
93653:
$7,043
State:
$14,448
(% of AGI for various income ranges: 3.2% for AGIs $25k-50k, 3.6% for AGIs $50k-75k, 6.0% for AGIs $75k-100k, 6.0% for AGIs $100k-200k)
Earned income credit: $1,800 (reported on 18.6% of returns)
Here:
$1,800
State:
$2,286
(% of AGI for various income ranges: 5.1% for AGIs below $25k, 1.4% for AGIs $25k-50k)
Percentage of individuals using paid preparers for their 2012 taxes: 55.8%
Here:
56%
State:
64%
(% for various income ranges: 56.2% for AGIs below $25k, 50.0% for AGIs $25k-50k, 57.1% for AGIs $50k-75k, 60.0% for AGIs $75k-100k, 60.0% for AGIs $100k-200k)
Averages for the 2004 tax year for zip code 93653, filed in 2005:
Average Adjusted Gross Income (AGI) in 2004: $49,857 (Individual Income Tax Returns)
Here:
$49,857
State:
$58,600
Salary/wage: $41,652 (reported on 76.5% of returns)
Here:
$41,652
State:
$49,455
(% of AGI for various income ranges: 86.3% for AGIs below $10k, 65.3% for AGIs $10k-25k, 77.0% for AGIs $25k-50k, 72.1% for AGIs $50k-75k, 65.0% for AGIs $75k-100k, 49.6% for AGIs over 100k)
Taxable interest for individuals: $961 (reported on 51.9% of returns)
This zip code:
$961
California:
$2,365
(% of AGI for various income ranges: 7.8% for AGIs below $10k, 2.9% for AGIs $10k-25k, 1.1% for AGIs $25k-50k, 1.0% for AGIs $50k-75k, 0.4% for AGIs $75k-100k, 0.6% for AGIs over 100k)
Taxable dividends: $1,411 (reported on 18.7% of returns)
Here:
$1,411
State:
$4,746
(% of AGI for various income ranges: 12.4% for AGIs below $10k, 2.2% for AGIs $10k-25k, 0.9% for AGIs $25k-50k, 0.3% for AGIs $50k-75k, 0.1% for AGIs over 100k)
Net capital gain/loss: +$6,347 (reported on 18.4% of returns)
Here:
+$6,347
State:
+$23,418
(% of AGI for various income ranges: -1.6% for AGIs $10k-25k, 0.4% for AGIs $25k-50k, 0.4% for AGIs $50k-75k, 0.6% for AGIs $75k-100k, 6.2% for AGIs over 100k)
Profit/loss from business: +$19,534 (reported on 18.7% of returns)
Here:
+$19,534
State:
+$16,826
(% of AGI for various income ranges: 11.1% for AGIs $10k-25k, 4.1% for AGIs $25k-50k, 4.7% for AGIs $50k-75k, 34.6% for AGIs $75k-100k)
Total itemized deductions: $21,718 (25% of AGI, reported on 38.1% of returns)
Here:
$21,718
State:
$28,113
Here:
24.9% of AGI
State:
25.3% of AGI
(% of AGI for various income ranges: 16.3% for AGIs $10k-25k, 16.9% for AGIs $25k-50k, 15.3% for AGIs $50k-75k, 18.6% for AGIs $75k-100k, 16.9% for AGIs over 100k)
Charity contributions deductions: $2,026 (2% of AGI, reported on 29.4% of returns)
Here:
$2,026
State:
$3,923
Here:
2.4% of AGI
State:
3.3% of AGI
(% of AGI for various income ranges: 13.7% for AGIs below $10k, 1.3% for AGIs $25k-50k, 1.3% for AGIs $50k-75k, 1.4% for AGIs $75k-100k, 1.0% for AGIs over 100k)
Total tax: $7,843 (reported on 76.7% of returns)
93653:
$7,843
State:
$10,761
(% of AGI for various income ranges: 3.9% for AGIs below $10k, 4.9% for AGIs $10k-25k, 5.7% for AGIs $25k-50k, 9.0% for AGIs $50k-75k, 11.5% for AGIs $75k-100k, 19.7% for AGIs over 100k)
Earned income credit: $1,611 (reported on 9.2% of returns)
Here:
$1,611
State:
$1,763
Percentage of individuals using paid preparers for their 2004 taxes: 61.9%
Here:
62%
State:
66%
(% for various income ranges: 60.3% for AGIs below $10k, 50.6% for AGIs $10k-25k, 61.4% for AGIs $25k-50k, 67.6% for AGIs $50k-75k, 73.3% for AGIs $75k-100k, 71.4% for AGIs over 100k)
Likely homosexual households (counted as self-reported same-sex unmarried-partner households)
Lesbian couples: 0.7% of all households
Gay men: 0.0% of all households
Household received Food Stamps/SNAP in the past 12 months: 66 Household did not receive Food Stamps/SNAP in the past 12 months: 495
Women who had a birth in the past 12 months: 10 (10 now married, 0 unmarried) Women who did not have a birth in the past 12 months: 336 (129 now married, 206 unmarried)
Housing units in zip code 93653 with a mortgage: 202 (28 second mortgage, 5 home equity loan, 22 both second mortgage and home equity loan) Median monthly owner costs for units with a mortgage: $2,134 Median monthly owner costs for units without a mortgage: $593
Residents with income below the poverty level in 2022:
This zip code:
6.0%
Whole state:
12.2%
Residents with income below 50% of the poverty level in 2022:
This zip code:
3.9%
Whole state:
6.2%
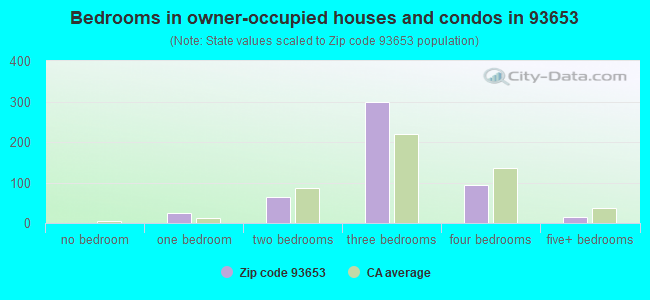
Median number of rooms in houses and condos:
Here:
5.9
State:
6.0
Median number of rooms in apartments:
Here:
6.1
State:
3.9
Notable locations in this zip code not listed on our city pages
Notable locations in zip code 93653: Summit House (A), Footman Ranch (B), Woods Ranch (C), Department of Forestry and Fire Protection Raymond Station (D), Madera County Fire Department Station 15 (E). Display/hide their locations on the map
Rivers and creeks: Chapman Creek (A), Cow Creek (B), Crooks Creek (C), Wildcat Creek (D), Whisky Creek (E), Middle Fork Chowchilla River (F), Striped Rock Creek (G), Split Rock Creek (H), East Fork Chowchilla River (I). Display/hide their locations on the map
Size of family households: 161 2-persons, 61 3-persons, 131 4-persons, 52 5-persons, 4 6-persons
Size of nonfamily households: 89 1-person, 60 2-persons
203 married couples with children.
35 single-parent households (35 men).
93.2% of residents of 93653 zip code speak English at home.
5.7% of residents speak Spanish at home (78% very well, 12% well, 11% not well).
0.3% of residents speak other Indo-European language at home (100% very well).
0.4% of residents speak Asian or Pacific Island language at home (100% very well).
Foreign born population: 35 (2.6%) (100.0% of them are naturalized citizens)
This zip code:
2.6%
Whole state:
26.7%
53%Honduras
18%Malaysia
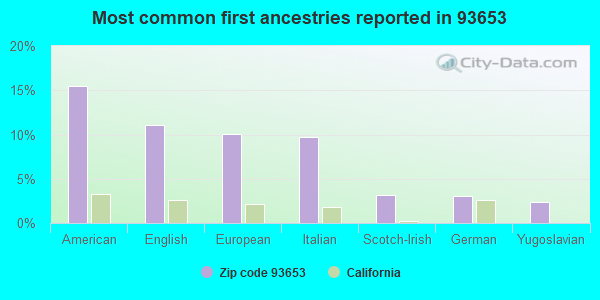
15%American
11%English
10%European
10%Italian
3%Scotch-Irish
3%German
2%Yugoslavian
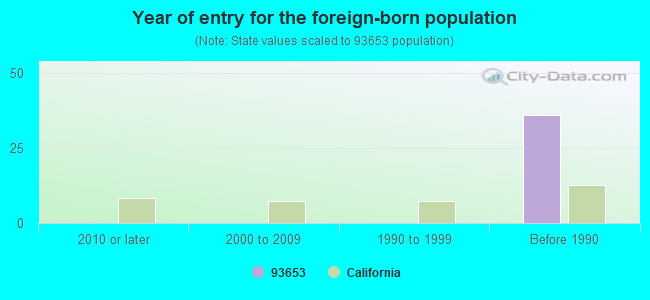
Year of entry for the foreign-born population
02010 or later
02000 to 2009
01990 to 1999
36Before 1990
Housing units lacking complete plumbing facilities: 0.4% Housing units lacking complete kitchen facilities: 2.5%
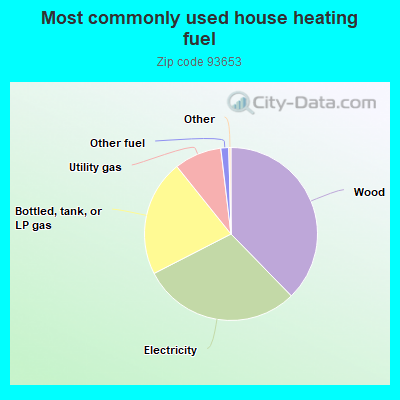
37.9%Wood
29.9%Electricity
21.9%Bottled, tank, or LP gas
8.9%Utility gas
1.5%Other fuel
Population in 1990: 491. Population change in the 1990s: +480 (+97.8%).
Place of birth for U.S.-born residents:
This state: 1,065
Northeast: 32
Midwest: 91
South: 59
West: 74
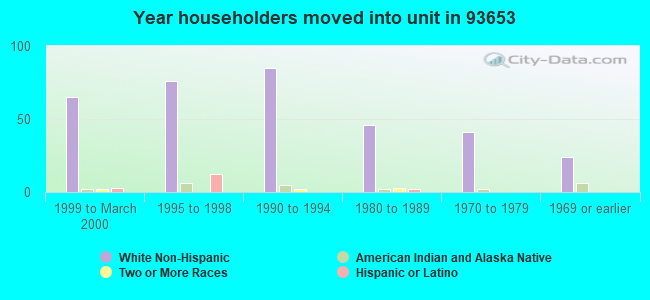
60% of the 93653 zip code residents lived in the same house 5 years ago. Out of people who lived in different houses, 59% lived in this county. Out of people who lived in different counties, 50% lived in California.
94% of the 93653 zip code residents lived in the same house 1 year ago. Out of people who lived in different houses, 14% moved from this county. Out of people who lived in different houses, 12% moved from different county within same state. Out of people who lived in different houses, 69% moved from different state. Out of people who lived in different houses, 14% moved from abroad.
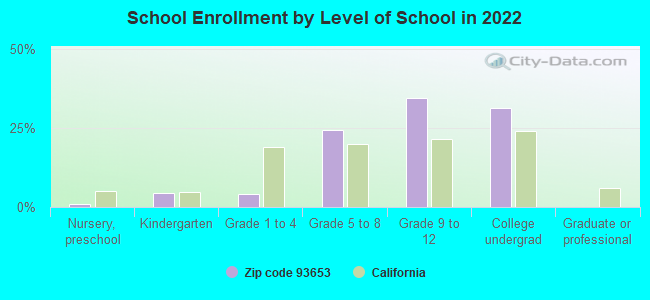
Private vs. public school enrollment:
Students in private schools in grades 1 to 8 (elementary and middle school): 9
Here:
10.9%
California:
10.5%
Students in private schools in grades 9 to 12 (high school):
Here:
0.0%
California:
8.5%
Students in private undergraduate colleges: 11
Here:
11.9%
California:
15.9%
Occupation by median earnings in the past 12 months ($)
146,957Management occupations
122,892Education, training, and library occupations
70,772Construction and extraction occupations
69,881Health diagnosing and treating practitioners and other technical occupations
64,196Office and administrative support occupations
57,665Production occupations
Companies with federal contracts located in this zip code:
PROTZMAN ENTERPRISES (32243 DIGGER PINE RD in RAYMOND, CA; small business) : $15,339 in 4 contractsfrom 2005 to 2006
$6,205 with Army for Water Quality Support Services. Signed on 2005-07-05. Completion date: 2005-09-30.
$6,205 with U.S. Army Corps of Engineers - civil program financing only for Water Quality Support Services. Signed on 2005-07-05. Completion date: 2005-09-30.
$4,389 with Army for Waste Treatment and Storage. Signed on 2005-10-26. Completion date: 2006-09-30.
-$1,460 with Army for Water Quality Support Services. Signed on 2006-01-31. Completion date: 2006-03-31.
Top industries in this zip code by the number of employees in 2005:
Construction: Power and Communication Line and Related Structures Construction (5-9 employees: 1 establishment)
Construction: Water and Sewer Line and Related Structures Construction (1-4: 3)
Mining: Dimension Stone Mining and Quarrying (1-4: 1)
Construction: Electrical Contractors (1-4: 1)
Professional, Scientific, and Technical Services: All Other Professional, Scientific, and Technical Services (1-4: 1)
Finance and Insurance: Securities Brokerage (1-4: 1)
Construction: Framing Contractors (1-4: 1)
Finance and Insurance: Direct Property and Casualty Insurance Carriers (1-4: 1)
Fatal accident statistics in 2013:
Fatal accident count: 2
Vehicles involved in fatal accidents: 2
Fatal accidents caused by drunken drivers: 1
Fatalities: 2
Persons involved in fatal accidents: 3
Pedestrians involved in fatal accidents: 0
Fatal accident statistics in 2012:
Fatal accident count: 1
Vehicles involved in fatal accidents: 1
Fatal accidents caused by drunken drivers: 1
Fatalities: 1
Persons involved in fatal accidents: 3
Pedestrians involved in fatal accidents: 0
Home Mortgage Disclosure Act Aggregated Statistics For Year 2009 (Based on 2 partial tracts)
A) FHA, FSA/RHS & VA Home Purchase Loans
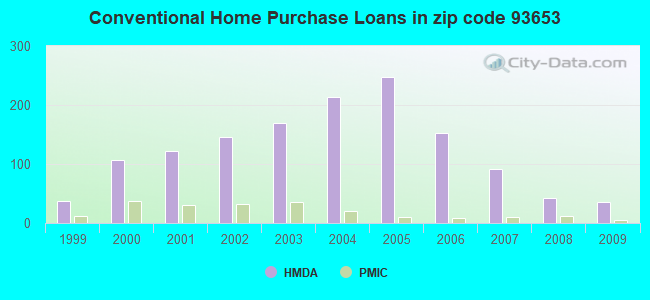
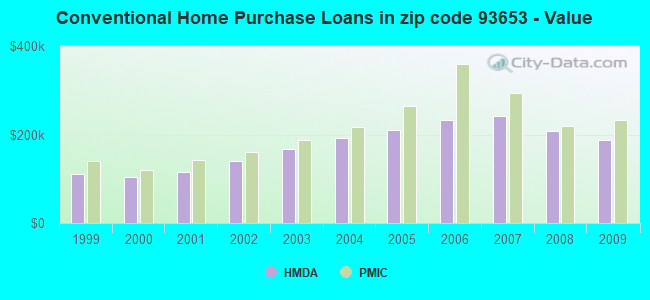
B) Conventional Home Purchase Loans
C) Refinancings
D) Home Improvement Loans
F) Non-occupant Loans on < 5 Family Dwellings (A B C & D)
G) Loans On Manufactured Home Dwelling (A B C & D)
Number
Average Value
Number
Average Value
Number
Average Value
Number
Average Value
Number
Average Value
Number
Average Value
LOANS ORIGINATED
41
$184,138
35
$186,609
165
$207,026
10
$157,589
31
$207,985
4
$152,958
APPLICATIONS APPROVED, NOT ACCEPTED
4
$180,540
7
$168,824
21
$212,007
2
$148,975
4
$183,490
2
$103,545
APPLICATIONS DENIED
8
$156,129
11
$239,862
93
$251,714
4
$87,615
11
$191,589
4
$60,622
APPLICATIONS WITHDRAWN
6
$161,857
6
$154,285
50
$216,188
6
$86,337
9
$127,243
3
$111,313
FILES CLOSED FOR INCOMPLETENESS
2
$236,590
1
$184,670
17
$240,963
0
$0
2
$135,405
0
$0
Aggregated Statistics For Year 2008 (Based on 2 partial tracts)
A) FHA, FSA/RHS & VA Home Purchase Loans
B) Conventional Home Purchase Loans
C) Refinancings
D) Home Improvement Loans
F) Non-occupant Loans on < 5 Family Dwellings (A B C & D)
G) Loans On Manufactured Home Dwelling (A B C & D)
Number
Average Value
Number
Average Value
Number
Average Value
Number
Average Value
Number
Average Value
Number
Average Value
LOANS ORIGINATED
12
$264,910
42
$207,778
127
$228,883
17
$120,082
30
$214,957
7
$150,281
APPLICATIONS APPROVED, NOT ACCEPTED
4
$237,918
7
$218,890
32
$239,688
6
$105,512
4
$232,902
3
$102,857
APPLICATIONS DENIED
4
$245,145
11
$185,260
91
$244,785
13
$133,295
8
$214,686
11
$105,235
APPLICATIONS WITHDRAWN
1
$105,020
6
$284,872
41
$238,000
5
$80,476
4
$178,180
4
$136,585
FILES CLOSED FOR INCOMPLETENESS
2
$197,650
2
$294,705
8
$190,275
2
$24,190
2
$158,710
2
$91,155
Aggregated Statistics For Year 2007 (Based on 2 partial tracts)
A) FHA, FSA/RHS & VA Home Purchase Loans
B) Conventional Home Purchase Loans
C) Refinancings
D) Home Improvement Loans
F) Non-occupant Loans on < 5 Family Dwellings (A B C & D)
G) Loans On Manufactured Home Dwelling (A B C & D)
Number
Average Value
Number
Average Value
Number
Average Value
Number
Average Value
Number
Average Value
Number
Average Value
LOANS ORIGINATED
2
$265,795
91
$241,505
264
$242,161
39
$150,163
53
$239,162
10
$114,637
APPLICATIONS APPROVED, NOT ACCEPTED
1
$188,800
21
$220,491
64
$253,626
9
$176,017
6
$212,990
5
$125,434
APPLICATIONS DENIED
2
$187,620
25
$265,571
179
$275,105
38
$164,998
14
$298,835
14
$135,321
APPLICATIONS WITHDRAWN
1
$172,280
6
$274,055
90
$251,897
9
$151,761
9
$292,574
4
$155,760
FILES CLOSED FOR INCOMPLETENESS
0
$0
4
$185,702
38
$288,168
4
$131,865
2
$205,910
0
$0
Aggregated Statistics For Year 2006 (Based on 2 partial tracts)
A) FHA, FSA/RHS & VA Home Purchase Loans
B) Conventional Home Purchase Loans
C) Refinancings
D) Home Improvement Loans
F) Non-occupant Loans on < 5 Family Dwellings (A B C & D)
G) Loans On Manufactured Home Dwelling (A B C & D)
Number
Average Value
Number
Average Value
Number
Average Value
Number
Average Value
Number
Average Value
Number
Average Value
LOANS ORIGINATED
1
$169,920
153
$233,027
348
$236,363
53
$120,583
64
$238,572
16
$142,632
APPLICATIONS APPROVED, NOT ACCEPTED
0
$0
31
$230,614
71
$292,964
12
$119,819
12
$314,814
4
$79,650
APPLICATIONS DENIED
1
$261,370
35
$272,934
159
$266,936
32
$142,356
15
$231,477
15
$159,497
APPLICATIONS WITHDRAWN
0
$0
18
$263,599
130
$236,785
11
$135,754
5
$239,422
2
$213,580
FILES CLOSED FOR INCOMPLETENESS
0
$0
5
$276,356
36
$268,417
0
$0
2
$166,085
1
$197,650
Aggregated Statistics For Year 2005 (Based on 2 partial tracts)
A) FHA, FSA/RHS & VA Home Purchase Loans
B) Conventional Home Purchase Loans
C) Refinancings
D) Home Improvement Loans
E) Loans on Dwellings For 5+ Families
F) Non-occupant Loans on < 5 Family Dwellings (A B C & D)
G) Loans On Manufactured Home Dwelling (A B C & D)
Number
Average Value
Number
Average Value
Number
Average Value
Number
Average Value
Number
Average Value
Number
Average Value
Number
Average Value
LOANS ORIGINATED
0
$0
247
$210,059
389
$216,480
58
$125,772
0
$0
71
$212,491
33
$136,433
APPLICATIONS APPROVED, NOT ACCEPTED
1
$56,050
39
$202,884
66
$217,111
8
$110,994
0
$0
19
$230,752
9
$118,918
APPLICATIONS DENIED
2
$178,770
61
$222,082
184
$220,852
35
$113,499
1
$110,920
18
$203,321
22
$135,915
APPLICATIONS WITHDRAWN
0
$0
39
$215,668
187
$211,810
17
$151,005
0
$0
15
$210,276
11
$140,527
FILES CLOSED FOR INCOMPLETENESS
0
$0
4
$209,745
33
$221,929
2
$226,560
0
$0
2
$152,515
1
$128,620
Aggregated Statistics For Year 2004 (Based on 2 partial tracts)
A) FHA, FSA/RHS & VA Home Purchase Loans
B) Conventional Home Purchase Loans
C) Refinancings
D) Home Improvement Loans
E) Loans on Dwellings For 5+ Families
F) Non-occupant Loans on < 5 Family Dwellings (A B C & D)
G) Loans On Manufactured Home Dwelling (A B C & D)
Number
Average Value
Number
Average Value
Number
Average Value
Number
Average Value
Number
Average Value
Number
Average Value
Number
Average Value
LOANS ORIGINATED
1
$249,570
213
$191,005
402
$187,099
44
$98,637
1
$238,950
68
$171,221
28
$108,286
APPLICATIONS APPROVED, NOT ACCEPTED
0
$0
44
$167,453
81
$184,794
7
$93,726
0
$0
15
$158,553
13
$93,084
APPLICATIONS DENIED
0
$0
47
$172,192
173
$183,626
35
$108,240
0
$0
13
$152,447
17
$108,039
APPLICATIONS WITHDRAWN
1
$318,600
24
$171,272
126
$185,190
19
$113,249
0
$0
8
$153,252
9
$128,161
FILES CLOSED FOR INCOMPLETENESS
0
$0
9
$155,826
42
$187,395
3
$77,290
0
$0
4
$183,342
0
$0
Aggregated Statistics For Year 2003 (Based on 2 partial tracts)
A) FHA, FSA/RHS & VA Home Purchase Loans
B) Conventional Home Purchase Loans
C) Refinancings
D) Home Improvement Loans
F) Non-occupant Loans on < 5 Family Dwellings (A B C & D)
Number
Average Value
Number
Average Value
Number
Average Value
Number
Average Value
Number
Average Value
LOANS ORIGINATED
4
$148,975
170
$168,237
661
$149,578
31
$46,439
83
$147,152
APPLICATIONS APPROVED, NOT ACCEPTED
1
$111,510
28
$135,700
97
$149,355
9
$35,466
6
$128,325
APPLICATIONS DENIED
0
$0
35
$144,196
196
$156,136
18
$57,197
16
$124,822
APPLICATIONS WITHDRAWN
0
$0
18
$180,966
150
$149,376
1
$50,150
6
$156,842
FILES CLOSED FOR INCOMPLETENESS
0
$0
6
$169,330
27
$162,447
2
$76,700
4
$108,118
Aggregated Statistics For Year 2002 (Based on 2 partial tracts)
A) FHA, FSA/RHS & VA Home Purchase Loans
B) Conventional Home Purchase Loans
C) Refinancings
D) Home Improvement Loans
F) Non-occupant Loans on < 5 Family Dwellings (A B C & D)
Number
Average Value
Number
Average Value
Number
Average Value
Number
Average Value
Number
Average Value
LOANS ORIGINATED
9
$140,879
145
$141,132
396
$139,036
19
$41,145
55
$128,620
APPLICATIONS APPROVED, NOT ACCEPTED
1
$70,210
12
$137,716
64
$122,960
4
$26,402
2
$127,440
APPLICATIONS DENIED
0
$0
26
$109,377
133
$128,141
13
$43,297
8
$118,590
APPLICATIONS WITHDRAWN
1
$55,460
17
$142,502
101
$147,740
2
$20,355
11
$143,370
FILES CLOSED FOR INCOMPLETENESS
0
$0
2
$130,095
22
$134,305
0
$0
2
$90,565
Aggregated Statistics For Year 2001 (Based on 2 partial tracts)
A) FHA, FSA/RHS & VA Home Purchase Loans
B) Conventional Home Purchase Loans
C) Refinancings
D) Home Improvement Loans
F) Non-occupant Loans on < 5 Family Dwellings (A B C & D)
Number
Average Value
Number
Average Value
Number
Average Value
Number
Average Value
Number
Average Value
LOANS ORIGINATED
18
$119,278
122
$114,494
266
$120,863
11
$33,684
37
$109,868
APPLICATIONS APPROVED, NOT ACCEPTED
1
$64,310
11
$135,968
35
$122,990
3
$20,060
5
$98,884
APPLICATIONS DENIED
3
$123,507
18
$93,417
110
$111,977
8
$46,979
9
$86,664
APPLICATIONS WITHDRAWN
3
$125,080
12
$96,514
91
$120,963
4
$29,205
5
$87,910
FILES CLOSED FOR INCOMPLETENESS
0
$0
6
$124,588
24
$110,772
1
$57,820
2
$108,855
Aggregated Statistics For Year 2000 (Based on 2 partial tracts)
A) FHA, FSA/RHS & VA Home Purchase Loans
B) Conventional Home Purchase Loans
C) Refinancings
D) Home Improvement Loans
F) Non-occupant Loans on < 5 Family Dwellings (A B C & D)
Number
Average Value
Number
Average Value
Number
Average Value
Number
Average Value
Number
Average Value
LOANS ORIGINATED
24
$110,650
106
$104,018
81
$113,863
14
$25,159
18
$96,793
APPLICATIONS APPROVED, NOT ACCEPTED
2
$121,540
16
$103,692
22
$98,047
6
$42,382
1
$63,130
APPLICATIONS DENIED
1
$54,870
21
$79,734
68
$96,231
10
$31,447
1
$93,810
APPLICATIONS WITHDRAWN
1
$145,140
10
$104,253
41
$96,141
2
$38,350
3
$99,120
FILES CLOSED FOR INCOMPLETENESS
0
$0
3
$98,727
17
$111,753
2
$17,700
3
$91,057
Aggregated Statistics For Year 1999 (Based on 1 partial tract)
A) FHA, FSA/RHS & VA Home Purchase Loans
B) Conventional Home Purchase Loans
C) Refinancings
D) Home Improvement Loans
F) Non-occupant Loans on < 5 Family Dwellings (A B C & D)
Detailed PMIC statistics for the following Tracts:0001.05
2005 - 2018 National Fire Incident Reporting System (NFIRS) incidents
Based on the data from the years 2005 - 2018 the average number of fires per year is 9. The highest number of fires - 24 took place in 2013, and the least - 1 in 2005. The data has a growing trend.
When looking into fire subcategories, the most reports belonged to: Outside Fires (69.2%), and Mobile Property/Vehicle Fires (18.5%).
Fire incident types reported to NFIRS in Zip Code 93653

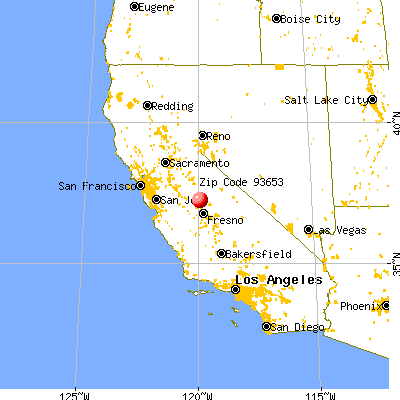


 Nearest zip codes: 93614, 93638, 95306, 93601, 95338, 93636.


 : $15,339 in 4 contracts from 2005 to 2006


 Based on the data from the years 2005 - 2018 the average number of fires per year is 9. The highest number of fires - 24 took place in 2013, and the least - 1 in 2005. The data has a growing trend.
 When looking into fire subcategories, the most reports belonged to: Outside Fires (69.2%), and Mobile Property/Vehicle Fires (18.5%).