Estimated zip code population in 2022: 1,340 Zip code population in 2010: 1,671 Zip code population in 2000: 1,135
Houses and condos: 379 Renter-occupied apartments: 177
% of renters here:
57%
State:
44%
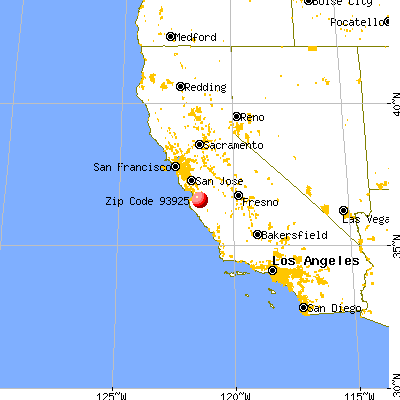
March 2022 cost of living index in zip code 93925: 102.8 (near average, U.S. average is 100)
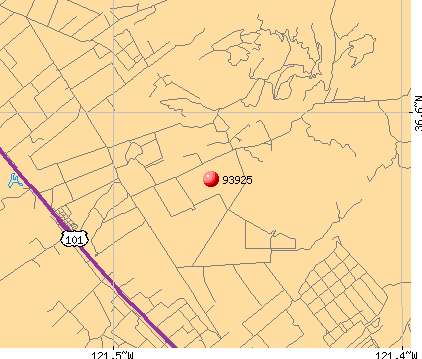
Land area: 54.5 sq. mi. Water area: 0.3 sq. mi.
Population density: 25 people per square mile
(very low).
OSM Map
General Map
Google Map
MSN Map
OSM Map
General Map
Google Map
MSN Map
OSM Map
General Map
Google Map
MSN Map
OSM Map
General Map
Google Map
MSN Map
Please wait while loading the map...
Real estate property taxes paid for housing units in 2022:
This zip code:
0.6% ($4,374)
California:
0.7% ($4,831)
Median real estate property taxes paid for housing units with mortgages in 2022: $4,235 (0.6%) Median real estate property taxes paid for housing units with no mortgage in 2022: $4,691 (0.8%)
Business Search- 14 Million verified businesses
Males: 726
(54.2%)
Females: 614
(45.8%)
For population 25 years and over in 93925:
High school or higher: 50.1%
Bachelor's degree or higher: 9.4%
Graduate or professional degree: 2.3%
Mean travel time to work (commute): 21.4 minutes
For population 15 years and over in 93925:
Never married: 45.8%
Now married: 48.6%
Separated: 2.2%
Widowed: 1.8%
Divorced: 1.6%
Zip code 93925 compared to state average:
Median household income below state average.
Unemployed percentage significantly below state average.
Black race population percentage significantly below state average.
Hispanic race population percentage above state average.
Median age significantly below state average.
Length of stay since moving in significantly above state average.
Percentage of population with a bachelor's degree or higher significantly below state average.
Estimated median house/condo value in 2022: $674,529
93925:
$674,529
California:
$715,900
According to our research of California and other state lists, there were 3 registered sex offenders living in 93925 zip code as of June 08, 2024. The ratio of all residents to sex offenders in zip code 93925 is 617 to 1. The ratio of registered sex offenders to all residents in this zip code is near the state average.
Median resident age:
This zip code:
29.4 years
California median age:
37.9 years
Average household size:
This zip code:
4.3 people
California:
2.8 people
Averages for the 2020 tax year for zip code 93925, filed in 2021:
Average Adjusted Gross Income (AGI) in 2020: $51,063 (Individual Income Tax Returns)
Here:
$51,063
State:
$95,910
Salary/wage: $44,935 (reported on 89.2% of returns)
Here:
$44,935
State:
$77,331
(% of AGI for various income ranges: 1859.3% for AGIs below $25k, 4939.4% for AGIs $25k-50k, 10492.5% for AGIs $50k-75k, 11600.0% for AGIs $75k-100k, 31753.3% for AGIs $100k-200k)
Taxable interest for individuals: $375 (reported on 19.3% of returns)
This zip code:
$375
California:
$2,294
(% of AGI for various income ranges: 0.7% for AGIs below $25k, 1.2% for AGIs $25k-50k, 5.0% for AGIs $50k-75k, 10.0% for AGIs $75k-100k, 163.3% for AGIs $100k-200k)
Ordinary dividends: $8,150 (reported on 4.8% of returns)
Here:
$8,150
State:
$10,949
(% of AGI for various income ranges: 1086.7% for AGIs $100k-200k)
Net capital gain/loss in AGI: +$10,525 (reported on 4.8% of returns)
Here:
+$10,525
State:
+$49,306
(% of AGI for various income ranges: 50.7% for AGIs below $25k, 1150.0% for AGIs $100k-200k)
Profit/loss from business: +$6,383 (reported on 7.2% of returns)
Here:
+$6,383
State:
+$15,671
(% of AGI for various income ranges: 169.3% for AGIs below $25k, 161.2% for AGIs $50k-75k)
Total itemized deductions: $32,875 (reported on 4.8% of returns)
Here:
$32,875
State:
$39,517
(% of AGI for various income ranges: 4383.3% for AGIs $100k-200k)
Charity contributions: $3,000 (reported on 3.6% of returns)
Here:
$3,000
State:
$12,598
(% of AGI for various income ranges: 300.0% for AGIs $100k-200k)
Taxes paid: $8,375 (reported on 4.8% of returns)
93925:
$8,375
State:
$8,807
(% of AGI for various income ranges: 1116.7% for AGIs $100k-200k)
Earned income credit: $2,159 (reported on 20.5% of returns)
Here:
$2,159
State:
$2,074
(% of AGI for various income ranges: 124.0% for AGIs below $25k, 113.1% for AGIs $25k-50k)
Percentage of individuals using paid preparers for their 2020 taxes: 90.4%
Here:
90%
State:
92%
(% for various income ranges: 92.3% for AGIs below $25k, 92.3% for AGIs $25k-50k, 87.5% for AGIs $50k-75k, 85.7% for AGIs $75k-100k, 87.5% for AGIs $100k-200k)
Averages for the 2012 tax year for zip code 93925, filed in 2013:
Average Adjusted Gross Income (AGI) in 2012: $45,056 (Individual Income Tax Returns)
Here:
$45,056
State:
$72,726
Salary/wage: $35,418 (reported on 95.0% of returns)
Here:
$35,418
State:
$59,079
(% of AGI for various income ranges: 84.1% for AGIs below $25k, 85.8% for AGIs $25k-50k, 88.8% for AGIs $50k-75k, 88.9% for AGIs $75k-100k, 52.9% for AGIs $100k-200k)
Taxable interest for individuals: $1,829 (reported on 17.5% of returns)
This zip code:
$1,829
California:
$2,146
(% of AGI for various income ranges: 0.2% for AGIs $25k-50k, 0.2% for AGIs $50k-75k, 1.8% for AGIs $100k-200k)
Ordinary dividends: $9,175 (reported on 5.0% of returns)
Here:
$9,175
State:
$9,308
Net capital gain/loss in AGI: +$6,375 (reported on 5.0% of returns)
Here:
+$6,375
State:
+$30,460
Profit/loss from business: +$7,400 (reported on 10.0% of returns)
Here:
+$7,400
State:
+$17,064
Total itemized deductions: $32,256 (29% of AGI, reported on 20.0% of returns)
Here:
$32,256
State:
$34,004
Here:
29.1% of AGI
State:
22.7% of AGI
(% of AGI for various income ranges: 11.1% for AGIs $25k-50k, 22.9% for AGIs $50k-75k, 22.7% for AGIs $100k-200k)
Charity contributions: $3,508 (reported on 15.0% of returns)
Here:
$3,508
State:
$4,659
(% of AGI for various income ranges: 0.4% for AGIs $25k-50k, 1.2% for AGIs $50k-75k, 2.6% for AGIs $100k-200k)
Taxes paid: $10,356 (reported on 20.0% of returns)
93925:
$10,356
State:
$14,448
(% of AGI for various income ranges: 1.7% for AGIs $25k-50k, 5.5% for AGIs $50k-75k, 9.5% for AGIs $100k-200k)
Earned income credit: $2,642 (reported on 30.0% of returns)
Here:
$2,642
State:
$2,286
(% of AGI for various income ranges: 8.0% for AGIs below $25k, 1.9% for AGIs $25k-50k)
Percentage of individuals using paid preparers for their 2012 taxes: 86.2%
Here:
86%
State:
64%
(% for various income ranges: 81.1% for AGIs below $25k, 88.9% for AGIs $25k-50k, 88.9% for AGIs $50k-75k, 100.0% for AGIs $75k-100k, 100.0% for AGIs $100k-200k)
Averages for the 2004 tax year for zip code 93925, filed in 2005:
Average Adjusted Gross Income (AGI) in 2004: $37,355 (Individual Income Tax Returns)
Here:
$37,355
State:
$58,600
Salary/wage: $30,974 (reported on 94.5% of returns)
Here:
$30,974
State:
$49,455
(% of AGI for various income ranges: 90.1% for AGIs below $10k, 84.9% for AGIs $10k-25k, 90.0% for AGIs $25k-50k, 84.5% for AGIs $50k-75k, 87.9% for AGIs $75k-100k, 55.8% for AGIs over 100k)
Taxable interest for individuals: $603 (reported on 23.5% of returns)
This zip code:
$603
California:
$2,365
(% of AGI for various income ranges: 0.8% for AGIs below $10k, 0.1% for AGIs $10k-25k, 0.2% for AGIs $25k-50k, 0.3% for AGIs $50k-75k, 1.0% for AGIs $75k-100k, 0.6% for AGIs over 100k)
Taxable dividends: $9,884 (reported on 5.5% of returns)
Here:
$9,884
State:
$4,746
Net capital gain/loss: +$14,688 (reported on 4.1% of returns)
Here:
+$14,688
State:
+$23,418
Profit/loss from business: +$11,269 (reported on 8.5% of returns)
Here:
+$11,269
State:
+$16,826
Total itemized deductions: $25,167 (28% of AGI, reported on 21.4% of returns)
Here:
$25,167
State:
$28,113
Here:
28.3% of AGI
State:
25.3% of AGI
(% of AGI for various income ranges: 6.8% for AGIs $10k-25k, 8.1% for AGIs $25k-50k, 21.6% for AGIs $50k-75k, 22.6% for AGIs $75k-100k, 21.7% for AGIs over 100k)
Charity contributions deductions: $1,736 (2% of AGI, reported on 17.9% of returns)
Here:
$1,736
State:
$3,923
Here:
2.0% of AGI
State:
3.3% of AGI
(% of AGI for various income ranges: 0.2% for AGIs $10k-25k, 0.4% for AGIs $25k-50k, 0.8% for AGIs $50k-75k, 1.1% for AGIs $75k-100k, 1.6% for AGIs over 100k)
Total tax: $5,793 (reported on 51.8% of returns)
93925:
$5,793
State:
$10,761
(% of AGI for various income ranges: 2.0% for AGIs below $10k, 2.1% for AGIs $10k-25k, 3.0% for AGIs $25k-50k, 5.6% for AGIs $50k-75k, 7.6% for AGIs $75k-100k, 18.7% for AGIs over 100k)
Earned income credit: $1,908 (reported on 33.2% of returns)
Here:
$1,908
State:
$1,763
Percentage of individuals using paid preparers for their 2004 taxes: 85.2%
Here:
85%
State:
66%
(% for various income ranges: 76.7% for AGIs below $10k, 83.7% for AGIs $10k-25k, 88.6% for AGIs $25k-50k, 90.5% for AGIs $50k-75k, 84.0% for AGIs $75k-100k, 88.2% for AGIs over 100k)
Household received Food Stamps/SNAP in the past 12 months: 11 Household did not receive Food Stamps/SNAP in the past 12 months: 294
Women who had a birth in the past 12 months: 30 (22 now married, 8 unmarried) Women who did not have a birth in the past 12 months: 291 (108 now married, 182 unmarried)
Housing units in zip code 93925 with a mortgage: 112 (2 second mortgage, 2 both second mortgage and home equity loan) Median monthly owner costs for units with a mortgage: $2,208 Median monthly owner costs for units without a mortgage: $952
Residents with income below the poverty level in 2022:
This zip code:
16.9%
Whole state:
12.2%
Residents with income below 50% of the poverty level in 2022:
This zip code:
11.3%
Whole state:
6.2%
Median number of rooms in houses and condos:
Here:
5.5
State:
6.0
Median number of rooms in apartments:
Here:
4.5
State:
3.9
Notable locations in this zip code not listed on our city pages
Size of family households: 52 2-persons, 20 3-persons, 79 4-persons, 48 5-persons, 43 6-persons, 29 7-or-more-persons
Size of nonfamily households: 14 1-person, 17 2-persons
228 married couples with children.
93 single-parent households (93 women).
17.4% of residents of 93925 zip code speak English at home.
82.3% of residents speak Spanish at home (46% very well, 17% well, 23% not well, 14% not at all).
0.3% of residents speak Asian or Pacific Island language at home (100% well).
Foreign born population: 466 (34.8%) (12.5% of them are naturalized citizens)
This zip code:
34.8%
Whole state:
26.7%
98%Honduras
1%Thailand
1%English
1%Portuguese
1%Irish
0%Scandinavian
0%Swiss
0%Swedish
0%Norwegian
Year of entry for the foreign-born population
712010 or later
732000 to 2009
1411990 to 1999
188Before 1990
Facilities with environmental interests located in this zip code:
CHUALAR ELEMENTARY (24285 LINCOLN ST. in CHUALAR, CA)
(National Center for Education Statistics) - STATE ID-6026082 Organizations: CHUALAR UNION ELEMENTARY (SCHOOL DISTRICT)
Housing units lacking complete plumbing facilities: 4.0% Housing units lacking complete kitchen facilities: 3.3%
74.5%Electricity
11.8%Utility gas
11.8%Bottled, tank, or LP gas
1.3%Other fuel
0.7%Fuel oil, kerosene, etc.
Population in 1990: 12. Population change in the 1990s: +1,123 (+9358.3%).
Place of birth for U.S.-born residents:
This state: 804
Northeast: 7
Midwest: 2
South: 10
West: 38
65% of the 93925 zip code residents lived in the same house 5 years ago. Out of people who lived in different houses, 78% lived in this county. Out of people who lived in different counties, 50% lived in California.
100% of the 93925 zip code residents lived in the same house 1 year ago.
Private vs. public school enrollment:
Students in private schools in grades 1 to 8 (elementary and middle school):
Here:
0.0%
California:
10.5%
Students in private schools in grades 9 to 12 (high school):
Here:
0.0%
California:
8.5%
Students in private undergraduate colleges:
Here:
0.0%
California:
15.9%
Occupation by median earnings in the past 12 months ($)
41,943Management occupations
40,581Installation, maintenance, and repair occupations
34,736Building and grounds cleaning and maintenance occupations
34,367Office and administrative support occupations
30,057Farming, fishing, and forestry occupations
25,478Material moving occupations
Top industries in this zip code by the number of employees in 2005:
Wholesale Trade: General Line Grocery Merchant Wholesalers (5-9 employees: 1 establishment)
Construction: New Single-Family Housing Construction (except Operative Builders) (5-9: 1)
Construction: Electrical Contractors (5-9: 1)
Wholesale Trade: Fresh Fruit and Vegetable Merchant Wholesalers (1-4: 1)
Construction: Residential Remodelers (1-4: 1)
Wholesale Trade: Industrial and Personal Service Paper Merchant Wholesalers (1-4: 1)
Fatal accident statistics in 2014:
Fatal accident count: 1
Vehicles involved in fatal accidents: 1
Fatal accidents caused by drunken drivers: 1
Fatalities: 1
Persons involved in fatal accidents: 1
Pedestrians involved in fatal accidents: 0
Home Mortgage Disclosure Act Aggregated Statistics For Year 2009 (Based on 4 partial tracts)
A) FHA, FSA/RHS & VA Home Purchase Loans
B) Conventional Home Purchase Loans
C) Refinancings
D) Home Improvement Loans
F) Non-occupant Loans on < 5 Family Dwellings (A B C & D)
Number
Average Value
Number
Average Value
Number
Average Value
Number
Average Value
Number
Average Value
LOANS ORIGINATED
50
$190,459
22
$149,176
21
$339,208
3
$105,230
10
$321,375
APPLICATIONS APPROVED, NOT ACCEPTED
6
$191,397
3
$125,433
1
$133,330
0
$0
1
$74,990
APPLICATIONS DENIED
10
$173,400
7
$202,616
18
$305,789
2
$69,280
5
$196,342
APPLICATIONS WITHDRAWN
7
$156,770
4
$216,702
5
$209,674
0
$0
1
$147,850
FILES CLOSED FOR INCOMPLETENESS
1
$225,490
1
$262,090
3
$267,323
0
$0
1
$94,120
Aggregated Statistics For Year 2008 (Based on 4 partial tracts)
A) FHA, FSA/RHS & VA Home Purchase Loans
B) Conventional Home Purchase Loans
C) Refinancings
D) Home Improvement Loans
F) Non-occupant Loans on < 5 Family Dwellings (A B C & D)
Number
Average Value
Number
Average Value
Number
Average Value
Number
Average Value
Number
Average Value
LOANS ORIGINATED
17
$234,374
30
$198,627
26
$240,575
1
$225,490
14
$218,298
APPLICATIONS APPROVED, NOT ACCEPTED
2
$214,710
8
$291,832
9
$301,600
1
$24,020
3
$203,487
APPLICATIONS DENIED
8
$241,096
12
$243,523
46
$325,237
5
$59,716
3
$302,833
APPLICATIONS WITHDRAWN
1
$221,240
7
$252,103
9
$272,787
1
$54,250
0
$0
FILES CLOSED FOR INCOMPLETENESS
0
$0
3
$270,807
5
$308,108
1
$180,090
0
$0
Aggregated Statistics For Year 2007 (Based on 4 partial tracts)
B) Conventional Home Purchase Loans
C) Refinancings
D) Home Improvement Loans
E) Loans on Dwellings For 5+ Families
F) Non-occupant Loans on < 5 Family Dwellings (A B C & D)
G) Loans On Manufactured Home Dwelling (A B C & D)
Number
Average Value
Number
Average Value
Number
Average Value
Number
Average Value
Number
Average Value
Number
Average Value
LOANS ORIGINATED
15
$290,024
117
$344,797
14
$243,139
1
$164,220
12
$298,422
1
$64,710
APPLICATIONS APPROVED, NOT ACCEPTED
9
$355,268
42
$331,313
3
$150,327
0
$0
5
$230,068
0
$0
APPLICATIONS DENIED
19
$305,575
94
$369,084
18
$159,760
0
$0
10
$373,859
0
$0
APPLICATIONS WITHDRAWN
7
$303,550
31
$340,821
4
$169,445
0
$0
3
$296,953
0
$0
FILES CLOSED FOR INCOMPLETENESS
6
$255,588
7
$291,413
1
$238,560
0
$0
1
$34,640
0
$0
Aggregated Statistics For Year 2006 (Based on 4 partial tracts)
A) FHA, FSA/RHS & VA Home Purchase Loans
B) Conventional Home Purchase Loans
C) Refinancings
D) Home Improvement Loans
E) Loans on Dwellings For 5+ Families
F) Non-occupant Loans on < 5 Family Dwellings (A B C & D)
G) Loans On Manufactured Home Dwelling (A B C & D)
Number
Average Value
Number
Average Value
Number
Average Value
Number
Average Value
Number
Average Value
Number
Average Value
Number
Average Value
LOANS ORIGINATED
14
$200,749
107
$277,652
201
$359,677
39
$266,109
1
$218,960
27
$329,591
0
$0
APPLICATIONS APPROVED, NOT ACCEPTED
0
$0
18
$321,789
40
$363,798
7
$280,301
0
$0
5
$330,722
0
$0
APPLICATIONS DENIED
0
$0
54
$300,547
114
$409,585
26
$250,555
0
$0
10
$422,748
1
$83,010
APPLICATIONS WITHDRAWN
0
$0
24
$335,351
62
$411,673
6
$189,653
0
$0
6
$669,097
0
$0
FILES CLOSED FOR INCOMPLETENESS
0
$0
7
$272,364
20
$355,763
1
$263,400
0
$0
4
$315,240
0
$0
Aggregated Statistics For Year 2005 (Based on 4 partial tracts)
A) FHA, FSA/RHS & VA Home Purchase Loans
B) Conventional Home Purchase Loans
C) Refinancings
D) Home Improvement Loans
F) Non-occupant Loans on < 5 Family Dwellings (A B C & D)
G) Loans On Manufactured Home Dwelling (A B C & D)
Number
Average Value
Number
Average Value
Number
Average Value
Number
Average Value
Number
Average Value
Number
Average Value
LOANS ORIGINATED
1
$158,170
82
$371,550
242
$318,649
27
$269,913
29
$318,390
0
$0
APPLICATIONS APPROVED, NOT ACCEPTED
1
$86,280
16
$340,526
40
$294,198
6
$233,553
2
$347,060
1
$50,980
APPLICATIONS DENIED
0
$0
36
$382,955
132
$326,941
20
$168,106
18
$295,137
1
$49,020
APPLICATIONS WITHDRAWN
0
$0
15
$309,153
81
$326,639
6
$163,835
6
$441,072
0
$0
FILES CLOSED FOR INCOMPLETENESS
0
$0
6
$549,242
18
$341,143
2
$268,305
1
$228,760
0
$0
Aggregated Statistics For Year 2004 (Based on 4 partial tracts)
A) FHA, FSA/RHS & VA Home Purchase Loans
B) Conventional Home Purchase Loans
C) Refinancings
D) Home Improvement Loans
E) Loans on Dwellings For 5+ Families
F) Non-occupant Loans on < 5 Family Dwellings (A B C & D)
G) Loans On Manufactured Home Dwelling (A B C & D)
Number
Average Value
Number
Average Value
Number
Average Value
Number
Average Value
Number
Average Value
Number
Average Value
Number
Average Value
LOANS ORIGINATED
1
$103,270
78
$269,467
243
$258,474
28
$168,617
1
$228,760
25
$262,166
1
$7,190
APPLICATIONS APPROVED, NOT ACCEPTED
0
$0
26
$261,855
45
$263,357
1
$196,080
0
$0
4
$383,010
0
$0
APPLICATIONS DENIED
0
$0
23
$315,944
98
$281,898
8
$152,736
0
$0
8
$343,805
1
$65,360
APPLICATIONS WITHDRAWN
0
$0
15
$244,969
92
$239,013
10
$146,668
0
$0
7
$251,263
0
$0
FILES CLOSED FOR INCOMPLETENESS
0
$0
2
$276,800
18
$238,092
1
$209,810
0
$0
3
$225,273
0
$0
Aggregated Statistics For Year 2003 (Based on 4 partial tracts)
A) FHA, FSA/RHS & VA Home Purchase Loans
B) Conventional Home Purchase Loans
C) Refinancings
D) Home Improvement Loans
E) Loans on Dwellings For 5+ Families
F) Non-occupant Loans on < 5 Family Dwellings (A B C & D)
Number
Average Value
Number
Average Value
Number
Average Value
Number
Average Value
Number
Average Value
Number
Average Value
LOANS ORIGINATED
5
$260,132
99
$214,117
332
$196,250
7
$38,189
2
$220,265
21
$164,392
APPLICATIONS APPROVED, NOT ACCEPTED
1
$186,280
24
$184,506
65
$208,750
1
$13,070
0
$0
11
$208,915
APPLICATIONS DENIED
1
$37,260
24
$199,212
93
$202,763
6
$30,610
0
$0
10
$158,400
APPLICATIONS WITHDRAWN
0
$0
18
$171,252
76
$206,525
3
$30,937
1
$849,680
1
$341,290
FILES CLOSED FOR INCOMPLETENESS
0
$0
3
$341,833
10
$219,054
0
$0
0
$0
0
$0
Aggregated Statistics For Year 1999 (Based on 1 partial tract)
A) FHA, FSA/RHS & VA Home Purchase Loans
B) Conventional Home Purchase Loans
C) Refinancings
D) Home Improvement Loans
E) Loans on Dwellings For 5+ Families
F) Non-occupant Loans on < 5 Family Dwellings (A B C & D)
Detailed PMIC statistics for the following Tracts:0108.01
, 0108.02
2005 - 2018 National Fire Incident Reporting System (NFIRS) incidents
Based on the data from the years 2005 - 2018 the average number of fires per year is 8. The highest number of fires - 16 took place in 2013, and the least - 1 in 2005. The data has a growing trend.
When looking into fire subcategories, the most reports belonged to: Mobile Property/Vehicle Fires (39.4%), and Outside Fires (33.9%).
Fire incident types reported to NFIRS in Zip Code 93925


 Nearest zip codes: 93926, 93960, 93908, 93905, 93901, 93962.


 Based on the data from the years 2005 - 2018 the average number of fires per year is 8. The highest number of fires - 16 took place in 2013, and the least - 1 in 2005. The data has a growing trend.
 When looking into fire subcategories, the most reports belonged to: Mobile Property/Vehicle Fires (39.4%), and Outside Fires (33.9%).