Estimated median house/condo value in 2022: $1,173,151
94038:
$1,173,151
California:
$715,900
According to our research of California and other state lists, there was 1 registered sex offender living in 94038 zip code as of May 28, 2024. The ratio of all residents to sex offenders in zip code 94038 is 3,680 to 1. The ratio of registered sex offenders to all residents in this zip code is much lower than the state average.
Median resident age:
This zip code:
47.3 years
California median age:
37.9 years
Average household size:
This zip code:
2.7 people
California:
2.8 people
Averages for the 2020 tax year for zip code 94038, filed in 2021:
Average Adjusted Gross Income (AGI) in 2020: $129,226 (Individual Income Tax Returns)
Here:
$129,226
State:
$95,910
Salary/wage: $115,197 (reported on 77.3% of returns)
Here:
$115,197
State:
$77,331
(% of AGI for various income ranges: 1596.2% for AGIs below $25k, 4980.0% for AGIs $25k-50k, 8440.0% for AGIs $50k-75k, 10150.0% for AGIs $75k-100k, 20700.0% for AGIs $100k-200k, 120620.0% for AGIs over 200k)
Taxable interest for individuals: $1,435 (reported on 42.2% of returns)
This zip code:
$1,435
California:
$2,294
(% of AGI for various income ranges: 34.4% for AGIs below $25k, 60.0% for AGIs $25k-50k, 90.0% for AGIs $50k-75k, 103.8% for AGIs $75k-100k, 267.7% for AGIs $100k-200k, 394.3% for AGIs over 200k)
Ordinary dividends: $9,492 (reported on 33.1% of returns)
Here:
$9,492
State:
$10,949
(% of AGI for various income ranges: 79.4% for AGIs below $25k, 137.3% for AGIs $25k-50k, 223.3% for AGIs $50k-75k, 467.5% for AGIs $75k-100k, 912.3% for AGIs $100k-200k, 3924.3% for AGIs over 200k)
Net capital gain/loss in AGI: +$32,455 (reported on 30.5% of returns)
Here:
+$32,455
State:
+$49,306
(% of AGI for various income ranges: 66.9% for AGIs below $25k, 27.3% for AGIs $25k-50k, 128.9% for AGIs $50k-75k, 568.8% for AGIs $75k-100k, 870.8% for AGIs $100k-200k, 19147.1% for AGIs over 200k)
Profit/loss from business: +$33,110 (reported on 18.8% of returns)
Here:
+$33,110
State:
+$15,671
(% of AGI for various income ranges: 211.9% for AGIs below $25k, 374.7% for AGIs $25k-50k, 711.1% for AGIs $50k-75k, 1147.5% for AGIs $75k-100k, 1100.0% for AGIs $100k-200k, 8161.4% for AGIs over 200k)
Taxable individual retirement arrangement distribution: $29,000 (reported on 11.7% of returns)
94038:
$29,000
California:
$23,505
(% of AGI for various income ranges: 436.0% for AGIs $25k-50k, 593.8% for AGIs $75k-100k, 1492.3% for AGIs $100k-200k, 3072.9% for AGIs over 200k)
Self-employed (Keogh) retirement plans: $19,600 (reported on 1.9% of returns)
94038:
$19,600
California:
$30,163
(% of AGI for various income ranges: 452.3% for AGIs $100k-200k)
Total itemized deductions: $34,172 (reported on 23.4% of returns)
Here:
$34,172
State:
$39,517
(% of AGI for various income ranges: 576.0% for AGIs $25k-50k, 547.8% for AGIs $50k-75k, 918.8% for AGIs $75k-100k, 2659.2% for AGIs $100k-200k, 9647.1% for AGIs over 200k)
Charity contributions: $6,667 (reported on 17.5% of returns)
Here:
$6,667
State:
$12,598
(% of AGI for various income ranges: 160.0% for AGIs $50k-75k, 264.6% for AGIs $100k-200k, 1874.3% for AGIs over 200k)
Taxes paid: $9,139 (reported on 23.4% of returns)
94038:
$9,139
State:
$8,807
(% of AGI for various income ranges: 128.0% for AGIs $25k-50k, 176.7% for AGIs $50k-75k, 303.8% for AGIs $75k-100k, 781.5% for AGIs $100k-200k, 2400.0% for AGIs over 200k)
Earned income credit: $1,691 (reported on 7.1% of returns)
Here:
$1,691
State:
$2,074
(% of AGI for various income ranges: 68.1% for AGIs below $25k, 51.3% for AGIs $25k-50k)
Percentage of individuals using paid preparers for their 2020 taxes: 89.0%
Here:
89%
State:
92%
(% for various income ranges: 82.4% for AGIs below $25k, 82.8% for AGIs $25k-50k, 88.9% for AGIs $50k-75k, 93.3% for AGIs $75k-100k, 93.3% for AGIs $100k-200k, 96.4% for AGIs over 200k)
Averages for the 2012 tax year for zip code 94038, filed in 2013:
Average Adjusted Gross Income (AGI) in 2012: $99,477 (Individual Income Tax Returns)
Here:
$99,477
State:
$72,726
Salary/wage: $82,617 (reported on 82.2% of returns)
Here:
$82,617
State:
$59,079
(% of AGI for various income ranges: 73.3% for AGIs below $25k, 72.7% for AGIs $25k-50k, 67.4% for AGIs $50k-75k, 71.4% for AGIs $75k-100k, 77.8% for AGIs $100k-200k, 61.7% for AGIs over 200k)
Taxable interest for individuals: $1,369 (reported on 41.8% of returns)
This zip code:
$1,369
California:
$2,146
(% of AGI for various income ranges: 1.0% for AGIs below $25k, 0.8% for AGIs $25k-50k, 0.5% for AGIs $50k-75k, 1.0% for AGIs $75k-100k, 0.8% for AGIs $100k-200k, 0.3% for AGIs over 200k)
Ordinary dividends: $5,926 (reported on 28.8% of returns)
Here:
$5,926
State:
$9,308
(% of AGI for various income ranges: 2.1% for AGIs below $25k, 1.6% for AGIs $25k-50k, 1.7% for AGIs $50k-75k, 4.0% for AGIs $75k-100k, 1.3% for AGIs $100k-200k, 1.6% for AGIs over 200k)
Net capital gain/loss in AGI: +$16,019 (reported on 25.3% of returns)
Here:
+$16,019
State:
+$30,460
(% of AGI for various income ranges: 0.3% for AGIs $50k-75k, 0.7% for AGIs $100k-200k, 8.0% for AGIs over 200k)
Profit/loss from business: +$23,539 (reported on 22.6% of returns)
Here:
+$23,539
State:
+$17,064
(% of AGI for various income ranges: 11.2% for AGIs below $25k, 6.8% for AGIs $25k-50k, 13.9% for AGIs $50k-75k, 3.0% for AGIs $100k-200k, 5.3% for AGIs over 200k)
Taxable individual retirement arrangement distribution: $23,831 (reported on 8.9% of returns)
94038:
$23,831
California:
$19,557
(% of AGI for various income ranges: 3.9% for AGIs $25k-50k, 4.4% for AGIs $50k-75k, 3.7% for AGIs $100k-200k, 1.1% for AGIs over 200k)
Self-employment retirement plans: $17,250 (reported on 2.7% of returns)
94038:
$17,250
California:
$24,530
Total itemized deductions: $38,817 (21% of AGI, reported on 44.5% of returns)
Here:
$38,817
State:
$34,004
Here:
21.1% of AGI
State:
22.7% of AGI
(% of AGI for various income ranges: 12.3% for AGIs below $25k, 10.8% for AGIs $25k-50k, 15.4% for AGIs $50k-75k, 17.8% for AGIs $75k-100k, 21.9% for AGIs $100k-200k, 16.4% for AGIs over 200k)
Charity contributions: $3,365 (reported on 37.0% of returns)
Here:
$3,365
State:
$4,659
(% of AGI for various income ranges: 0.9% for AGIs $25k-50k, 1.3% for AGIs $50k-75k, 1.1% for AGIs $75k-100k, 1.3% for AGIs $100k-200k, 1.4% for AGIs over 200k)
Taxes paid: $18,866 (reported on 44.5% of returns)
94038:
$18,866
State:
$14,448
(% of AGI for various income ranges: 2.6% for AGIs below $25k, 3.3% for AGIs $25k-50k, 4.9% for AGIs $50k-75k, 6.6% for AGIs $75k-100k, 10.0% for AGIs $100k-200k, 9.5% for AGIs over 200k)
Earned income credit: $1,969 (reported on 8.9% of returns)
Here:
$1,969
State:
$2,286
(% of AGI for various income ranges: 3.2% for AGIs below $25k, 0.8% for AGIs $25k-50k)
Percentage of individuals using paid preparers for their 2012 taxes: 59.6%
Here:
60%
State:
64%
(% for various income ranges: 54.5% for AGIs below $25k, 60.7% for AGIs $25k-50k, 55.6% for AGIs $50k-75k, 60.0% for AGIs $75k-100k, 58.6% for AGIs $100k-200k, 76.5% for AGIs over 200k)
Averages for the 2004 tax year for zip code 94038, filed in 2005:
Average Adjusted Gross Income (AGI) in 2004: $74,804 (Individual Income Tax Returns)
Here:
$74,804
State:
$58,600
Salary/wage: $70,612 (reported on 83.4% of returns)
Here:
$70,612
State:
$49,455
(% of AGI for various income ranges: 183.2% for AGIs below $10k, 67.4% for AGIs $10k-25k, 78.4% for AGIs $25k-50k, 80.6% for AGIs $50k-75k, 74.9% for AGIs $75k-100k, 79.0% for AGIs over 100k)
Taxable interest for individuals: $1,131 (reported on 57.0% of returns)
This zip code:
$1,131
California:
$2,365
(% of AGI for various income ranges: 12.1% for AGIs below $10k, 3.3% for AGIs $10k-25k, 1.2% for AGIs $25k-50k, 0.6% for AGIs $50k-75k, 1.0% for AGIs $75k-100k, 0.6% for AGIs over 100k)
Taxable dividends: $3,048 (reported on 35.7% of returns)
Here:
$3,048
State:
$4,746
(% of AGI for various income ranges: 18.5% for AGIs below $10k, 2.1% for AGIs $10k-25k, 0.8% for AGIs $25k-50k, 2.5% for AGIs $50k-75k, 2.1% for AGIs $75k-100k, 1.1% for AGIs over 100k)
Net capital gain/loss: +$11,374 (reported on 30.4% of returns)
Here:
+$11,374
State:
+$23,418
(% of AGI for various income ranges: -16.4% for AGIs below $10k, 1.3% for AGIs $10k-25k, 0.5% for AGIs $25k-50k, 2.9% for AGIs $50k-75k, 0.1% for AGIs $75k-100k, 6.7% for AGIs over 100k)
Profit/loss from business: +$25,003 (reported on 23.9% of returns)
Here:
+$25,003
State:
+$16,826
(% of AGI for various income ranges: 68.3% for AGIs below $10k, 15.1% for AGIs $10k-25k, 8.7% for AGIs $25k-50k, 5.3% for AGIs $50k-75k, 8.3% for AGIs $75k-100k, 7.5% for AGIs over 100k)
IRA payment deduction: $3,255 (reported on 3.5% of returns)
94038:
$3,255
California:
$3,192
Self-employed pension: $10,306 (reported on 3.7% of returns)
Here:
$10,306
California:
$17,688
(% of AGI for various income ranges: 1.5% for AGIs $10k-25k, 0.4% for AGIs $50k-75k, 0.7% for AGIs over 100k)
Total itemized deductions: $31,113 (26% of AGI, reported on 51.1% of returns)
Here:
$31,113
State:
$28,113
Here:
25.8% of AGI
State:
25.3% of AGI
(% of AGI for various income ranges: 84.5% for AGIs below $10k, 19.6% for AGIs $10k-25k, 16.2% for AGIs $25k-50k, 21.1% for AGIs $50k-75k, 25.4% for AGIs $75k-100k, 20.9% for AGIs over 100k)
Charity contributions deductions: $2,757 (2% of AGI, reported on 45.1% of returns)
Here:
$2,757
State:
$3,923
Here:
2.2% of AGI
State:
3.3% of AGI
(% of AGI for various income ranges: 1.5% for AGIs below $10k, 1.5% for AGIs $10k-25k, 0.8% for AGIs $25k-50k, 1.5% for AGIs $50k-75k, 1.8% for AGIs $75k-100k, 1.8% for AGIs over 100k)
Total tax: $12,861 (reported on 83.3% of returns)
94038:
$12,861
State:
$10,761
(% of AGI for various income ranges: 12.3% for AGIs below $10k, 5.7% for AGIs $10k-25k, 8.2% for AGIs $25k-50k, 9.4% for AGIs $50k-75k, 10.5% for AGIs $75k-100k, 17.4% for AGIs over 100k)
Earned income credit: $1,261 (reported on 8.4% of returns)
Here:
$1,261
State:
$1,763
Percentage of individuals using paid preparers for their 2004 taxes: 63.7%
Here:
64%
State:
66%
(% for various income ranges: 59.3% for AGIs below $10k, 60.2% for AGIs $10k-25k, 69.4% for AGIs $25k-50k, 65.4% for AGIs $50k-75k, 57.8% for AGIs $75k-100k, 65.6% for AGIs over 100k)
Household received Food Stamps/SNAP in the past 12 months: 0 Household did not receive Food Stamps/SNAP in the past 12 months: 1,076
Women who did not have a birth in the past 12 months: 732 (313 now married, 417 unmarried)
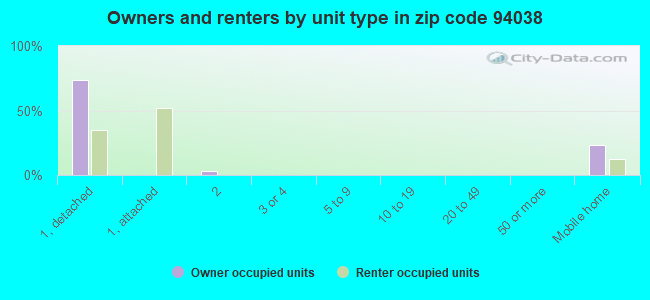
Housing units in zip code 94038 with a mortgage: 498 (24 second mortgage, 25 both second mortgage and home equity loan) Median monthly owner costs for units with a mortgage: $3,068 Median monthly owner costs for units without a mortgage: $1,268
Residents with income below the poverty level in 2022:
This zip code:
5.1%
Whole state:
12.2%
Residents with income below 50% of the poverty level in 2022:
This zip code:
4.6%
Whole state:
6.2%
Median number of rooms in houses and condos:
Here:
5.7
State:
6.0
Median number of rooms in apartments:
Here:
4.7
State:
3.9
Notable locations in this zip code not listed on our city pages
Notable locations in zip code 94038: Point Montara Light Station (A), Department of Forestry and Fire Protection Station 44 Coast Side Fire Protection District (B). Display/hide their locations on the map
In group quarters: 132 (-1 institutionalized population)
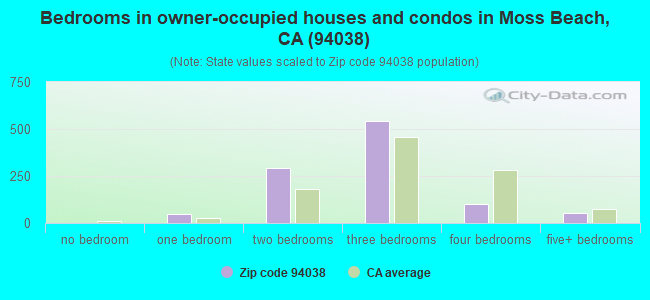
Size of family households: 300 2-persons, 94 3-persons, 188 4-persons, 135 5-persons, 35 6-persons
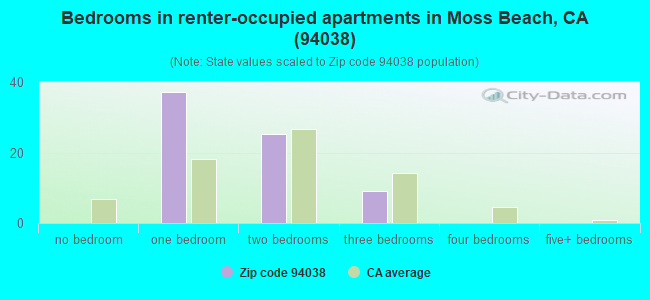
Size of nonfamily households: 298 1-person, 49 2-persons
601 married couples with children.
46 single-parent households (21 men, 25 women).
68.7% of residents of 94038 zip code speak English at home.
26.2% of residents speak Spanish at home (53% very well, 32% well, 13% not well, 1% not at all).
3.3% of residents speak other Indo-European language at home (50% very well, 50% not at all).
1.3% of residents speak Asian or Pacific Island language at home (11% very well, 16% well, 46% not well, 27% not at all).
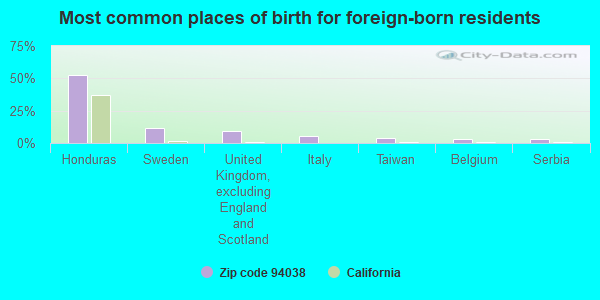
Foreign born population: 764 (24.4%) (66.8% of them are naturalized citizens)
This zip code:
24.4%
Whole state:
26.7%
53%Honduras
11%Sweden
9%United Kingdom, excluding England and Scotland
5%Italy
4%Taiwan
3%Belgium
3%Serbia
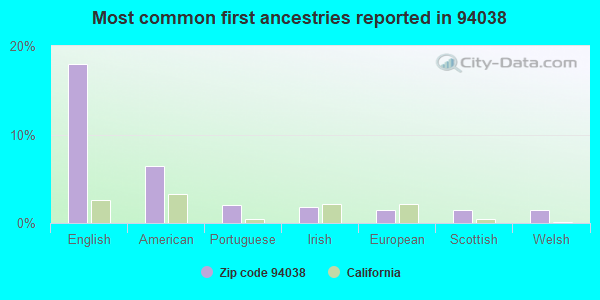
18%English
6%American
2%Portuguese
2%Irish
1%European
1%Scottish
1%Welsh
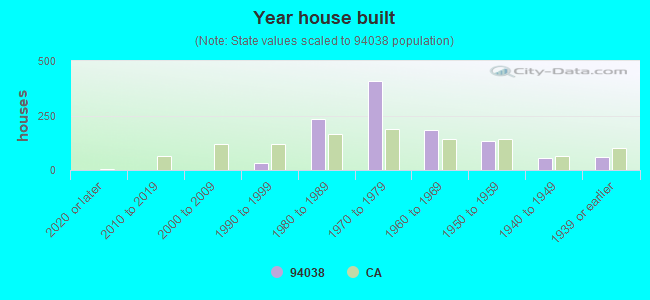
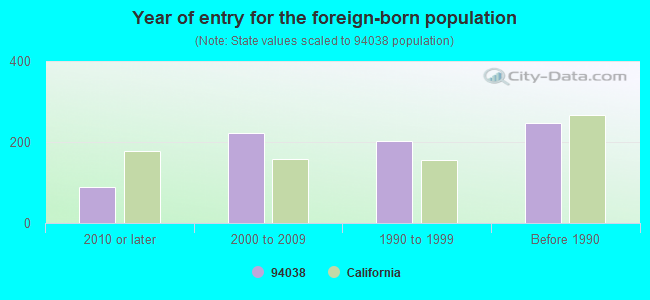
Year of entry for the foreign-born population
882010 or later
2222000 to 2009
2031990 to 1999
246Before 1990
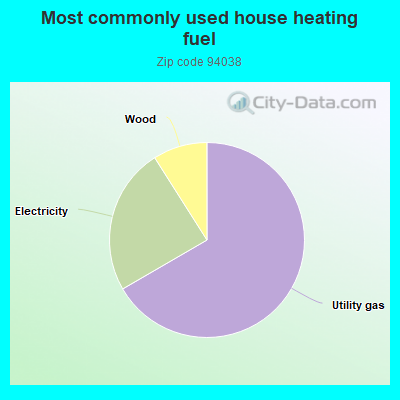
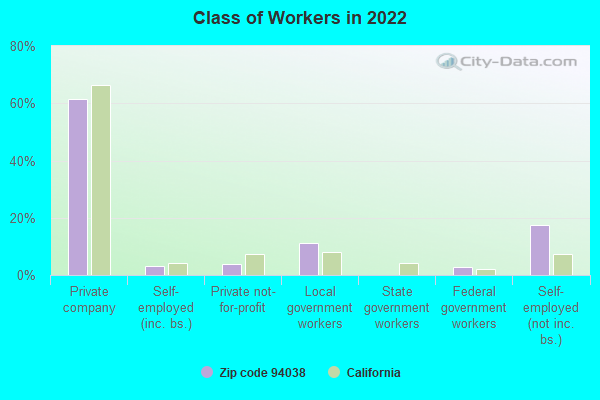
66.7%Utility gas
24.4%Electricity
9.0%Wood
Population in 1990: 5,415.
Place of birth for U.S.-born residents:
This state: 1,575
Northeast: 156
Midwest: 201
South: 304
West: 111
60% of the 94038 zip code residents lived in the same house 5 years ago. Out of people who lived in different houses, 63% lived in this county. Out of people who lived in different counties, 50% lived in California.
95% of the 94038 zip code residents lived in the same house 1 year ago. Out of people who lived in different houses, 73% moved from this county. Out of people who lived in different houses, 29% moved from different county within same state.
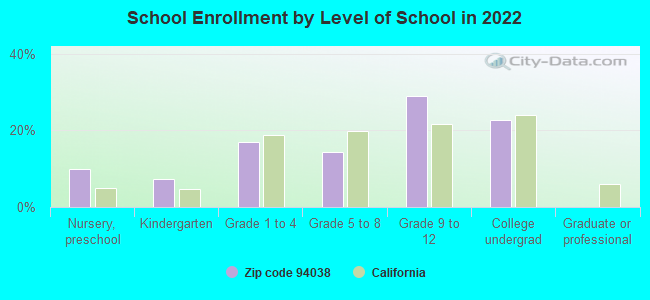
Private vs. public school enrollment:
Students in private schools in grades 1 to 8 (elementary and middle school): 42
Here:
16.8%
California:
10.5%
Students in private schools in grades 9 to 12 (high school): 38
Here:
16.7%
California:
8.5%
Students in private undergraduate colleges: 29
Here:
16.3%
California:
15.9%
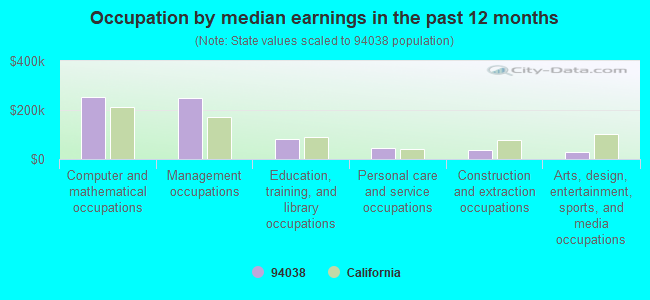
Occupation by median earnings in the past 12 months ($)
253,705Computer and mathematical occupations
248,553Management occupations
80,435Education, training, and library occupations
43,369Personal care and service occupations
38,686Construction and extraction occupations
29,370Arts, design, entertainment, sports, and media occupations
Top industries in this zip code by the number of employees in 2005:
Health Care and Social Assistance: General Medical and Surgical Hospitals (100-249 employees: 1 establishment)
Accommodation and Food Services: Full-Service Restaurants (50-99: 1, 5-9: 1)
Accommodation and Food Services: Bed-and-Breakfast Inns (10-19: 1)
Accommodation and Food Services: Snack and Nonalcoholic Beverage Bars (10-19: 1)
Other Services (except Public Administration): Reupholstery and Furniture Repair (10-19: 1)
Construction: All Other Specialty Trade Contractors (5-9: 1)
Accommodation and Food Services: Limited-Service Restaurants (5-9: 1)
Professional, Scientific, and Technical Services: Administrative Management and General Management Consulting Services (1-4: 2)
People in group quarters in 2010:
108 people in nursing facilities/skilled-nursing facilities
6 people in workers' group living quarters and job corps centers
6 people in other noninstitutional facilities
People in group quarters in 2000:
111 people in hospitals/wards and hospices for chronically ill
111 people in other hospitals or wards for chronically ill
Home Mortgage Disclosure Act Aggregated Statistics For Year 2009 (Based on 2 partial tracts)
A) FHA, FSA/RHS & VA Home Purchase Loans
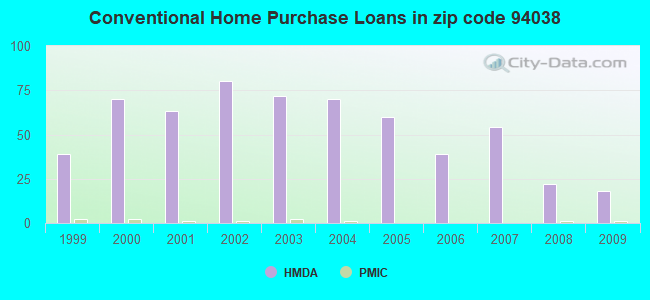
B) Conventional Home Purchase Loans
C) Refinancings
D) Home Improvement Loans
F) Non-occupant Loans on < 5 Family Dwellings (A B C & D)
G) Loans On Manufactured Home Dwelling (A B C & D)
Number
Average Value
Number
Average Value
Number
Average Value
Number
Average Value
Number
Average Value
Number
Average Value
LOANS ORIGINATED
5
$637,462
18
$497,604
189
$369,449
12
$316,581
11
$394,442
1
$62,550
APPLICATIONS APPROVED, NOT ACCEPTED
1
$867,770
3
$614,947
16
$403,722
1
$274,550
2
$516,845
1
$39,500
APPLICATIONS DENIED
0
$0
4
$296,610
47
$517,853
3
$249,753
3
$383,847
1
$61,890
APPLICATIONS WITHDRAWN
0
$0
2
$473,060
22
$408,358
1
$264,020
3
$419,620
1
$37,530
FILES CLOSED FOR INCOMPLETENESS
0
$0
1
$371,340
9
$502,506
2
$72,425
0
$0
0
$0
Aggregated Statistics For Year 2008 (Based on 2 partial tracts)
A) FHA, FSA/RHS & VA Home Purchase Loans
B) Conventional Home Purchase Loans
C) Refinancings
D) Home Improvement Loans
E) Loans on Dwellings For 5+ Families
F) Non-occupant Loans on < 5 Family Dwellings (A B C & D)
G) Loans On Manufactured Home Dwelling (A B C & D)
Number
Average Value
Number
Average Value
Number
Average Value
Number
Average Value
Number
Average Value
Number
Average Value
Number
Average Value
LOANS ORIGINATED
1
$400,310
22
$524,356
57
$426,978
5
$168,946
0
$0
8
$356,935
0
$0
APPLICATIONS APPROVED, NOT ACCEPTED
0
$0
2
$337,430
9
$442,152
0
$0
0
$0
1
$246,900
3
$45,430
APPLICATIONS DENIED
0
$0
3
$269,287
34
$636,983
5
$185,800
1
$198,840
3
$410,183
4
$39,340
APPLICATIONS WITHDRAWN
0
$0
3
$679,687
15
$584,527
2
$171,185
0
$0
1
$394,380
0
$0
FILES CLOSED FOR INCOMPLETENESS
0
$0
0
$0
8
$551,492
0
$0
0
$0
1
$269,940
0
$0
Aggregated Statistics For Year 2007 (Based on 2 partial tracts)
B) Conventional Home Purchase Loans
C) Refinancings
D) Home Improvement Loans
E) Loans on Dwellings For 5+ Families
F) Non-occupant Loans on < 5 Family Dwellings (A B C & D)
G) Loans On Manufactured Home Dwelling (A B C & D)
Number
Average Value
Number
Average Value
Number
Average Value
Number
Average Value
Number
Average Value
Number
Average Value
LOANS ORIGINATED
54
$586,561
97
$484,467
14
$344,579
1
$823,000
17
$476,449
0
$0
APPLICATIONS APPROVED, NOT ACCEPTED
8
$622,681
24
$497,558
4
$341,050
0
$0
3
$386,043
0
$0
APPLICATIONS DENIED
16
$558,035
41
$572,085
4
$299,242
0
$0
2
$624,165
1
$57,280
APPLICATIONS WITHDRAWN
7
$557,006
21
$573,341
2
$790,080
0
$0
3
$429,937
1
$40,160
FILES CLOSED FOR INCOMPLETENESS
0
$0
8
$497,174
0
$0
0
$0
1
$286,400
0
$0
Aggregated Statistics For Year 2006 (Based on 2 partial tracts)
B) Conventional Home Purchase Loans
C) Refinancings
D) Home Improvement Loans
F) Non-occupant Loans on < 5 Family Dwellings (A B C & D)
G) Loans On Manufactured Home Dwelling (A B C & D)
Number
Average Value
Number
Average Value
Number
Average Value
Number
Average Value
Number
Average Value
LOANS ORIGINATED
39
$586,094
103
$519,126
16
$391,460
7
$488,439
1
$89,540
APPLICATIONS APPROVED, NOT ACCEPTED
6
$564,688
18
$549,874
4
$350,105
0
$0
0
$0
APPLICATIONS DENIED
15
$570,701
37
$532,841
6
$573,687
5
$404,784
3
$49,380
APPLICATIONS WITHDRAWN
5
$733,458
18
$519,002
2
$311,095
1
$339,080
0
$0
FILES CLOSED FOR INCOMPLETENESS
1
$329,200
5
$557,402
0
$0
0
$0
0
$0
Aggregated Statistics For Year 2005 (Based on 2 partial tracts)
B) Conventional Home Purchase Loans
C) Refinancings
D) Home Improvement Loans
F) Non-occupant Loans on < 5 Family Dwellings (A B C & D)
G) Loans On Manufactured Home Dwelling (A B C & D)
Number
Average Value
Number
Average Value
Number
Average Value
Number
Average Value
Number
Average Value
LOANS ORIGINATED
60
$573,499
135
$458,880
15
$311,028
13
$452,827
2
$63,205
APPLICATIONS APPROVED, NOT ACCEPTED
9
$454,442
27
$425,985
1
$40,820
2
$303,195
1
$111,270
APPLICATIONS DENIED
16
$510,136
40
$461,555
5
$332,888
4
$353,725
7
$56,059
APPLICATIONS WITHDRAWN
6
$511,687
34
$425,210
6
$313,070
2
$639,305
1
$131,020
FILES CLOSED FOR INCOMPLETENESS
1
$1,077,140
8
$399,731
3
$475,363
1
$237,020
0
$0
Aggregated Statistics For Year 2004 (Based on 2 partial tracts)
B) Conventional Home Purchase Loans
C) Refinancings
D) Home Improvement Loans
E) Loans on Dwellings For 5+ Families
F) Non-occupant Loans on < 5 Family Dwellings (A B C & D)
G) Loans On Manufactured Home Dwelling (A B C & D)
Number
Average Value
Number
Average Value
Number
Average Value
Number
Average Value
Number
Average Value
Number
Average Value
LOANS ORIGINATED
70
$479,927
182
$395,868
11
$312,082
0
$0
13
$339,076
1
$48,720
APPLICATIONS APPROVED, NOT ACCEPTED
11
$449,448
26
$372,604
2
$115,220
0
$0
3
$202,567
1
$44,770
APPLICATIONS DENIED
9
$492,044
34
$425,598
5
$129,836
0
$0
5
$345,924
6
$68,145
APPLICATIONS WITHDRAWN
10
$484,780
34
$365,141
2
$211,675
1
$442,440
2
$400,635
2
$74,730
FILES CLOSED FOR INCOMPLETENESS
1
$422,030
9
$430,154
1
$49,380
0
$0
0
$0
0
$0
Aggregated Statistics For Year 2003 (Based on 2 partial tracts)
B) Conventional Home Purchase Loans
C) Refinancings
D) Home Improvement Loans
F) Non-occupant Loans on < 5 Family Dwellings (A B C & D)
Number
Average Value
Number
Average Value
Number
Average Value
Number
Average Value
LOANS ORIGINATED
72
$399,658
434
$328,188
6
$131,570
22
$313,219
APPLICATIONS APPROVED, NOT ACCEPTED
9
$340,832
65
$352,882
4
$122,955
4
$398,990
APPLICATIONS DENIED
16
$284,388
68
$366,129
3
$71,107
7
$337,759
APPLICATIONS WITHDRAWN
7
$404,821
57
$296,430
0
$0
1
$541,200
FILES CLOSED FOR INCOMPLETENESS
5
$336,574
10
$381,740
0
$0
1
$805,220
Aggregated Statistics For Year 2002 (Based on 2 partial tracts)
B) Conventional Home Purchase Loans
C) Refinancings
D) Home Improvement Loans
F) Non-occupant Loans on < 5 Family Dwellings (A B C & D)
Number
Average Value
Number
Average Value
Number
Average Value
Number
Average Value
LOANS ORIGINATED
80
$382,646
332
$329,414
9
$138,922
13
$265,994
APPLICATIONS APPROVED, NOT ACCEPTED
13
$408,866
58
$295,213
3
$60,793
1
$248,220
APPLICATIONS DENIED
14
$154,959
44
$334,198
1
$46,090
2
$313,070
APPLICATIONS WITHDRAWN
3
$352,023
40
$307,012
1
$62,550
3
$456,930
FILES CLOSED FOR INCOMPLETENESS
2
$437,180
14
$327,036
0
$0
0
$0
Aggregated Statistics For Year 2001 (Based on 2 partial tracts)
A) FHA, FSA/RHS & VA Home Purchase Loans
B) Conventional Home Purchase Loans
C) Refinancings
D) Home Improvement Loans
F) Non-occupant Loans on < 5 Family Dwellings (A B C & D)
Number
Average Value
Number
Average Value
Number
Average Value
Number
Average Value
Number
Average Value
LOANS ORIGINATED
1
$310,110
63
$346,810
192
$324,245
15
$64,260
14
$288,944
APPLICATIONS APPROVED, NOT ACCEPTED
0
$0
14
$253,625
26
$285,366
3
$64,743
3
$300,230
APPLICATIONS DENIED
0
$0
16
$357,388
37
$309,572
3
$39,503
2
$240,315
APPLICATIONS WITHDRAWN
0
$0
7
$481,384
31
$324,888
3
$44,113
1
$177,770
FILES CLOSED FOR INCOMPLETENESS
0
$0
3
$217,053
10
$415,582
1
$36,210
2
$341,380
Aggregated Statistics For Year 2000 (Based on 2 partial tracts)
B) Conventional Home Purchase Loans
C) Refinancings
D) Home Improvement Loans
F) Non-occupant Loans on < 5 Family Dwellings (A B C & D)
Number
Average Value
Number
Average Value
Number
Average Value
Number
Average Value
LOANS ORIGINATED
70
$360,239
54
$269,054
15
$63,426
9
$428,399
APPLICATIONS APPROVED, NOT ACCEPTED
14
$340,863
12
$282,838
4
$46,088
2
$383,520
APPLICATIONS DENIED
20
$141,292
16
$236,942
3
$80,107
1
$331,830
APPLICATIONS WITHDRAWN
9
$301,401
12
$224,898
2
$123,450
1
$487,870
FILES CLOSED FOR INCOMPLETENESS
2
$309,450
9
$302,352
0
$0
0
$0
Aggregated Statistics For Year 1999 (Based on 1 partial tract)
B) Conventional Home Purchase Loans
C) Refinancings
D) Home Improvement Loans
F) Non-occupant Loans on < 5 Family Dwellings (A B C & D)

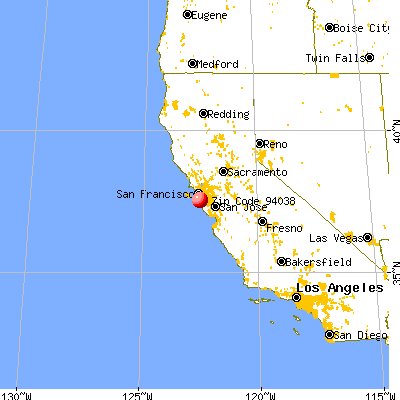


 Nearest zip codes: 94037, 94044, 94019, 94066, 94030, 94010.