Estimated zip code population in 2022: 11,491 Zip code population in 2010: 11,359 Zip code population in 2000: 10,656
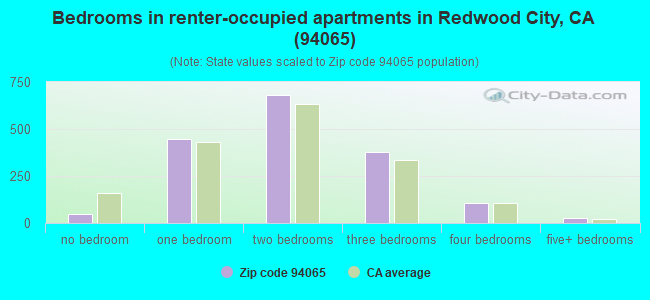
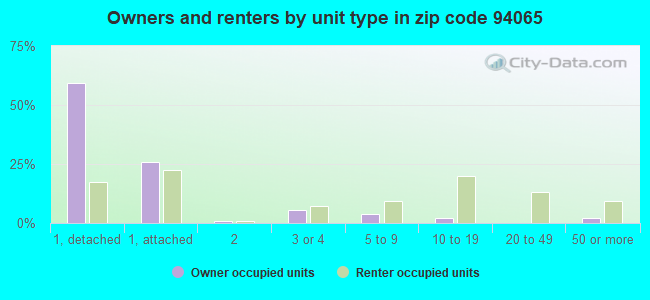
Houses and condos: 4,937 Renter-occupied apartments: 1,697
% of renters here:
36%
State:
44%
March 2022 cost of living index in zip code 94065: 133.0 (high, U.S. average is 100)
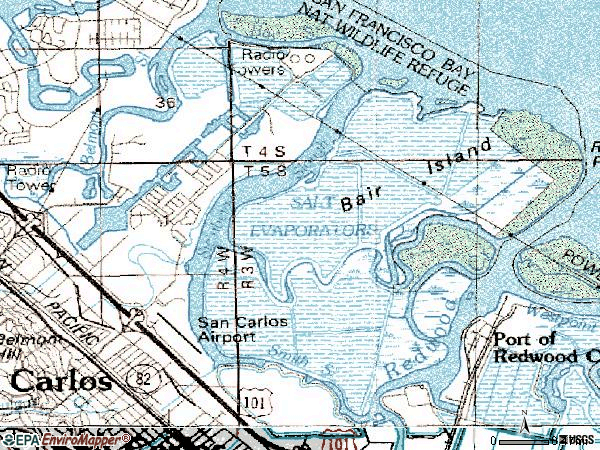
Land area: 2.4 sq. mi. Water area: 0.7 sq. mi.
Population density: 4,714 people per square mile
(average).
OSM Map
General Map
Google Map
MSN Map
OSM Map
General Map
Google Map
MSN Map
OSM Map
General Map
Google Map
MSN Map
OSM Map
General Map
Google Map
MSN Map
Please wait while loading the map...
Real estate property taxes paid for housing units in 2022:
This zip code:
0.5% ($10,292)
California:
0.7% ($4,831)
Median real estate property taxes paid for housing units with mortgages in 2022: $10,330 (0.5%) Median real estate property taxes paid for housing units with no mortgage in 2022: $7,600 (0.4%)
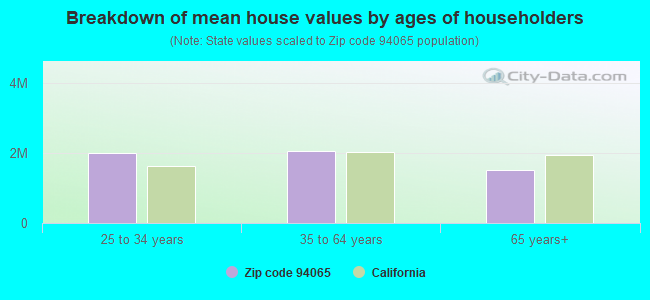
Estimated median house/condo value in 2022: $1,919,998
94065:
$1,919,998
California:
$715,900
Median resident age:
This zip code:
42.4 years
California median age:
37.9 years
Average household size:
This zip code:
2.4 people
California:
2.8 people
Averages for the 2020 tax year for zip code 94065, filed in 2021:
Average Adjusted Gross Income (AGI) in 2020: $410,771 (Individual Income Tax Returns)
Here:
$410,771
State:
$95,910
Salary/wage: $261,024 (reported on 81.5% of returns)
Here:
$261,024
State:
$77,331
(% of AGI for various income ranges: 1320.9% for AGIs below $25k, 3844.8% for AGIs $25k-50k, 6939.0% for AGIs $50k-75k, 9904.0% for AGIs $75k-100k, 23135.5% for AGIs $100k-200k, 212392.0% for AGIs over 200k)
Taxable interest for individuals: $3,666 (reported on 64.9% of returns)
This zip code:
$3,666
California:
$2,294
(% of AGI for various income ranges: 76.7% for AGIs below $25k, 149.0% for AGIs $25k-50k, 151.7% for AGIs $50k-75k, 167.6% for AGIs $75k-100k, 301.5% for AGIs $100k-200k, 2130.6% for AGIs over 200k)
Ordinary dividends: $27,367 (reported on 58.7% of returns)
Here:
$27,367
State:
$10,949
(% of AGI for various income ranges: 116.5% for AGIs below $25k, 360.3% for AGIs $25k-50k, 346.7% for AGIs $50k-75k, 431.6% for AGIs $75k-100k, 1025.0% for AGIs $100k-200k, 17138.8% for AGIs over 200k)
Net capital gain/loss in AGI: +$126,427 (reported on 57.4% of returns)
Here:
+$126,427
State:
+$49,306
(% of AGI for various income ranges: 82.1% for AGIs below $25k, 397.7% for AGIs $25k-50k, 313.7% for AGIs $50k-75k, 585.2% for AGIs $75k-100k, 1656.8% for AGIs $100k-200k, 83624.0% for AGIs over 200k)
Profit/loss from business: +$46,655 (reported on 18.1% of returns)
Here:
+$46,655
State:
+$15,671
(% of AGI for various income ranges: 295.8% for AGIs below $25k, 354.2% for AGIs $25k-50k, 421.7% for AGIs $50k-75k, 739.2% for AGIs $75k-100k, 1178.7% for AGIs $100k-200k, 7519.2% for AGIs over 200k)
Taxable individual retirement arrangement distribution: $28,624 (reported on 10.4% of returns)
94065:
$28,624
California:
$23,505
(% of AGI for various income ranges: 73.0% for AGIs below $25k, 248.1% for AGIs $25k-50k, 395.0% for AGIs $50k-75k, 766.0% for AGIs $75k-100k, 789.2% for AGIs $100k-200k, 1734.2% for AGIs over 200k)
Self-employed (Keogh) retirement plans: $39,682 (reported on 2.9% of returns)
94065:
$39,682
California:
$30,163
(% of AGI for various income ranges: 101.3% for AGIs $25k-50k, 144.7% for AGIs $100k-200k, 1107.0% for AGIs over 200k)
Total itemized deductions: $57,115 (reported on 33.2% of returns)
Here:
$57,115
State:
$39,517
(% of AGI for various income ranges: 309.3% for AGIs below $25k, 653.9% for AGIs $25k-50k, 845.7% for AGIs $50k-75k, 1478.0% for AGIs $75k-100k, 2045.0% for AGIs $100k-200k, 18163.8% for AGIs over 200k)
Charity contributions: $32,359 (reported on 27.0% of returns)
Here:
$32,359
State:
$12,598
(% of AGI for various income ranges: 11.4% for AGIs below $25k, 38.1% for AGIs $25k-50k, 70.0% for AGIs $50k-75k, 158.8% for AGIs $75k-100k, 271.9% for AGIs $100k-200k, 9927.6% for AGIs over 200k)
Taxes paid: $9,535 (reported on 33.2% of returns)
94065:
$9,535
State:
$8,807
(% of AGI for various income ranges: 72.3% for AGIs below $25k, 163.9% for AGIs $25k-50k, 215.3% for AGIs $50k-75k, 464.4% for AGIs $75k-100k, 617.7% for AGIs $100k-200k, 2484.6% for AGIs over 200k)
Earned income credit: $1,657 (reported on 2.3% of returns)
Here:
$1,657
State:
$2,074
(% of AGI for various income ranges: 31.9% for AGIs below $25k, 30.6% for AGIs $25k-50k)
Percentage of individuals using paid preparers for their 2020 taxes: 93.0%
Here:
93%
State:
92%
(% for various income ranges: 88.2% for AGIs below $25k, 92.5% for AGIs $25k-50k, 92.0% for AGIs $50k-75k, 93.3% for AGIs $75k-100k, 92.4% for AGIs $100k-200k, 95.3% for AGIs over 200k)
Averages for the 2012 tax year for zip code 94065, filed in 2013:
Average Adjusted Gross Income (AGI) in 2012: $240,475 (Individual Income Tax Returns)
Here:
$240,475
State:
$72,726
Salary/wage: $160,144 (reported on 84.5% of returns)
Here:
$160,144
State:
$59,079
(% of AGI for various income ranges: 73.3% for AGIs below $25k, 69.2% for AGIs $25k-50k, 71.6% for AGIs $50k-75k, 75.1% for AGIs $75k-100k, 82.8% for AGIs $100k-200k, 48.5% for AGIs over 200k)
Taxable interest for individuals: $2,474 (reported on 65.9% of returns)
This zip code:
$2,474
California:
$2,146
(% of AGI for various income ranges: 4.7% for AGIs below $25k, 1.7% for AGIs $25k-50k, 1.4% for AGIs $50k-75k, 1.0% for AGIs $75k-100k, 0.6% for AGIs $100k-200k, 0.6% for AGIs over 200k)
Ordinary dividends: $11,836 (reported on 50.3% of returns)
Here:
$11,836
State:
$9,308
(% of AGI for various income ranges: 7.6% for AGIs below $25k, 2.7% for AGIs $25k-50k, 2.7% for AGIs $50k-75k, 2.6% for AGIs $75k-100k, 1.7% for AGIs $100k-200k, 2.6% for AGIs over 200k)
Net capital gain/loss in AGI: +$61,278 (reported on 48.7% of returns)
Here:
+$61,278
State:
+$30,460
(% of AGI for various income ranges: 0.5% for AGIs $50k-75k, 1.6% for AGIs $75k-100k, 1.7% for AGIs $100k-200k, 16.1% for AGIs over 200k)
Profit/loss from business: +$36,148 (reported on 19.3% of returns)
Here:
+$36,148
State:
+$17,064
(% of AGI for various income ranges: 12.2% for AGIs below $25k, 11.7% for AGIs $25k-50k, 9.0% for AGIs $50k-75k, 8.0% for AGIs $75k-100k, 4.0% for AGIs $100k-200k, 1.9% for AGIs over 200k)
Taxable individual retirement arrangement distribution: $21,502 (reported on 10.8% of returns)
94065:
$21,502
California:
$19,557
(% of AGI for various income ranges: 4.3% for AGIs below $25k, 4.7% for AGIs $25k-50k, 3.4% for AGIs $50k-75k, 3.1% for AGIs $75k-100k, 2.1% for AGIs $100k-200k, 0.4% for AGIs over 200k)
Self-employment retirement plans: $25,505 (reported on 3.4% of returns)
94065:
$25,505
California:
$24,530
(% of AGI for various income ranges: 1.6% for AGIs $50k-75k, 0.4% for AGIs $100k-200k, 0.3% for AGIs over 200k)
Total itemized deductions: $48,893 (15% of AGI, reported on 68.5% of returns)
Here:
$48,893
State:
$34,004
Here:
14.9% of AGI
State:
22.7% of AGI
(% of AGI for various income ranges: 32.2% for AGIs below $25k, 18.3% for AGIs $25k-50k, 18.2% for AGIs $50k-75k, 20.0% for AGIs $75k-100k, 19.2% for AGIs $100k-200k, 12.1% for AGIs over 200k)
Charity contributions: $6,453 (reported on 56.3% of returns)
Here:
$6,453
State:
$4,659
(% of AGI for various income ranges: 1.4% for AGIs below $25k, 0.9% for AGIs $25k-50k, 1.2% for AGIs $50k-75k, 1.2% for AGIs $75k-100k, 1.3% for AGIs $100k-200k, 1.6% for AGIs over 200k)
Taxes paid: $32,913 (reported on 68.3% of returns)
94065:
$32,913
State:
$14,448
(% of AGI for various income ranges: 9.6% for AGIs below $25k, 5.5% for AGIs $25k-50k, 6.0% for AGIs $50k-75k, 8.2% for AGIs $75k-100k, 9.0% for AGIs $100k-200k, 9.7% for AGIs over 200k)
Earned income credit: $1,350 (reported on 3.4% of returns)
Here:
$1,350
State:
$2,286
(% of AGI for various income ranges: 2.0% for AGIs below $25k, 0.3% for AGIs $25k-50k)
Percentage of individuals using paid preparers for their 2012 taxes: 53.0%
Here:
53%
State:
64%
(% for various income ranges: 51.1% for AGIs below $25k, 48.4% for AGIs $25k-50k, 54.2% for AGIs $50k-75k, 53.6% for AGIs $75k-100k, 50.6% for AGIs $100k-200k, 58.0% for AGIs over 200k)
Averages for the 2004 tax year for zip code 94065, filed in 2005:
Average Adjusted Gross Income (AGI) in 2004: $131,960 (Individual Income Tax Returns)
Here:
$131,960
State:
$58,600
Salary/wage: $112,161 (reported on 84.4% of returns)
Here:
$112,161
State:
$49,455
(% of AGI for various income ranges: 68.8% for AGIs $10k-25k, 76.0% for AGIs $25k-50k, 79.7% for AGIs $50k-75k, 83.6% for AGIs $75k-100k, 68.8% for AGIs over 100k)
Taxable interest for individuals: $2,016 (reported on 70.9% of returns)
This zip code:
$2,016
California:
$2,365
(% of AGI for various income ranges: 4.7% for AGIs $10k-25k, 3.1% for AGIs $25k-50k, 1.7% for AGIs $50k-75k, 1.2% for AGIs $75k-100k, 0.8% for AGIs over 100k)
Taxable dividends: $3,673 (reported on 50.8% of returns)
Here:
$3,673
State:
$4,746
(% of AGI for various income ranges: 3.7% for AGIs $10k-25k, 2.0% for AGIs $25k-50k, 2.1% for AGIs $50k-75k, 1.3% for AGIs $75k-100k, 1.2% for AGIs over 100k)
Net capital gain/loss: +$21,151 (reported on 50.3% of returns)
Here:
+$21,151
State:
+$23,418
(% of AGI for various income ranges: -1.7% for AGIs $10k-25k, -0.5% for AGIs $25k-50k, -0.0% for AGIs $50k-75k, 0.9% for AGIs $75k-100k, 10.0% for AGIs over 100k)
Profit/loss from business: +$33,854 (reported on 19.4% of returns)
Here:
+$33,854
State:
+$16,826
(% of AGI for various income ranges: 11.8% for AGIs $10k-25k, 8.5% for AGIs $25k-50k, 7.2% for AGIs $50k-75k, 5.9% for AGIs $75k-100k, 4.4% for AGIs over 100k)
IRA payment deduction: $3,338 (reported on 4.1% of returns)
94065:
$3,338
California:
$3,192
(% of AGI for various income ranges: 0.6% for AGIs $10k-25k, 0.6% for AGIs $25k-50k, 0.3% for AGIs $50k-75k, 0.2% for AGIs $75k-100k, 0.1% for AGIs over 100k)
Self-employed pension: $18,605 (reported on 4.6% of returns)
Here:
$18,605
California:
$17,688
(% of AGI for various income ranges: 1.0% for AGIs $25k-50k, 0.7% for AGIs $50k-75k, 0.5% for AGIs $75k-100k, 0.7% for AGIs over 100k)
Total itemized deductions: $34,218 (19% of AGI, reported on 68.5% of returns)
Here:
$34,218
State:
$28,113
Here:
19.4% of AGI
State:
25.3% of AGI
(% of AGI for various income ranges: 27.4% for AGIs $10k-25k, 23.6% for AGIs $25k-50k, 24.4% for AGIs $50k-75k, 23.3% for AGIs $75k-100k, 16.0% for AGIs over 100k)
Charity contributions deductions: $2,868 (2% of AGI, reported on 60.2% of returns)
Here:
$2,868
State:
$3,923
Here:
1.6% of AGI
State:
3.3% of AGI
(% of AGI for various income ranges: 1.9% for AGIs $10k-25k, 1.6% for AGIs $25k-50k, 1.7% for AGIs $50k-75k, 1.7% for AGIs $75k-100k, 1.2% for AGIs over 100k)
Total tax: $25,748 (reported on 89.5% of returns)
94065:
$25,748
State:
$10,761
(% of AGI for various income ranges: 5.7% for AGIs $10k-25k, 9.0% for AGIs $25k-50k, 11.3% for AGIs $50k-75k, 12.7% for AGIs $75k-100k, 18.9% for AGIs over 100k)
Earned income credit: $1,133 (reported on 3.0% of returns)
Here:
$1,133
State:
$1,763
Percentage of individuals using paid preparers for their 2004 taxes: 54.8%
Here:
55%
State:
66%
(% for various income ranges: 51.0% for AGIs below $10k, 55.8% for AGIs $10k-25k, 52.7% for AGIs $25k-50k, 56.5% for AGIs $50k-75k, 52.9% for AGIs $75k-100k, 56.4% for AGIs over 100k)
Household received Food Stamps/SNAP in the past 12 months: 41 Household did not receive Food Stamps/SNAP in the past 12 months: 4,579
Women who had a birth in the past 12 months: 148 (136 now married, 12 unmarried) Women who did not have a birth in the past 12 months: 2,590 (1,445 now married, 1,127 unmarried)
Housing units in zip code 94065 with a mortgage: 2,153 (323 second mortgage, 11 home equity loan, 280 both second mortgage and home equity loan) Houses without a mortgage: 26
Median monthly owner costs for units with a mortgage: $3,876 Median monthly owner costs for units without a mortgage: $1,303
Residents with income below the poverty level in 2022:
This zip code:
4.3%
Whole state:
12.2%
Residents with income below 50% of the poverty level in 2022:
This zip code:
1.6%
Whole state:
6.2%
Median number of rooms in houses and condos:
Here:
5.8
State:
6.0
Median number of rooms in apartments:
Here:
4.2
State:
3.9
Notable locations in this zip code not listed on our city pages
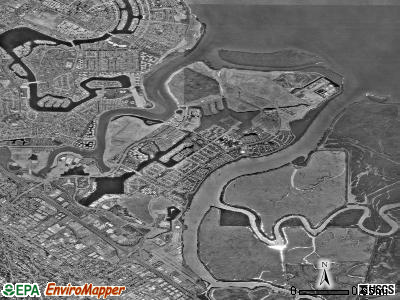
Notable locations in zip code 94065: South Bay Sewer Authority Treatment Plant (A), Press Wireless Radio Station (B), Redwood City Fire Department Station 20 (C). Display/hide their locations on the map
Parks in zip code 94065 include: Shannon Park (1), Dolphin Park (2), Marine View Park (3), Mariner Park (4), Marlin Park (5), Shorebird Park (6), Marine World (7). Display/hide their locations on the map
In group quarters: 39 (-1 institutionalized population)
Size of family households: 1,280 2-persons, 868 3-persons, 716 4-persons, 216 5-persons, 42 6-persons
Size of nonfamily households: 1,375 1-person, 234 2-persons, 10 3-persons
2,234 married couples with children.
329 single-parent households (105 men, 224 women).
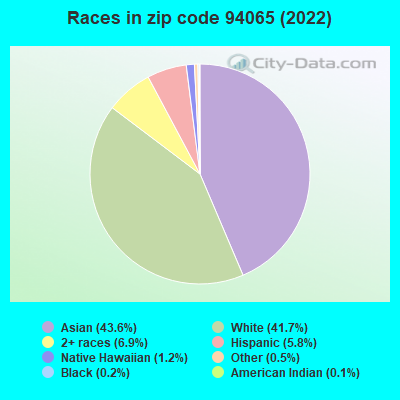
55.5% of residents of 94065 zip code speak English at home.
1.8% of residents speak Spanish at home (100% very well).
16.9% of residents speak other Indo-European language at home (77% very well, 18% well, 2% not well, 2% not at all).
25.0% of residents speak Asian or Pacific Island language at home (68% very well, 24% well, 6% not well, 2% not at all).
1.4% of residents speak other language at home (96% very well, 4% well).
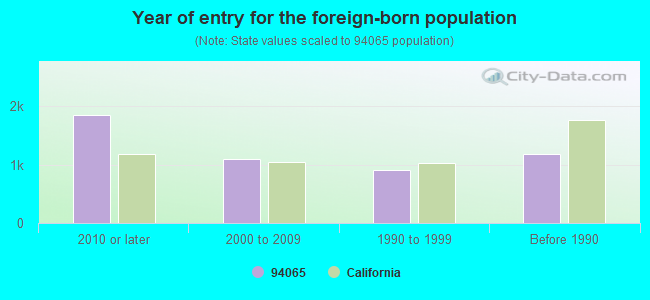
Foreign born population: 4,677 (40.7%) (54.8% of them are naturalized citizens)
Facilities with environmental interests located in this zip code:
NPD MAJ SBSA WWTP (1400 RADIO ROAD in REDWOOD CITY, CA)
STATE MASTER (California - Hazardous Waste Tracking) - HAZARDOU WASTE PROGRAM National Pollutant Discharge Elimination System MAJOR (Tracking pollutant discharge elimination systems) - permit HAZARDOUS WASTE BIENNIAL REPORTER (Resource Conservation and Recovery Act (tracking hazardous waste)) Small Quantity Generators, between 100 kg and 1000 kg of hazardous waste/month (Resource Conservation and Recovery Act (tracking hazardous waste)) Business SIC classification: SEWERAGE SYSTEMS Organizations: SOUTH BAYSIDE SYSTEM AUTHORITY (CONTACT/OWNER)
Alternative names: SOUTH BAYSIDE SYSTEM AUTH
HARRIS CORP FARINON DIVISION (350 TWIN DOLPHIN DR in REDWOOD CITY, CA)
STATE MASTER (California - Hazardous Waste Tracking) - HAZARDOU WASTE PROGRAM Small Quantity Generators, between 100 kg and 1000 kg of hazardous waste/month (Resource Conservation and Recovery Act (tracking hazardous waste)) - notification Alternative names: HARRIS CORP MCD
MESFINE AUTO BODY & PAINT (2535 MIDDLEFIELD ROAD in REDWOOD CITY, CA)
CRITERIA AND HAZARDOUS AIR POLLUTANT INVENTORY (Inventory of air pollution sources) Small Quantity Generators, between 100 kg and 1000 kg of hazardous waste/month (Resource Conservation and Recovery Act (tracking hazardous waste)) Business SIC classification: TOP, BODY, AND UPHOLSTERY REPAIR SHOPS AND PAINT SHOPS Organizations: JIM MUNDEN (CONTACT/OWNER)
Alternative names: CUSTOM TOUCH THE
Housing units lacking complete kitchen facilities: 0.1%
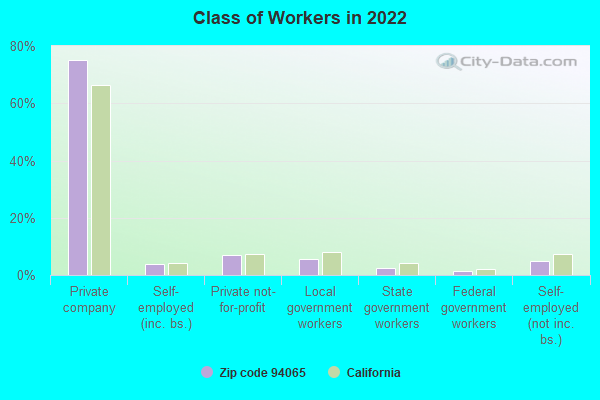
53.5%Utility gas
43.3%Electricity
2.5%Bottled, tank, or LP gas
Population in 1990: 2,285. Population change in the 1990s: +8,371 (+366.3%).
Place of birth for U.S.-born residents:
This state: 4,478
Northeast: 682
Midwest: 490
South: 515
West: 426
42% of the 94065 zip code residents lived in the same house 5 years ago. Out of people who lived in different houses, 44% lived in this county. Out of people who lived in different counties, 50% lived in California.
87% of the 94065 zip code residents lived in the same house 1 year ago. Out of people who lived in different houses, 46% moved from this county. Out of people who lived in different houses, 29% moved from different county within same state. Out of people who lived in different houses, 6% moved from different state. Out of people who lived in different houses, 21% moved from abroad.
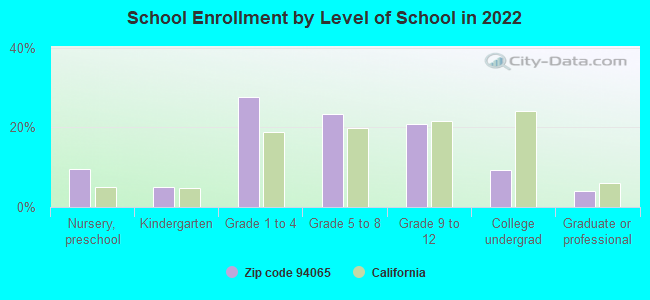
Private vs. public school enrollment:
Students in private schools in grades 1 to 8 (elementary and middle school): 164
Here:
12.9%
California:
10.5%
Students in private schools in grades 9 to 12 (high school): 182
Here:
35.0%
California:
8.5%
Students in private undergraduate colleges: 68
Here:
29.0%
California:
15.9%
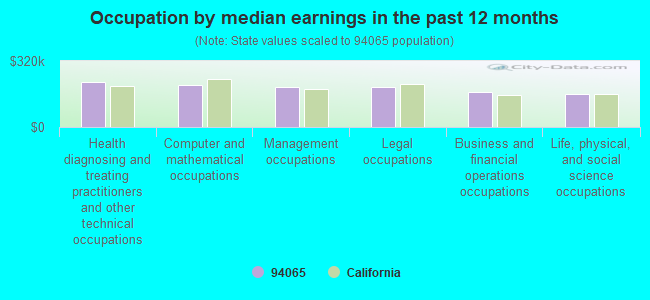
Occupation by median earnings in the past 12 months ($)
220,500Health diagnosing and treating practitioners and other technical occupations
201,874Computer and mathematical occupations
194,067Management occupations
192,175Legal occupations
170,860Business and financial operations occupations
161,956Life, physical, and social science occupations
Companies with biggest federal contracts located in this zip code (REDWOOD CITY, CA):
ORACLE CORPORATION (500 ORACLE PKWY) : $81,120,983 in 236 contractsfrom 1999 to 2006
Contracts for ADP Software, Mathematical and Computer Sciences -- Basic Research (R&D), ADPE System Configuration, Other ADP and Telecommunications Services (includes data storage on tapes, compact disks, etc.), and moreby ENERGY, Department of, Navy, Department of Defense, Federal Technology Service, and others Signed by year:2000: $34,763,455; 2001: $11,795,142; 2002: $7,906,601; 2003: $10,941,842; 2004: $3,302,661; 2005: $3,227,951; 2006: $775,943.
Biggest contracts:
$4,991,207 with ENERGY, Department of for ADP Software. Taking place in VA. Signed on 2003-05-15. Completion date: 2004-05-15.
$3,700,000 with Navy for Mathematical and Computer Sciences -- Basic Research (R&D). Taking place in VA. Signed on 2000-04-06. Completion date: 2001-01-06.
$2,544,913 with Department of Defense for ADPE System Configuration. Taking place in VA. Signed on 2000-09-30. Completion date: 2000-09-30.
$2,350,000 with Navy for Mathematical and Computer Sciences -- Basic Research (R&D). Taking place in VA. Signed on 1999-12-23. Completion date: 2000-12-22.
STERLING SOFTWARE (U S) INC (303 TWIN DOLPHIN DR) : $3,376,854 in 16 contractsfrom 1999 to 2000
Contracts for Other ADP and Telecommunications Services (includes data storage on tapes, compact disks, etc.), Technical Assistance by Army Signed by year:2000: $2,086,832; 2001: $0; 2002: $0; 2003: $0; 2004: $0; 2005: $0; 2006: $0.
Biggest contracts:
$1,217,487 with Army for Other ADP and Telecommunications Services (includes data storage on tapes, compact disks, etc.). Taking place in VA. Signed on 2000-08-09. Completion date: 2001-03-31.
$663,500 with Army for Technical Assistance. Taking place in AZ. Signed on 2000-01-13. Completion date: 2000-09-30.
$649,000 with Army for Technical Assistance. Taking place in VA. Signed on 1999-10-01. Completion date: 2000-09-30.
$332,997, same as above.Signed on 1999-10-28. Completion date: 2000-01-31.
EMERY AIR FREIGHT CORPORATION (ONE LAGOON DRIVE, SUITE400) : $453,800 in 3 contractsfrom 2000 to 2001
$181,600 with Air Force for Other Cargo and Freight Services. Signed on 2001-03-30. Completion date: 2003-02-22.
$177,400, same as above.Signed on 2001-09-17. Completion date: 2003-02-22.
$94,800, same as above.Signed on 2000-09-28. Completion date: 2001-02-22.
NEOPOST LEASING, INC (3400 BRIDGE PARKWAY, STE 2) : $348,159 in 74 contractsfrom 2003 to 2006
Contracts for Facilities Operations Support Services, Miscellaneous Special Industry Machinery, Lease or Rental of Equipment -- Office Machines, Text Processing Systems and Visible Record Equipment, Lease or Rental of Equipment -- Miscellaneous, and moreby Army, Office of the Secretary, Department of Homeland Security, U.S. Army Corps of Engineers - civil program financing only, Internal Revenue Service, and others Signed by year:2000: $0; 2001: $0; 2002: $0; 2003: $22,806; 2004: $125,354; 2005: $82,183; 2006: $117,816.
Biggest contracts:
$68,131 with Army for Facilities Operations Support Services. Signed on 2004-12-31. Completion date: 2005-06-30.
$34,456, same as above.Signed on 2005-09-26. Completion date: 2005-09-30.
$13,377 with Office of the Secretary, Department of Homeland Security for Miscellaneous Special Industry Machinery. Taking place in DC. Signed on 2004-03-08. Completion date: 2005-03-08.
$11,674 with U.S. Army Corps of Engineers - civil program financing only for Lease or Rental of Equipment -- Office Machines, Text Processing Systems and Visible Record Equipment. Signed on 2004-04-16. Completion date: 2004-09-30.
CENTURA SOFTWARE CORPORATION (975 ISLAND DRIVE) : $266,514 in 10 contractsfrom 1999 to 2006
Contracts for ADP Software, ADP Facility Operation and Maintenance Services, Laboratory Equipment and Supplies, Maintenance, Repair and Rebuilding of Equipment -- Automatic Data Processing Equipment (Including Firmware), Software, Supplies and Support Equipment, and moreby Federal Technology Service, Navy, Air Force, Army, and others Signed by year:2000: $157,250; 2001: $0; 2002: $14,600; 2003: $0; 2004: $8,585; 2005: $36,160; 2006: $19,669.
Biggest contracts:
$72,000 with Federal Technology Service for ADP Software. Signed on 2000-05-15. Completion date: 2000-12-15.
$50,000 with Navy for ADP Facility Operation and Maintenance Services. Signed on 2000-09-27. Completion date: 2000-11-15.
$36,160 with Navy for Laboratory Equipment and Supplies. Taking place in TX. Signed on 2005-04-18. Completion date: 2005-04-27.
$35,250 with Air Force for Maintenance, Repair and Rebuilding of Equipment -- Automatic Data Processing Equipment (Including Firmware), Software, Supplies and Support Equipment. Taking place in AL. Signed on 2000-11-15. Completion date: 2001-09-30.
MENLO WORLDWIDE, LLC (1 LAGOON DRIVE) : $230,010 in 15 contractsfrom 2000 to 2006
Contracts for Other Cargo and Freight Services, Courier and Messenger Services, Air Freight, Transport Vessels-Passenger And Troop by Air Force, Equal Employment Opportunity Commission, Army, Agency for International Development (disused code: now 7200), and others Signed by year:2000: $106,420; 2001: $80,000; 2002: $0; 2003: $0; 2004: $32,174; 2005: $14,300; 2006: -$2,884.
Biggest contracts:
$89,420 with Air Force for Other Cargo and Freight Services. Signed on 2000-02-17. Completion date: 2000-08-22.
$80,000 with Equal Employment Opportunity Commission for Courier and Messenger Services. Taking place in PA. Signed on 2001-12-15. Completion date: 2002-11-15.
$28,174 with Army for Air Freight. Taking place in WA. Signed on 2004-07-07. Completion date: 2004-07-13.
$17,000 with Agency for International Development (disused code: now 7200) for Transport Vessels-Passenger And Troop. Taking place in DC. Signed on 2000-05-15. Completion date: 2000-05-15.
CLEARSWIFT CORPORATION (100 MARINE PARKWAY; small business) : $205,398 in 21 contractsfrom 2003 to 2006
Contracts for ADP Software, Technical Representation Services -- Alarm, Signal, and Security Detection Systems, ADP Support Equipment, Other ADP and Telecommunications Services (includes data storage on tapes, compact disks, etc.), and moreby Navy, Air Force, Assistant Secretary for Administration, Army, and others Signed by year:2000: $0; 2001: $0; 2002: $0; 2003: $9,581; 2004: $51,087; 2005: $26,035; 2006: $118,695.
Biggest contracts:
$68,256 with Navy for ADP Software. Taking place in WA. Signed on 2006-06-30. Completion date: 2006-06-30.
$34,627 with Air Force for ADP Software. Taking place in WA. Signed on 2004-09-30. Completion date: 2004-10-29.
$30,500 with Navy for Technical Representation Services -- Alarm, Signal, and Security Detection Systems. Taking place in WA. Signed on 2006-03-30. Completion date: 2006-06-30.
$10,021 with Assistant Secretary for Administration for ADP Software. Taking place in DC. Signed on 2005-09-23. Completion date: 2006-08-25.
LURATECH INCORPORATED (PMB #708, 270 REDWOOD SHOR; small business) : $69,180 in 2 contractsfrom 2001 to 2006
$40,824 with Air Force for Programming Services. Signed on 2006-05-16. Completion date: 2007-05-17.
$28,356 with Department of Defense for ADP Support Equipment. Taking place in KY. Signed on 2001-03-05. Completion date: 2001-02-28.
IPASS INC (3800 BRIDGE PKWY) : $53,580 in 2 contractsfrom 2004 to 2005
$29,280 with Army for ADP Software. Taking place in AZ. Signed on 2004-06-28. Completion date: 2004-08-31.
$24,300 with Navy for Miscellaneous Items. Signed on 2005-07-28. Completion date: 2006-07-31.
GUPTA TECHNOLOGIES LLC (975 ISLAND DR; small business) : $49,134 in 6 contractsfrom 2003 to 2005
Contracts for Computer Aided Design/Computer Aided Manufacturing (CAD/CAM) Services, ADP Software, ADP Support Equipment, ADP Components by Public Buildings Service, Navy, Army, Department of State, and others Signed by year:2000: $0; 2001: $0; 2002: $0; 2003: $10,996; 2004: $20,150; 2005: $17,988; 2006: $0.
Biggest contracts:
$17,988 with Public Buildings Service for Computer Aided Design/Computer Aided Manufacturing (CAD/CAM) Services. Taking place in DC. Signed on 2005-04-19. Completion date: 2005-04-19.
$11,153 with Navy for ADP Software. Signed on 2004-04-30. Completion date: 2004-06-18.
$10,996 with Army for ADP Support Equipment. Taking place in AZ. Signed on 2005-06-22. Completion date: 2006-04-30.
$10,996 with Army for ADP Components. Signed on 2003-07-03. Completion date: 2004-09-29.
Top industries in this zip code by the number of employees in 2005:
Professional, Scientific, and Technical Services: Research and Development in the Physical, Engineering, and Life Sciences (over 1000: 1, 50-99: 2, 20-49: 1, 5-9: 2, 1-4: 4)
2005 - 2018 National Fire Incident Reporting System (NFIRS) incidents
According to the data from the years 2005 - 2018 the average number of fire incidents per year is 13. The highest number of fire incidents - 24 took place in 2006, and the least - 1 in 2012. The data has a decreasing trend.
When looking into fire subcategories, the most incidents belonged to: Structure Fires (51.1%), and Outside Fires (31.3%).
Fire incident types reported to NFIRS in Zip Code 94065

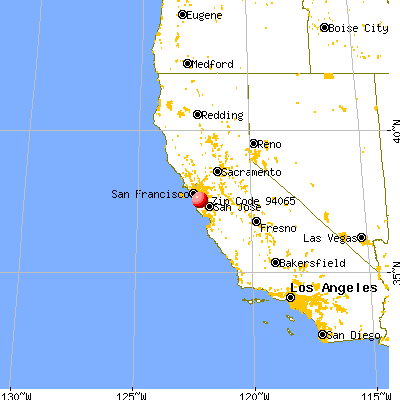


 Nearest zip codes: 94404, 94070, 94002, 94403, 94063, 94061.


 According to the data from the years 2005 - 2018 the average number of fire incidents per year is 13. The highest number of fire incidents - 24 took place in 2006, and the least - 1 in 2012. The data has a decreasing trend.
 When looking into fire subcategories, the most incidents belonged to: Structure Fires (51.1%), and Outside Fires (31.3%).