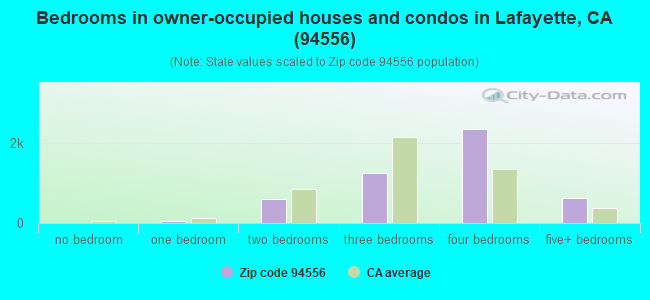
Estimated zip code population in 2022: 15,826 Zip code population in 2010: 15,229 Zip code population in 2000: 16,501
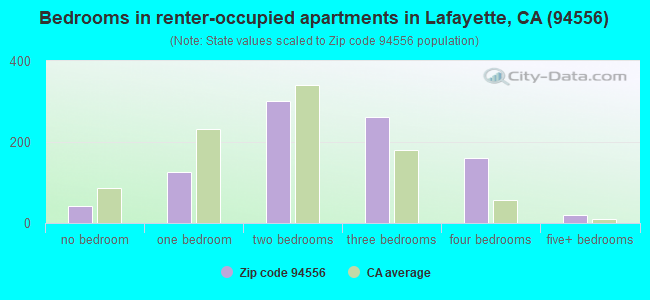
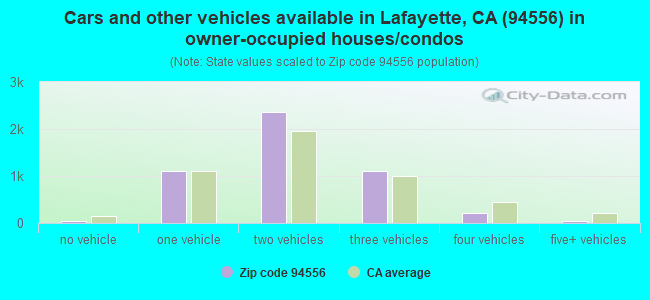
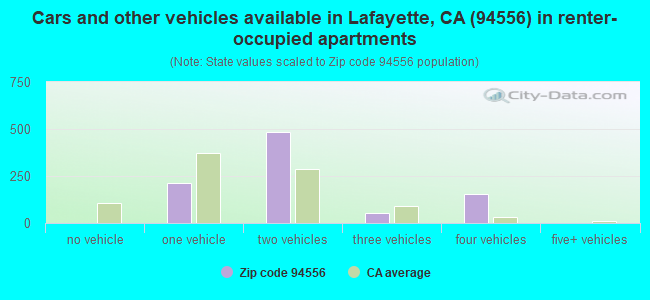
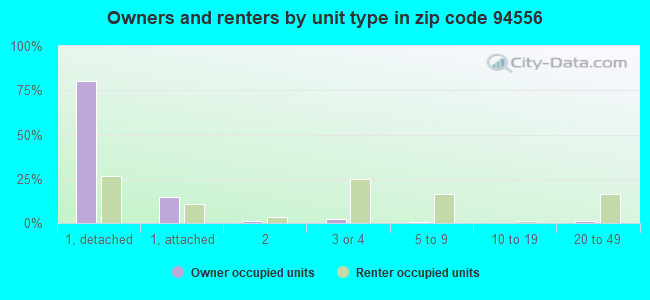
Houses and condos: 5,863 Renter-occupied apartments: 909
% of renters here:
16%
State:
44%
March 2022 cost of living index in zip code 94556: 120.4 (high, U.S. average is 100)
Land area: 12.2 sq. mi. Water area: 0.0 sq. mi.
Population density: 1,294 people per square mile
(low).
OSM Map
General Map
Google Map
MSN Map
OSM Map
General Map
Google Map
MSN Map
OSM Map
General Map
Google Map
MSN Map
OSM Map
General Map
Google Map
MSN Map
Please wait while loading the map...
Real estate property taxes paid for housing units in 2022:
This zip code:
0.6% ($10,292)
California:
0.7% ($4,831)
Median real estate property taxes paid for housing units with mortgages in 2022: $10,330 (0.6%) Median real estate property taxes paid for housing units with no mortgage in 2022: $7,843 (0.5%)
Business Search- 14 Million verified businesses
Males: 7,667
(48.4%)
Females: 8,159
(51.6%)
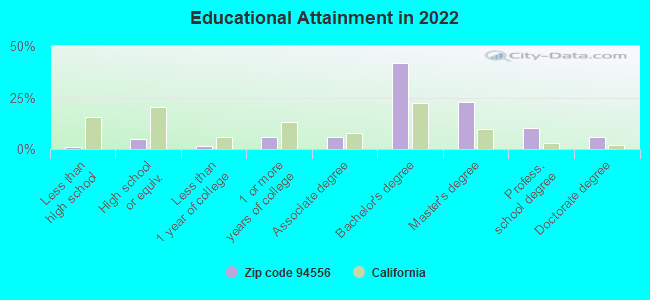
For population 25 years and over in 94556:
High school or higher: 101.2%
Bachelor's degree or higher: 82.5%
Graduate or professional degree: 39.8%
Unemployed: 4.3%
Mean travel time to work (commute): 31.6 minutes
For population 15 years and over in 94556:
Never married: 27.8%
Now married: 60.5%
Separated: 0.3%
Widowed: 5.1%
Divorced: 6.3%
Zip code 94556 compared to state average:
Median household income above state average.
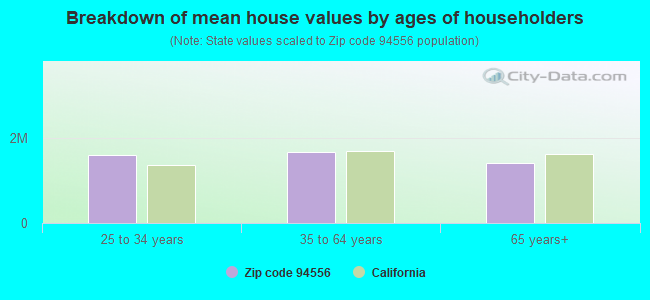
Median house value above state average.
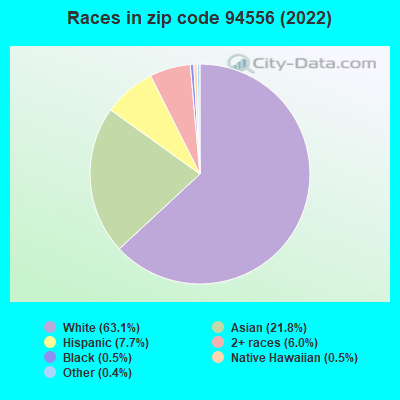
Black race population percentage significantly below state average.
Hispanic race population percentage significantly below state average.
Median age above state average.
Renting percentage significantly below state average.
Number of rooms per house above state average.
Percentage of population with a bachelor's degree or higher above state average.
Estimated median house/condo value in 2022: $1,602,604
94556:
$1,602,604
California:
$715,900
According to our research of California and other state lists, there were 3 registered sex offenders living in 94556 zip code as of May 28, 2024. The ratio of all residents to sex offenders in zip code 94556 is 5,423 to 1. The ratio of registered sex offenders to all residents in this zip code is much lower than the state average.
Median resident age:
This zip code:
44.2 years
California median age:
37.9 years
Average household size:
This zip code:
2.6 people
California:
2.8 people
Averages for the 2020 tax year for zip code 94556, filed in 2021:
Average Adjusted Gross Income (AGI) in 2020: $239,809 (Individual Income Tax Returns)
Here:
$239,809
State:
$95,910
Salary/wage: $209,807 (reported on 71.9% of returns)
Here:
$209,807
State:
$77,331
(% of AGI for various income ranges: 1271.5% for AGIs below $25k, 3445.8% for AGIs $25k-50k, 6527.7% for AGIs $50k-75k, 9544.2% for AGIs $75k-100k, 18590.8% for AGIs $100k-200k, 138668.2% for AGIs over 200k)
Taxable interest for individuals: $3,309 (reported on 66.3% of returns)
This zip code:
$3,309
California:
$2,294
(% of AGI for various income ranges: 66.3% for AGIs below $25k, 120.0% for AGIs $25k-50k, 199.4% for AGIs $50k-75k, 235.4% for AGIs $75k-100k, 487.0% for AGIs $100k-200k, 1640.3% for AGIs over 200k)
Ordinary dividends: $14,013 (reported on 61.3% of returns)
Here:
$14,013
State:
$10,949
(% of AGI for various income ranges: 220.2% for AGIs below $25k, 474.2% for AGIs $25k-50k, 608.4% for AGIs $50k-75k, 1218.1% for AGIs $75k-100k, 1969.2% for AGIs $100k-200k, 6368.9% for AGIs over 200k)
Net capital gain/loss in AGI: +$40,954 (reported on 57.2% of returns)
Here:
+$40,954
State:
+$49,306
(% of AGI for various income ranges: 100.2% for AGIs below $25k, 405.0% for AGIs $25k-50k, 514.5% for AGIs $50k-75k, 744.2% for AGIs $75k-100k, 1726.0% for AGIs $100k-200k, 23320.6% for AGIs over 200k)
Profit/loss from business: +$45,449 (reported on 21.2% of returns)
Here:
+$45,449
State:
+$15,671
(% of AGI for various income ranges: 190.2% for AGIs below $25k, 331.4% for AGIs $25k-50k, 736.8% for AGIs $50k-75k, 831.9% for AGIs $75k-100k, 1248.7% for AGIs $100k-200k, 8388.2% for AGIs over 200k)
Taxable individual retirement arrangement distribution: $41,765 (reported on 16.5% of returns)
94556:
$41,765
California:
$23,505
(% of AGI for various income ranges: 122.7% for AGIs below $25k, 451.4% for AGIs $25k-50k, 697.1% for AGIs $50k-75k, 1358.5% for AGIs $75k-100k, 2531.1% for AGIs $100k-200k, 3959.1% for AGIs over 200k)
Self-employed (Keogh) retirement plans: $38,339 (reported on 5.2% of returns)
94556:
$38,339
California:
$30,163
(% of AGI for various income ranges: 112.6% for AGIs $50k-75k, 192.1% for AGIs $100k-200k, 1971.2% for AGIs over 200k)
Total itemized deductions: $42,271 (reported on 38.2% of returns)
Here:
$42,271
State:
$39,517
(% of AGI for various income ranges: 437.8% for AGIs below $25k, 886.7% for AGIs $25k-50k, 1426.5% for AGIs $50k-75k, 2315.0% for AGIs $75k-100k, 3259.2% for AGIs $100k-200k, 12236.8% for AGIs over 200k)
Charity contributions: $9,798 (reported on 33.6% of returns)
Here:
$9,798
State:
$12,598
(% of AGI for various income ranges: 14.7% for AGIs below $25k, 61.4% for AGIs $25k-50k, 149.4% for AGIs $50k-75k, 272.3% for AGIs $75k-100k, 397.8% for AGIs $100k-200k, 3018.6% for AGIs over 200k)
Taxes paid: $9,529 (reported on 38.2% of returns)
94556:
$9,529
State:
$8,807
(% of AGI for various income ranges: 94.9% for AGIs below $25k, 163.6% for AGIs $25k-50k, 333.5% for AGIs $50k-75k, 528.8% for AGIs $75k-100k, 865.7% for AGIs $100k-200k, 2648.5% for AGIs over 200k)
Earned income credit: $1,248 (reported on 3.2% of returns)
Here:
$1,248
State:
$2,074
(% of AGI for various income ranges: 32.9% for AGIs below $25k, 25.8% for AGIs $25k-50k)
Percentage of individuals using paid preparers for their 2020 taxes: 91.6%
Here:
92%
State:
92%
(% for various income ranges: 88.9% for AGIs below $25k, 92.2% for AGIs $25k-50k, 90.0% for AGIs $50k-75k, 90.9% for AGIs $75k-100k, 91.3% for AGIs $100k-200k, 93.4% for AGIs over 200k)
Averages for the 2012 tax year for zip code 94556, filed in 2013:
Average Adjusted Gross Income (AGI) in 2012: $176,548 (Individual Income Tax Returns)
Here:
$176,548
State:
$72,726
Salary/wage: $146,980 (reported on 72.3% of returns)
Here:
$146,980
State:
$59,079
(% of AGI for various income ranges: 63.3% for AGIs below $25k, 53.9% for AGIs $25k-50k, 51.6% for AGIs $50k-75k, 48.4% for AGIs $75k-100k, 58.8% for AGIs $100k-200k, 61.9% for AGIs over 200k)
Taxable interest for individuals: $3,372 (reported on 66.3% of returns)
This zip code:
$3,372
California:
$2,146
(% of AGI for various income ranges: 3.6% for AGIs below $25k, 2.0% for AGIs $25k-50k, 1.9% for AGIs $50k-75k, 1.6% for AGIs $75k-100k, 1.5% for AGIs $100k-200k, 1.1% for AGIs over 200k)
Ordinary dividends: $11,850 (reported on 58.0% of returns)
Here:
$11,850
State:
$9,308
(% of AGI for various income ranges: 8.1% for AGIs below $25k, 6.2% for AGIs $25k-50k, 5.5% for AGIs $50k-75k, 5.5% for AGIs $75k-100k, 4.7% for AGIs $100k-200k, 3.3% for AGIs over 200k)
Net capital gain/loss in AGI: +$27,020 (reported on 52.2% of returns)
Here:
+$27,020
State:
+$30,460
(% of AGI for various income ranges: 0.9% for AGIs below $25k, 1.6% for AGIs $25k-50k, 1.1% for AGIs $50k-75k, 2.0% for AGIs $75k-100k, 2.3% for AGIs $100k-200k, 10.6% for AGIs over 200k)
Profit/loss from business: +$46,019 (reported on 21.3% of returns)
Here:
+$46,019
State:
+$17,064
(% of AGI for various income ranges: 10.9% for AGIs below $25k, 10.7% for AGIs $25k-50k, 6.0% for AGIs $50k-75k, 8.0% for AGIs $75k-100k, 6.1% for AGIs $100k-200k, 5.0% for AGIs over 200k)
Taxable individual retirement arrangement distribution: $33,727 (reported on 22.3% of returns)
94556:
$33,727
California:
$19,557
(% of AGI for various income ranges: 5.1% for AGIs below $25k, 7.3% for AGIs $25k-50k, 8.6% for AGIs $50k-75k, 9.3% for AGIs $75k-100k, 7.5% for AGIs $100k-200k, 2.7% for AGIs over 200k)
Self-employment retirement plans: $31,585 (reported on 5.5% of returns)
94556:
$31,585
California:
$24,530
(% of AGI for various income ranges: 1.5% for AGIs $50k-75k, 0.8% for AGIs $100k-200k, 1.1% for AGIs over 200k)
Total itemized deductions: $51,078 (20% of AGI, reported on 65.3% of returns)
Here:
$51,078
State:
$34,004
Here:
20.4% of AGI
State:
22.7% of AGI
(% of AGI for various income ranges: 32.9% for AGIs below $25k, 22.2% for AGIs $25k-50k, 23.4% for AGIs $50k-75k, 21.7% for AGIs $75k-100k, 21.4% for AGIs $100k-200k, 17.4% for AGIs over 200k)
Charity contributions: $5,974 (reported on 59.2% of returns)
Here:
$5,974
State:
$4,659
(% of AGI for various income ranges: 1.5% for AGIs below $25k, 2.0% for AGIs $25k-50k, 2.1% for AGIs $50k-75k, 2.4% for AGIs $75k-100k, 2.1% for AGIs $100k-200k, 1.9% for AGIs over 200k)
Taxes paid: $26,129 (reported on 65.1% of returns)
94556:
$26,129
State:
$14,448
(% of AGI for various income ranges: 6.3% for AGIs below $25k, 5.6% for AGIs $25k-50k, 6.7% for AGIs $50k-75k, 7.1% for AGIs $75k-100k, 9.0% for AGIs $100k-200k, 10.3% for AGIs over 200k)
Earned income credit: $1,438 (reported on 3.7% of returns)
Here:
$1,438
State:
$2,286
(% of AGI for various income ranges: 2.0% for AGIs below $25k, 0.4% for AGIs $25k-50k)
Percentage of individuals using paid preparers for their 2012 taxes: 56.2%
Here:
56%
State:
64%
(% for various income ranges: 43.9% for AGIs below $25k, 52.0% for AGIs $25k-50k, 58.6% for AGIs $50k-75k, 57.1% for AGIs $75k-100k, 57.2% for AGIs $100k-200k, 65.7% for AGIs over 200k)
Averages for the 2004 tax year for zip code 94556, filed in 2005:
Average Adjusted Gross Income (AGI) in 2004: $128,978 (Individual Income Tax Returns)
Here:
$128,978
State:
$58,600
Salary/wage: $112,007 (reported on 70.9% of returns)
Here:
$112,007
State:
$49,455
(% of AGI for various income ranges: 50.5% for AGIs $10k-25k, 55.4% for AGIs $25k-50k, 49.0% for AGIs $50k-75k, 54.6% for AGIs $75k-100k, 62.5% for AGIs over 100k)
Taxable interest for individuals: $3,866 (reported on 74.0% of returns)
This zip code:
$3,866
California:
$2,365
(% of AGI for various income ranges: 8.2% for AGIs $10k-25k, 4.3% for AGIs $25k-50k, 4.0% for AGIs $50k-75k, 3.2% for AGIs $75k-100k, 1.8% for AGIs over 100k)
Taxable dividends: $7,666 (reported on 64.4% of returns)
Here:
$7,666
State:
$4,746
(% of AGI for various income ranges: 7.5% for AGIs $10k-25k, 6.1% for AGIs $25k-50k, 5.9% for AGIs $50k-75k, 4.7% for AGIs $75k-100k, 3.4% for AGIs over 100k)
Net capital gain/loss: +$21,674 (reported on 56.6% of returns)
Here:
+$21,674
State:
+$23,418
(% of AGI for various income ranges: 2.0% for AGIs $10k-25k, 1.0% for AGIs $25k-50k, 1.0% for AGIs $50k-75k, 1.8% for AGIs $75k-100k, 11.1% for AGIs over 100k)
Profit/loss from business: +$40,603 (reported on 20.0% of returns)
Here:
+$40,603
State:
+$16,826
(% of AGI for various income ranges: 8.5% for AGIs $10k-25k, 7.8% for AGIs $25k-50k, 8.1% for AGIs $50k-75k, 7.5% for AGIs $75k-100k, 6.1% for AGIs over 100k)
IRA payment deduction: $3,550 (reported on 4.1% of returns)
94556:
$3,550
California:
$3,192
(% of AGI for various income ranges: 0.6% for AGIs $10k-25k, 0.4% for AGIs $25k-50k, 0.3% for AGIs $50k-75k, 0.3% for AGIs $75k-100k, 0.1% for AGIs over 100k)
Self-employed pension: $22,699 (reported on 6.5% of returns)
Here:
$22,699
California:
$17,688
(% of AGI for various income ranges: 0.4% for AGIs $25k-50k, 0.6% for AGIs $50k-75k, 0.6% for AGIs $75k-100k, 1.3% for AGIs over 100k)
Total itemized deductions: $40,125 (21% of AGI, reported on 61.7% of returns)
Here:
$40,125
State:
$28,113
Here:
20.7% of AGI
State:
25.3% of AGI
(% of AGI for various income ranges: 30.6% for AGIs $10k-25k, 24.1% for AGIs $25k-50k, 25.1% for AGIs $50k-75k, 23.2% for AGIs $75k-100k, 17.9% for AGIs over 100k)
Charity contributions deductions: $5,236 (3% of AGI, reported on 57.2% of returns)
Here:
$5,236
State:
$3,923
Here:
2.6% of AGI
State:
3.3% of AGI
(% of AGI for various income ranges: 2.0% for AGIs $10k-25k, 2.0% for AGIs $25k-50k, 2.5% for AGIs $50k-75k, 2.4% for AGIs $75k-100k, 2.3% for AGIs over 100k)
Total tax: $28,837 (reported on 84.2% of returns)
94556:
$28,837
State:
$10,761
(% of AGI for various income ranges: 4.9% for AGIs $10k-25k, 8.4% for AGIs $25k-50k, 10.1% for AGIs $50k-75k, 11.1% for AGIs $75k-100k, 20.5% for AGIs over 100k)
Earned income credit: $1,098 (reported on 2.3% of returns)
Here:
$1,098
State:
$1,763
Percentage of individuals using paid preparers for their 2004 taxes: 57.4%
Here:
57%
State:
66%
(% for various income ranges: 47.2% for AGIs below $10k, 54.0% for AGIs $10k-25k, 54.1% for AGIs $25k-50k, 63.3% for AGIs $50k-75k, 57.7% for AGIs $75k-100k, 62.3% for AGIs over 100k)
Likely homosexual households (counted as self-reported same-sex unmarried-partner households)
Lesbian couples: 0.1% of all households
Gay men: 0.4% of all households
Household received Food Stamps/SNAP in the past 12 months: 26 Household did not receive Food Stamps/SNAP in the past 12 months: 5,587
Women who had a birth in the past 12 months: 198 (174 now married, 23 unmarried) Women who did not have a birth in the past 12 months: 3,352 (1,426 now married, 1,921 unmarried)
Housing units in zip code 94556 with a mortgage: 3,231 (357 second mortgage, 9 home equity loan, 342 both second mortgage and home equity loan) Houses without a mortgage: 64
Median monthly owner costs for units with a mortgage: $3,876 Median monthly owner costs for units without a mortgage: $1,270
Residents with income below the poverty level in 2022:
This zip code:
7.6%
Whole state:
12.2%
Residents with income below 50% of the poverty level in 2022:
This zip code:
3.6%
Whole state:
6.2%
Median number of rooms in houses and condos:
Here:
7.4
State:
6.0
Median number of rooms in apartments:
Here:
4.8
State:
3.9
Notable locations in this zip code not listed on our city pages
Notable locations in zip code 94556: Fay Hill Pumping Plant (A), Moraga Country Club (B), Moraga Branch Contra Costa County Library (C), Moraga - Orinda Fire District Station 42 (D), Moraga - Orinda Fire District Station 41 (E). Display/hide their locations on the map
Parks in zip code 94556 include: Chapel Green (1), Louis Guisto Baseball Field (2), Pat Vincent Memorial Field (3), Hacienda De Las Flores Park (4), Moraga Commons Park (5), Rancho Laguna Park (6). Display/hide their locations on the map
In group quarters: 648 (-1 institutionalized population)
Size of family households: 1,901 2-persons, 926 3-persons, 1,013 4-persons, 290 5-persons, 102 6-persons, 14 7-or-more-persons
Size of nonfamily households: 1,061 1-person, 329 2-persons, 122 4-persons
2,938 married couples with children.
334 single-parent households (93 men, 241 women).
77.0% of residents of 94556 zip code speak English at home.
2.5% of residents speak Spanish at home (95% very well, 4% well, 1% not well).
6.3% of residents speak other Indo-European language at home (84% very well, 16% well).
13.8% of residents speak Asian or Pacific Island language at home (51% very well, 29% well, 12% not well, 8% not at all).
0.6% of residents speak other language at home (61% very well, 18% well, 21% not well).
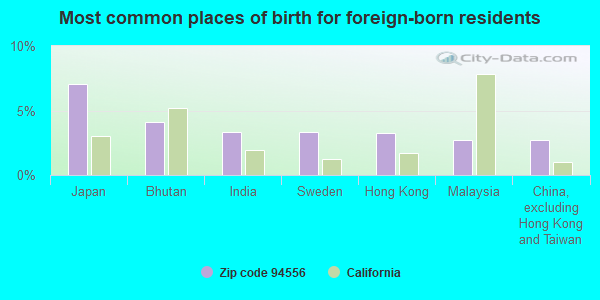
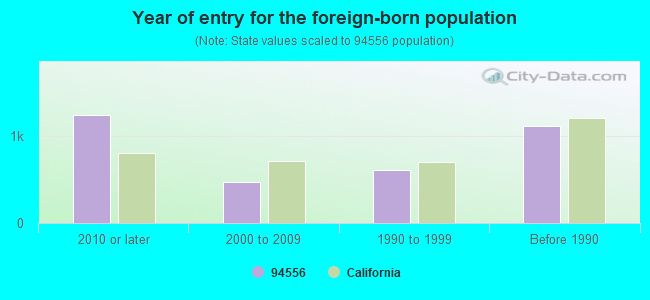
Foreign born population: 3,136 (19.8%) (63.5% of them are naturalized citizens)
This zip code:
19.8%
Whole state:
26.7%
7%Japan
4%Bhutan
3%India
3%Sweden
3%Hong Kong
3%Malaysia
3%China, excluding Hong Kong and Taiwan
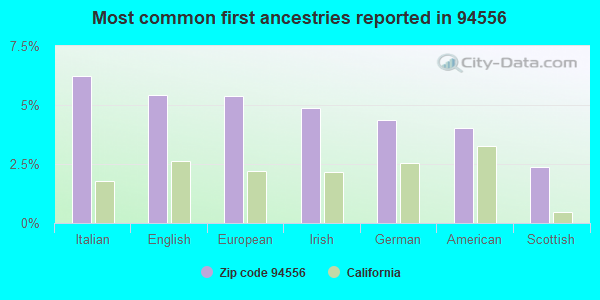
6%Italian
5%English
5%European
5%Irish
4%German
4%American
2%Scottish
Year of entry for the foreign-born population
1,2442010 or later
4772000 to 2009
6121990 to 1999
1,116Before 1990
Major facilities with environmental interests located in this zip code:
CHEVRON STATION 98791 (1455 MORAGA WAY in MORAGA, CA)
STATE MASTER (California - Hazardous Waste Tracking) - HAZARDOU WASTE PROGRAM HAZARDOUS WASTE BIENNIAL REPORTER (Resource Conservation and Recovery Act (tracking hazardous waste)) Small Quantity Generators, between 100 kg and 1000 kg of hazardous waste/month (Resource Conservation and Recovery Act (tracking hazardous waste)) - notification STATE MASTER (California - Used Oil Recycling System ) - USED OIL RECYCLING Organizations: CHEVRON PRODUCTS CO (CONTACT/OWNER)
Alternative names: CHEVRON STATION NO 98791, CHEVRON USA INC SERV STA #98791, MORAGA CHEVRON SERVICE CENTER
CAMPOLINDO HIGH SCHOOL (300 MORAGA RD in MORAGA, CA)
STATE MASTER (California - Hazardous Waste Tracking) - HAZARDOU WASTE PROGRAM (National Center for Education Statistics) - STATE ID-0731125 Small Quantity Generators, between 100 kg and 1000 kg of hazardous waste/month (Resource Conservation and Recovery Act (tracking hazardous waste)) - notification Organizations: ACALANTES UNION SCHOOL DIST (CONTACT/OWNER)
, ACALANES UNION HIGH (SCHOOL DISTRICT)
Alternative names: ACALANES UNION HIGH SCH DIST
EQUILON ENTERPRISES (1405 MORAGA WY in MORAGA, CA) . Federal Facility
STATE MASTER (California - Hazardous Waste Tracking) - HAZARDOU WASTE PROGRAM Small Quantity Generators, between 100 kg and 1000 kg of hazardous waste/month (Resource Conservation and Recovery Act (tracking hazardous waste)) - notification Organizations: EQUILON ENTERPRISES, LLC (CONTACT/OWNER)
Alternative names: SHELL OIL CO
EQUILON ENTERPRISES (383 RHEEM BLVD/JONES HILL RD in MORAGA, CA) . Federal Facility
STATE MASTER (California - Hazardous Waste Tracking) - HAZARDOU WASTE PROGRAM Small Quantity Generators, between 100 kg and 1000 kg of hazardous waste/month (Resource Conservation and Recovery Act (tracking hazardous waste)) - notification Organizations: EQUILON ENTERPRISES, LLC (CONTACT/OWNER)
Alternative names: SHELL OIL CO
JOAQUIN MORAGA INTERMEDIATE (1010 CAMINO PABLO in MORAGA, CA)
(National Center for Education Statistics) - STATE ID-6003925 Organizations: MORAGA ELEMENTARY (SCHOOL DISTRICT)
LOS PERALES ELEMENTARY (22 WAKEFIELD DR. in MORAGA, CA)
(National Center for Education Statistics) - STATE ID-6003933 Organizations: MORAGA ELEMENTARY (SCHOOL DISTRICT)
CAMINO PABLO ELEMENTARY (1111 CAMINO PABLO in MORAGA, CA)
(National Center for Education Statistics) - STATE ID-6003909 Organizations: MORAGA ELEMENTARY (SCHOOL DISTRICT)
ACALANES MAINTENANCE YARD (310 MORAGA RD in MORAGA, CA)
HAZARDOUS WASTE BIENNIAL REPORTER (Resource Conservation and Recovery Act (tracking hazardous waste)) Large Quantity Generators, more that 1000 kg of hazardous waste/month (Resource Conservation and Recovery Act (tracking hazardous waste))
LONGS (580 MORAGA in MORAGA, CA)
(Resource Conservation and Recovery Act (tracking hazardous waste)) Organizations: LONGS DRUG STORES INC (CONTACT/OWNER)
EXXON SERVICE STATION NO 7-994 (530 MORAGA RD/RHEEM in MORAGA, CA)
Small Quantity Generators, between 100 kg and 1000 kg of hazardous waste/month (Resource Conservation and Recovery Act (tracking hazardous waste)) - notification Organizations: EXXON CO USA (CONTACT/OWNER)
MORAGA CLEANERS (1425 MORAGA WAY in MORAGA, CA)
CRITERIA AND HAZARDOUS AIR POLLUTANT INVENTORY (Inventory of air pollution sources) Small Quantity Generators, between 100 kg and 1000 kg of hazardous waste/month (Resource Conservation and Recovery Act (tracking hazardous waste)) Business SIC classification: DRYCLEANING PLANTS, EXCEPT RUG CLEANING Alternative names: MORAGA CLEANERS AND LAUNDRY
GRAYOX CORP (P O BOX 296 in MORAGA, CA)
COMPLIANCE ACTIVITY (Tracking inspections of insecticide, fungicide, and rodenticide, and toxic substances)
Housing units lacking complete kitchen facilities: 0.1%
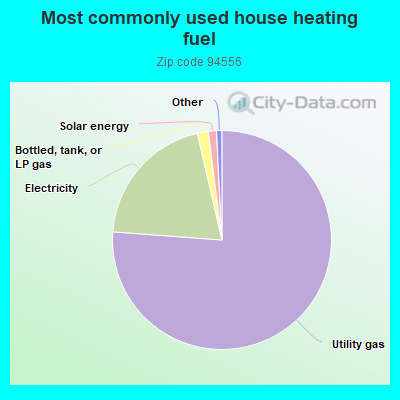
76.2%Utility gas
20.2%Electricity
1.6%Bottled, tank, or LP gas
1.2%Solar energy
Population in 1990: 15,988. Population change in the 1990s: +513 (+3.2%).
Place of birth for U.S.-born residents:
This state: 7,816
Northeast: 1,459
Midwest: 1,405
South: 744
West: 942
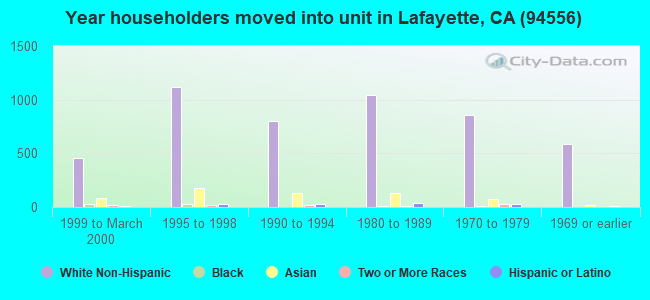
60% of the 94556 zip code residents lived in the same house 5 years ago. Out of people who lived in different houses, 38% lived in this county. Out of people who lived in different counties, 50% lived in California.
90% of the 94556 zip code residents lived in the same house 1 year ago. Out of people who lived in different houses, 25% moved from this county. Out of people who lived in different houses, 42% moved from different county within same state. Out of people who lived in different houses, 17% moved from different state. Out of people who lived in different houses, 21% moved from abroad.
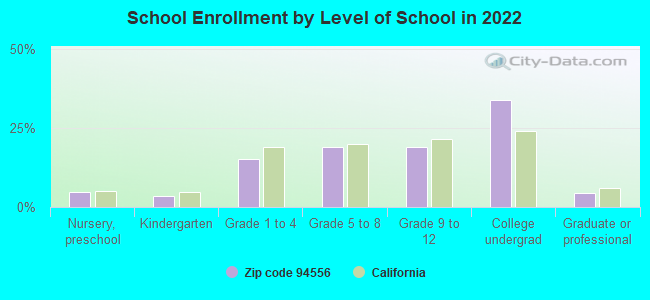
Private vs. public school enrollment:
Students in private schools in grades 1 to 8 (elementary and middle school): 184
Here:
11.1%
California:
10.5%
Students in private schools in grades 9 to 12 (high school): 69
Here:
7.6%
California:
8.5%
Students in private undergraduate colleges: 1,126
Here:
66.0%
California:
15.9%
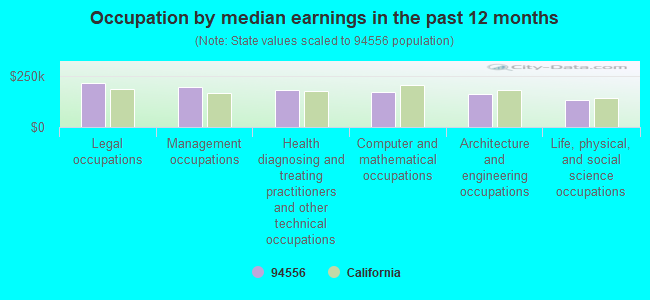
Occupation by median earnings in the past 12 months ($)
214,625Legal occupations
194,368Management occupations
181,917Health diagnosing and treating practitioners and other technical occupations
171,720Computer and mathematical occupations
159,084Architecture and engineering occupations
132,362Life, physical, and social science occupations
Companies with federal contracts located in this zip code (MORAGA, CA):
SPINIX CORPORATION (351 RHEEM BLVD; small business) : $1,282,399 in 6 contractsfrom 1999 to 2001
Contracts for Other Defense -- Applied Research and Exploratory Development (R&D), Other Defense -- Basic Research (R&D), Space Science and Applications -- Basic Research (R&D), Defense Missile and Space Systems -- Advanced Development (R&D) by Army, Navy, NASA Signed by year:2000: $739,461; 2001: $472,938; 2002: $0; 2003: $0; 2004: $0; 2005: $0; 2006: $0.
Biggest contracts:
$374,473 with Army for Other Defense -- Applied Research and Exploratory Development (R&D). Taking place in MA. Signed on 2001-02-22. Completion date: 2002-06-30.
$374,469, same as above.Signed on 2000-03-07. Completion date: 2002-06-30.
$300,000 with Navy for Other Defense -- Basic Research (R&D). Signed on 2000-07-07. Completion date: 2001-06-28.
$98,465, same as above.Signed on 2001-02-07. Completion date: 2001-06-28.
TRIDENT INFORMATION SERVICES I (1100 MORAGA WAY; small business) : $788,070 in 7 contractsfrom 2000 to 2004
Contracts for Other ADP and Telecommunications Services (includes data storage on tapes, compact disks, etc.) by Navy Signed by year:2000: $119,200; 2001: $313,300; 2002: $0; 2003: $280,755; 2004: $74,815; 2005: $0; 2006: $0.
Biggest contracts:
$237,180 with Navy for Other ADP and Telecommunications Services (includes data storage on tapes, compact disks, etc.). Taking place in DC. Signed on 2001-10-01. Completion date: 2002-09-30.
$219,855, same as above.Signed on 2003-09-25. Completion date: 2004-09-24.
$119,200, same as above.Signed on 2000-09-25. Completion date: 2001-09-24.
$76,120, same as above.Signed on 2001-12-04. Completion date: 2002-09-30.
TIOGA GROUP INC, THE (288 RHEEM BLVD; small business) : $21,490 in 2 contractsin 2002
$16,730 with U.S. Army Corps of Engineers - civil program financing only for Architect - Engineer Services (including landscaping, interior layout, and designing). Taking place in OR. Signed on 2002-08-02. Completion date: 2002-08-02.
$4,760 with U.S. Army Corps of Engineers - civil program financing only for Other Professional Services. Signed on 2002-12-27. Completion date: 2003-01-10.
MAMCO INTERNATIONAL CORPORATIO (1042 COUNTRY CLUB DRIVE; small business)
$2,580 with Army for Miscellaneous Chemical Specialties. Signed on 2003-06-18. Completion date: 2003-07-07.
APPLIED VETERAN CONSULTING, IN (450 CENTER ST, STE-116; small business) : $0 in 2 contractsfrom 2002 to 2003
$328,334 with Navy for Miscellaneous Electrical and Electronic Components. Signed on 2002-11-18. Completion date: 2002-12-18.
-$328,334, same as above.Signed on 2003-01-13. Completion date: 2002-12-18.
Top industries in this zip code by the number of employees in 2005:
Educational Services: Colleges, Universities, and Professional Schools (over 1000 employees: 1 establishment, 1-4 employees: 1 establishment)
Administrative and Support and Waste Management and Remediation Services: Hazardous Waste Treatment and Disposal (250-499: 1)
Other Services (except Public Administration): Other Similar Organizations (except Business, Professional, Labor, and Political Organizations) (50-99: 1, 1-4: 1)
Health Care and Social Assistance: Nursing Care Facilities (50-99: 1)
People in group quarters in 2010:
571 people in college/university student housing
178 people in nursing facilities/skilled-nursing facilities
People in group quarters in 2000:
1,452 people in college dormitories (includes college quarters off campus)
111 people in other noninstitutional group quarters
44 people in nursing homes
24 people in religious group quarters
Home Mortgage Disclosure Act Aggregated Statistics For Year 2009 (Based on 12 partial tracts)
A) FHA, FSA/RHS & VA Home Purchase Loans
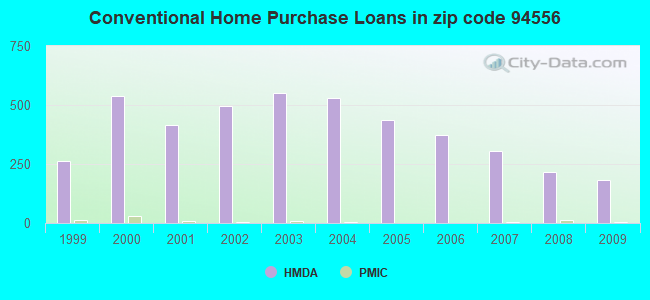
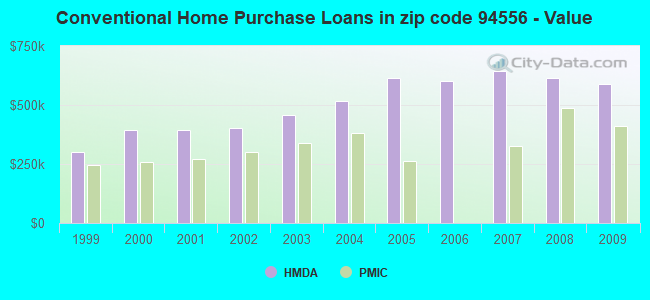
B) Conventional Home Purchase Loans
C) Refinancings
D) Home Improvement Loans
E) Loans on Dwellings For 5+ Families
F) Non-occupant Loans on < 5 Family Dwellings (A B C & D)
Number
Average Value
Number
Average Value
Number
Average Value
Number
Average Value
Number
Average Value
Number
Average Value
LOANS ORIGINATED
17
$601,343
184
$590,210
1,488
$427,005
62
$322,956
1
$740,300
27
$326,331
APPLICATIONS APPROVED, NOT ACCEPTED
3
$558,657
16
$575,858
139
$462,560
7
$266,540
0
$0
5
$250,684
APPLICATIONS DENIED
4
$289,762
19
$514,175
274
$497,791
12
$339,931
0
$0
26
$290,998
APPLICATIONS WITHDRAWN
6
$311,535
24
$436,450
193
$469,511
17
$262,089
0
$0
9
$214,393
FILES CLOSED FOR INCOMPLETENESS
0
$0
4
$673,528
54
$474,607
4
$131,555
0
$0
3
$470,923
Aggregated Statistics For Year 2008 (Based on 12 partial tracts)
A) FHA, FSA/RHS & VA Home Purchase Loans
B) Conventional Home Purchase Loans
C) Refinancings
D) Home Improvement Loans
E) Loans on Dwellings For 5+ Families
F) Non-occupant Loans on < 5 Family Dwellings (A B C & D)
Number
Average Value
Number
Average Value
Number
Average Value
Number
Average Value
Number
Average Value
Number
Average Value
LOANS ORIGINATED
7
$419,979
214
$612,359
400
$502,111
30
$308,418
5
$1,913,772
35
$426,222
APPLICATIONS APPROVED, NOT ACCEPTED
0
$0
56
$480,861
90
$449,711
5
$478,042
2
$604,555
11
$334,444
APPLICATIONS DENIED
0
$0
40
$804,050
129
$577,656
15
$388,682
0
$0
22
$474,225
APPLICATIONS WITHDRAWN
1
$554,030
55
$513,161
69
$481,369
13
$278,506
2
$941,700
6
$329,367
FILES CLOSED FOR INCOMPLETENESS
0
$0
6
$592,875
45
$576,352
12
$262,337
0
$0
4
$264,480
Aggregated Statistics For Year 2007 (Based on 12 partial tracts)
B) Conventional Home Purchase Loans
C) Refinancings
D) Home Improvement Loans
E) Loans on Dwellings For 5+ Families
F) Non-occupant Loans on < 5 Family Dwellings (A B C & D)
G) Loans On Manufactured Home Dwelling (A B C & D)
Number
Average Value
Number
Average Value
Number
Average Value
Number
Average Value
Number
Average Value
Number
Average Value
LOANS ORIGINATED
303
$645,092
514
$533,260
76
$323,407
10
$1,291,729
85
$425,998
0
$0
APPLICATIONS APPROVED, NOT ACCEPTED
65
$723,010
95
$487,052
14
$175,195
2
$1,013,850
10
$512,574
2
$97,630
APPLICATIONS DENIED
68
$648,957
158
$615,641
36
$146,783
0
$0
19
$403,764
2
$299,890
APPLICATIONS WITHDRAWN
32
$947,295
76
$482,943
7
$358,554
0
$0
8
$391,015
0
$0
FILES CLOSED FOR INCOMPLETENESS
4
$1,127,855
30
$508,457
2
$442,950
0
$0
3
$241,133
0
$0
Aggregated Statistics For Year 2006 (Based on 12 partial tracts)
B) Conventional Home Purchase Loans
C) Refinancings
D) Home Improvement Loans
E) Loans on Dwellings For 5+ Families
F) Non-occupant Loans on < 5 Family Dwellings (A B C & D)
Number
Average Value
Number
Average Value
Number
Average Value
Number
Average Value
Number
Average Value
LOANS ORIGINATED
375
$600,453
589
$563,179
79
$320,410
1
$2,537,070
72
$508,504
APPLICATIONS APPROVED, NOT ACCEPTED
46
$491,705
101
$573,440
5
$224,564
0
$0
15
$390,172
APPLICATIONS DENIED
56
$546,003
145
$543,610
30
$359,359
2
$1,877,500
16
$461,226
APPLICATIONS WITHDRAWN
27
$563,376
102
$532,994
15
$345,237
0
$0
8
$360,984
FILES CLOSED FOR INCOMPLETENESS
2
$334,325
28
$528,425
2
$308,965
0
$0
1
$191,390
Aggregated Statistics For Year 2005 (Based on 12 partial tracts)
B) Conventional Home Purchase Loans
C) Refinancings
D) Home Improvement Loans
E) Loans on Dwellings For 5+ Families
F) Non-occupant Loans on < 5 Family Dwellings (A B C & D)
Number
Average Value
Number
Average Value
Number
Average Value
Number
Average Value
Number
Average Value
LOANS ORIGINATED
437
$613,821
911
$499,444
128
$399,008
6
$1,275,668
85
$383,239
APPLICATIONS APPROVED, NOT ACCEPTED
40
$679,486
116
$445,532
12
$311,256
0
$0
5
$268,192
APPLICATIONS DENIED
46
$593,767
160
$567,689
41
$371,019
0
$0
16
$388,406
APPLICATIONS WITHDRAWN
35
$512,414
171
$483,972
18
$254,125
0
$0
6
$649,143
FILES CLOSED FOR INCOMPLETENESS
8
$737,356
19
$508,018
5
$146,010
0
$0
4
$285,860
Aggregated Statistics For Year 2004 (Based on 12 partial tracts)
B) Conventional Home Purchase Loans
C) Refinancings
D) Home Improvement Loans
E) Loans on Dwellings For 5+ Families
F) Non-occupant Loans on < 5 Family Dwellings (A B C & D)
Number
Average Value
Number
Average Value
Number
Average Value
Number
Average Value
Number
Average Value
LOANS ORIGINATED
529
$516,497
1,216
$430,435
70
$345,658
6
$1,954,213
79
$327,392
APPLICATIONS APPROVED, NOT ACCEPTED
62
$609,148
182
$472,678
11
$148,905
0
$0
10
$350,183
APPLICATIONS DENIED
60
$614,219
194
$481,184
39
$310,627
0
$0
16
$372,467
APPLICATIONS WITHDRAWN
48
$507,665
208
$416,518
18
$205,527
0
$0
14
$364,889
FILES CLOSED FOR INCOMPLETENESS
8
$563,215
32
$413,630
2
$48,815
0
$0
2
$349,215
Aggregated Statistics For Year 2003 (Based on 12 partial tracts)
A) FHA, FSA/RHS & VA Home Purchase Loans
B) Conventional Home Purchase Loans
C) Refinancings
D) Home Improvement Loans
E) Loans on Dwellings For 5+ Families
F) Non-occupant Loans on < 5 Family Dwellings (A B C & D)
Number
Average Value
Number
Average Value
Number
Average Value
Number
Average Value
Number
Average Value
Number
Average Value
LOANS ORIGINATED
2
$196,760
551
$458,666
3,448
$368,533
21
$146,005
4
$1,126,385
125
$262,864
APPLICATIONS APPROVED, NOT ACCEPTED
0
$0
50
$511,394
431
$387,383
6
$36,683
0
$0
13
$241,872
APPLICATIONS DENIED
0
$0
64
$461,734
345
$441,939
16
$94,784
3
$921,227
19
$327,121
APPLICATIONS WITHDRAWN
0
$0
67
$480,201
363
$355,132
3
$50,593
2
$684,910
20
$314,992
FILES CLOSED FOR INCOMPLETENESS
0
$0
10
$494,382
72
$377,519
2
$172,730
0
$0
1
$258,480
Aggregated Statistics For Year 2002 (Based on 12 partial tracts)
B) Conventional Home Purchase Loans
C) Refinancings
D) Home Improvement Loans
E) Loans on Dwellings For 5+ Families
F) Non-occupant Loans on < 5 Family Dwellings (A B C & D)
Number
Average Value
Number
Average Value
Number
Average Value
Number
Average Value
Number
Average Value
LOANS ORIGINATED
497
$403,439
2,771
$363,148
33
$169,643
2
$565,545
95
$256,498
APPLICATIONS APPROVED, NOT ACCEPTED
66
$474,628
360
$355,992
6
$75,857
0
$0
15
$249,351
APPLICATIONS DENIED
35
$378,719
217
$407,535
10
$169,690
0
$0
11
$218,670
APPLICATIONS WITHDRAWN
43
$408,008
250
$362,971
12
$117,622
1
$76,310
12
$298,990
FILES CLOSED FOR INCOMPLETENESS
25
$468,761
73
$425,593
0
$0
0
$0
5
$267,524
Aggregated Statistics For Year 2001 (Based on 12 partial tracts)
A) FHA, FSA/RHS & VA Home Purchase Loans
B) Conventional Home Purchase Loans
C) Refinancings
D) Home Improvement Loans
E) Loans on Dwellings For 5+ Families
F) Non-occupant Loans on < 5 Family Dwellings (A B C & D)
Number
Average Value
Number
Average Value
Number
Average Value
Number
Average Value
Number
Average Value
Number
Average Value
LOANS ORIGINATED
0
$0
416
$393,505
1,758
$360,448
111
$113,666
2
$838,190
68
$252,389
APPLICATIONS APPROVED, NOT ACCEPTED
0
$0
60
$456,182
195
$386,977
25
$107,285
0
$0
9
$500,898
APPLICATIONS DENIED
0
$0
35
$266,206
194
$386,369
27
$73,404
0
$0
5
$340,762
APPLICATIONS WITHDRAWN
1
$147,080
40
$345,223
247
$333,266
17
$98,549
0
$0
8
$255,038
FILES CLOSED FOR INCOMPLETENESS
0
$0
16
$607,899
76
$399,504
2
$34,725
0
$0
10
$398,883
Aggregated Statistics For Year 2000 (Based on 12 partial tracts)
A) FHA, FSA/RHS & VA Home Purchase Loans
B) Conventional Home Purchase Loans
C) Refinancings
D) Home Improvement Loans
E) Loans on Dwellings For 5+ Families
F) Non-occupant Loans on < 5 Family Dwellings (A B C & D)
Number
Average Value
Number
Average Value
Number
Average Value
Number
Average Value
Number
Average Value
Number
Average Value
LOANS ORIGINATED
4
$215,945
537
$393,590
317
$292,075
123
$58,192
2
$841,120
39
$213,345
APPLICATIONS APPROVED, NOT ACCEPTED
0
$0
57
$354,893
40
$290,590
14
$73,289
0
$0
6
$313,947
APPLICATIONS DENIED
0
$0
62
$333,249
86
$256,928
22
$52,474
0
$0
7
$160,771
APPLICATIONS WITHDRAWN
0
$0
31
$437,647
92
$240,821
11
$55,726
0
$0
2
$187,970
FILES CLOSED FOR INCOMPLETENESS
0
$0
10
$419,569
42
$328,779
1
$68,100
1
$877,220
4
$198,872
Aggregated Statistics For Year 1999 (Based on 6 partial tracts)
A) FHA, FSA/RHS & VA Home Purchase Loans
B) Conventional Home Purchase Loans
C) Refinancings
D) Home Improvement Loans
F) Non-occupant Loans on < 5 Family Dwellings (A B C & D)

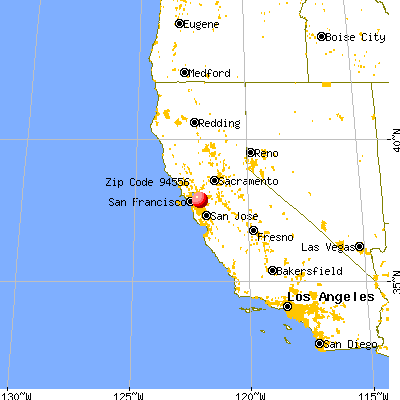


 Nearest zip codes: 94575, 94516, 94595, 94549, 94619, 94563.