Estimated zip code population in 2022: 70,477 Zip code population in 2010: 46,016 Zip code population in 2000: 29,633
Houses and condos: 24,888 Renter-occupied apartments: 8,512
% of renters here:
35%
State:
44%
March 2022 cost of living index in zip code 94568: 119.1 (more than average, U.S. average is 100)
Land area: 15.3 sq. mi. Water area: 0.0 sq. mi.
Population density: 4,610 people per square mile
(average).
OSM Map
General Map
Google Map
MSN Map
OSM Map
General Map
Google Map
MSN Map
OSM Map
General Map
Google Map
MSN Map
OSM Map
General Map
Google Map
MSN Map
Please wait while loading the map...
Real estate property taxes paid for housing units in 2022:
This zip code:
0.8% ($10,292)
California:
0.7% ($4,831)
Median real estate property taxes paid for housing units with mortgages in 2022: $10,330 (0.8%) Median real estate property taxes paid for housing units with no mortgage in 2022: $9,568 (0.8%)
Estimated median house/condo value in 2022: $1,264,036
94568:
$1,264,036
California:
$715,900
According to our research of California and other state lists, there were 17 registered sex offenders living in 94568 zip code as of May 28, 2024. The ratio of all residents to sex offenders in zip code 94568 is 3,058 to 1. The ratio of registered sex offenders to all residents in this zip code is much lower than the state average.
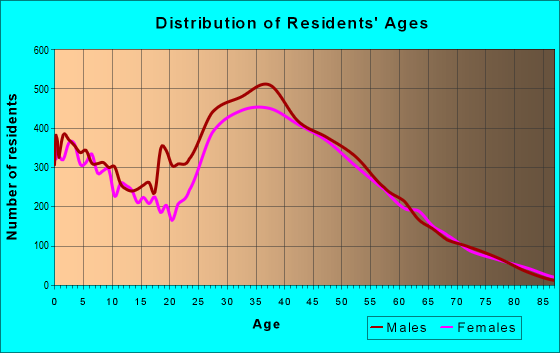
Median resident age:
This zip code:
37.7 years
California median age:
37.9 years
Average household size:
This zip code:
2.9 people
California:
2.8 people
Averages for the 2020 tax year for zip code 94568, filed in 2021:
Average Adjusted Gross Income (AGI) in 2020: $185,797 (Individual Income Tax Returns)
Here:
$185,797
State:
$95,910
Salary/wage: $173,543 (reported on 88.0% of returns)
Here:
$173,543
State:
$77,331
(% of AGI for various income ranges: 1167.9% for AGIs below $25k, 3793.7% for AGIs $25k-50k, 7398.8% for AGIs $50k-75k, 10927.4% for AGIs $75k-100k, 21657.3% for AGIs $100k-200k, 114707.1% for AGIs over 200k)
Taxable interest for individuals: $1,615 (reported on 52.4% of returns)
This zip code:
$1,615
California:
$2,294
(% of AGI for various income ranges: 39.3% for AGIs below $25k, 42.9% for AGIs $25k-50k, 70.6% for AGIs $50k-75k, 67.4% for AGIs $75k-100k, 128.2% for AGIs $100k-200k, 548.6% for AGIs over 200k)
Ordinary dividends: $4,232 (reported on 42.6% of returns)
Here:
$4,232
State:
$10,949
(% of AGI for various income ranges: 31.3% for AGIs below $25k, 67.8% for AGIs $25k-50k, 103.4% for AGIs $50k-75k, 119.4% for AGIs $75k-100k, 218.4% for AGIs $100k-200k, 1364.0% for AGIs over 200k)
Net capital gain/loss in AGI: +$30,610 (reported on 44.1% of returns)
Here:
+$30,610
State:
+$49,306
(% of AGI for various income ranges: 25.9% for AGIs below $25k, 85.1% for AGIs $25k-50k, 151.8% for AGIs $50k-75k, 292.7% for AGIs $75k-100k, 534.9% for AGIs $100k-200k, 13054.8% for AGIs over 200k)
Profit/loss from business: +$17,713 (reported on 16.0% of returns)
Here:
+$17,713
State:
+$15,671
(% of AGI for various income ranges: 142.3% for AGIs below $25k, 317.9% for AGIs $25k-50k, 308.2% for AGIs $50k-75k, 322.1% for AGIs $75k-100k, 438.0% for AGIs $100k-200k, 1580.8% for AGIs over 200k)
Taxable individual retirement arrangement distribution: $22,531 (reported on 6.0% of returns)
94568:
$22,531
California:
$23,505
(% of AGI for various income ranges: 59.8% for AGIs below $25k, 108.0% for AGIs $25k-50k, 199.2% for AGIs $50k-75k, 279.2% for AGIs $75k-100k, 340.2% for AGIs $100k-200k, 512.2% for AGIs over 200k)
Self-employed (Keogh) retirement plans: $25,595 (reported on 1.3% of returns)
94568:
$25,595
California:
$30,163
(% of AGI for various income ranges: 6.8% for AGIs below $25k, 17.6% for AGIs $50k-75k, 41.9% for AGIs $100k-200k, 264.2% for AGIs over 200k)
Total itemized deductions: $35,852 (reported on 32.0% of returns)
Here:
$35,852
State:
$39,517
(% of AGI for various income ranges: 171.1% for AGIs below $25k, 274.8% for AGIs $25k-50k, 511.1% for AGIs $50k-75k, 928.7% for AGIs $75k-100k, 1890.1% for AGIs $100k-200k, 8109.5% for AGIs over 200k)
Charity contributions: $6,410 (reported on 24.9% of returns)
Here:
$6,410
State:
$12,598
(% of AGI for various income ranges: 6.7% for AGIs below $25k, 22.3% for AGIs $25k-50k, 45.5% for AGIs $50k-75k, 101.3% for AGIs $75k-100k, 210.7% for AGIs $100k-200k, 1265.1% for AGIs over 200k)
Taxes paid: $9,720 (reported on 31.9% of returns)
94568:
$9,720
State:
$8,807
(% of AGI for various income ranges: 40.3% for AGIs below $25k, 74.4% for AGIs $25k-50k, 156.7% for AGIs $50k-75k, 299.5% for AGIs $75k-100k, 590.2% for AGIs $100k-200k, 2050.8% for AGIs over 200k)
Earned income credit: $1,664 (reported on 4.7% of returns)
Here:
$1,664
State:
$2,074
(% of AGI for various income ranges: 43.3% for AGIs below $25k, 43.4% for AGIs $25k-50k, 0.9% for AGIs $50k-75k)
Percentage of individuals using paid preparers for their 2020 taxes: 93.3%
Here:
93%
State:
92%
(% for various income ranges: 90.2% for AGIs below $25k, 91.7% for AGIs $25k-50k, 93.0% for AGIs $50k-75k, 92.6% for AGIs $75k-100k, 93.1% for AGIs $100k-200k, 95.9% for AGIs over 200k)
Averages for the 2012 tax year for zip code 94568, filed in 2013:
Average Adjusted Gross Income (AGI) in 2012: $106,388 (Individual Income Tax Returns)
Here:
$106,388
State:
$72,726
Salary/wage: $102,220 (reported on 88.7% of returns)
Here:
$102,220
State:
$59,079
(% of AGI for various income ranges: 77.7% for AGIs below $25k, 81.3% for AGIs $25k-50k, 82.6% for AGIs $50k-75k, 84.4% for AGIs $75k-100k, 88.8% for AGIs $100k-200k, 83.3% for AGIs over 200k)
Taxable interest for individuals: $795 (reported on 51.3% of returns)
This zip code:
$795
California:
$2,146
(% of AGI for various income ranges: 1.1% for AGIs below $25k, 0.6% for AGIs $25k-50k, 0.6% for AGIs $50k-75k, 0.4% for AGIs $75k-100k, 0.3% for AGIs $100k-200k, 0.3% for AGIs over 200k)
Ordinary dividends: $3,029 (reported on 31.1% of returns)
Here:
$3,029
State:
$9,308
(% of AGI for various income ranges: 1.9% for AGIs below $25k, 1.1% for AGIs $25k-50k, 0.9% for AGIs $50k-75k, 0.8% for AGIs $75k-100k, 0.7% for AGIs $100k-200k, 1.0% for AGIs over 200k)
Net capital gain/loss in AGI: +$8,330 (reported on 28.6% of returns)
Here:
+$8,330
State:
+$30,460
(% of AGI for various income ranges: 0.4% for AGIs $50k-75k, 0.4% for AGIs $75k-100k, 0.5% for AGIs $100k-200k, 5.2% for AGIs over 200k)
Profit/loss from business: +$21,056 (reported on 16.6% of returns)
Here:
+$21,056
State:
+$17,064
(% of AGI for various income ranges: 10.1% for AGIs below $25k, 6.5% for AGIs $25k-50k, 3.9% for AGIs $50k-75k, 4.0% for AGIs $75k-100k, 2.6% for AGIs $100k-200k, 2.9% for AGIs over 200k)
Taxable individual retirement arrangement distribution: $17,837 (reported on 7.4% of returns)
94568:
$17,837
California:
$19,557
(% of AGI for various income ranges: 3.4% for AGIs below $25k, 2.3% for AGIs $25k-50k, 2.3% for AGIs $50k-75k, 1.6% for AGIs $75k-100k, 1.2% for AGIs $100k-200k, 0.7% for AGIs over 200k)
Self-employment retirement plans: $20,769 (reported on 1.3% of returns)
94568:
$20,769
California:
$24,530
(% of AGI for various income ranges: 0.2% for AGIs $50k-75k, 0.2% for AGIs $75k-100k, 0.2% for AGIs $100k-200k, 0.4% for AGIs over 200k)
Total itemized deductions: $33,754 (22% of AGI, reported on 56.1% of returns)
Here:
$33,754
State:
$34,004
Here:
21.6% of AGI
State:
22.7% of AGI
(% of AGI for various income ranges: 17.7% for AGIs below $25k, 13.6% for AGIs $25k-50k, 16.5% for AGIs $50k-75k, 17.6% for AGIs $75k-100k, 19.3% for AGIs $100k-200k, 17.2% for AGIs over 200k)
Charity contributions: $2,898 (reported on 45.8% of returns)
Here:
$2,898
State:
$4,659
(% of AGI for various income ranges: 0.7% for AGIs below $25k, 1.1% for AGIs $25k-50k, 1.3% for AGIs $50k-75k, 1.4% for AGIs $75k-100k, 1.4% for AGIs $100k-200k, 1.1% for AGIs over 200k)
Taxes paid: $15,646 (reported on 56.0% of returns)
94568:
$15,646
State:
$14,448
(% of AGI for various income ranges: 4.1% for AGIs below $25k, 3.7% for AGIs $25k-50k, 5.1% for AGIs $50k-75k, 6.6% for AGIs $75k-100k, 8.5% for AGIs $100k-200k, 9.8% for AGIs over 200k)
Earned income credit: $1,737 (reported on 6.3% of returns)
Here:
$1,737
State:
$2,286
(% of AGI for various income ranges: 3.2% for AGIs below $25k, 0.6% for AGIs $25k-50k)
Percentage of individuals using paid preparers for their 2012 taxes: 49.9%
Here:
50%
State:
64%
(% for various income ranges: 44.1% for AGIs below $25k, 49.8% for AGIs $25k-50k, 51.4% for AGIs $50k-75k, 52.0% for AGIs $75k-100k, 50.3% for AGIs $100k-200k, 55.4% for AGIs over 200k)
Averages for the 2004 tax year for zip code 94568, filed in 2005:
Average Adjusted Gross Income (AGI) in 2004: $78,939 (Individual Income Tax Returns)
Here:
$78,939
State:
$58,600
Salary/wage: $75,649 (reported on 89.2% of returns)
Here:
$75,649
State:
$49,455
(% of AGI for various income ranges: 214.0% for AGIs below $10k, 76.5% for AGIs $10k-25k, 83.8% for AGIs $25k-50k, 86.5% for AGIs $50k-75k, 89.3% for AGIs $75k-100k, 84.3% for AGIs over 100k)
Taxable interest for individuals: $983 (reported on 58.3% of returns)
This zip code:
$983
California:
$2,365
(% of AGI for various income ranges: 14.6% for AGIs below $10k, 1.8% for AGIs $10k-25k, 0.9% for AGIs $25k-50k, 0.8% for AGIs $50k-75k, 0.6% for AGIs $75k-100k, 0.6% for AGIs over 100k)
Taxable dividends: $1,766 (reported on 31.6% of returns)
Here:
$1,766
State:
$4,746
(% of AGI for various income ranges: 8.3% for AGIs below $10k, 1.5% for AGIs $10k-25k, 0.6% for AGIs $25k-50k, 0.7% for AGIs $50k-75k, 0.5% for AGIs $75k-100k, 0.7% for AGIs over 100k)
Net capital gain/loss: +$8,381 (reported on 29.8% of returns)
Here:
+$8,381
State:
+$23,418
(% of AGI for various income ranges: -6.8% for AGIs below $10k, -0.0% for AGIs $10k-25k, 0.0% for AGIs $25k-50k, 0.4% for AGIs $50k-75k, 0.4% for AGIs $75k-100k, 5.1% for AGIs over 100k)
Profit/loss from business: +$20,151 (reported on 17.1% of returns)
Here:
+$20,151
State:
+$16,826
(% of AGI for various income ranges: 7.4% for AGIs below $10k, 8.1% for AGIs $10k-25k, 5.9% for AGIs $25k-50k, 4.8% for AGIs $50k-75k, 3.5% for AGIs $75k-100k, 4.1% for AGIs over 100k)
IRA payment deduction: $3,228 (reported on 3.1% of returns)
94568:
$3,228
California:
$3,192
(% of AGI for various income ranges: 0.8% for AGIs below $10k, 0.3% for AGIs $10k-25k, 0.3% for AGIs $25k-50k, 0.1% for AGIs $50k-75k, 0.2% for AGIs $75k-100k, 0.1% for AGIs over 100k)
Self-employed pension: $13,592 (reported on 1.7% of returns)
Here:
$13,592
California:
$17,688
(% of AGI for various income ranges: 0.2% for AGIs $25k-50k, 0.2% for AGIs $50k-75k, 0.2% for AGIs $75k-100k, 0.4% for AGIs over 100k)
Total itemized deductions: $30,814 (27% of AGI, reported on 56.2% of returns)
Here:
$30,814
State:
$28,113
Here:
26.7% of AGI
State:
25.3% of AGI
(% of AGI for various income ranges: 50.8% for AGIs below $10k, 18.3% for AGIs $10k-25k, 15.9% for AGIs $25k-50k, 21.5% for AGIs $50k-75k, 22.9% for AGIs $75k-100k, 22.6% for AGIs over 100k)
Charity contributions deductions: $2,685 (2% of AGI, reported on 49.3% of returns)
Here:
$2,685
State:
$3,923
Here:
2.3% of AGI
State:
3.3% of AGI
(% of AGI for various income ranges: 1.9% for AGIs below $10k, 0.9% for AGIs $10k-25k, 1.2% for AGIs $25k-50k, 1.7% for AGIs $50k-75k, 1.9% for AGIs $75k-100k, 1.7% for AGIs over 100k)
Total tax: $12,403 (reported on 87.3% of returns)
94568:
$12,403
State:
$10,761
(% of AGI for various income ranges: 9.1% for AGIs below $10k, 5.5% for AGIs $10k-25k, 8.9% for AGIs $25k-50k, 10.3% for AGIs $50k-75k, 10.7% for AGIs $75k-100k, 16.3% for AGIs over 100k)
Earned income credit: $1,442 (reported on 4.8% of returns)
Here:
$1,442
State:
$1,763
Percentage of individuals using paid preparers for their 2004 taxes: 52.3%
Here:
52%
State:
66%
(% for various income ranges: 41.2% for AGIs below $10k, 49.9% for AGIs $10k-25k, 50.6% for AGIs $25k-50k, 54.4% for AGIs $50k-75k, 54.6% for AGIs $75k-100k, 57.0% for AGIs over 100k)
Likely homosexual households (counted as self-reported same-sex unmarried-partner households)
Lesbian couples: 0.1% of all households
Gay men: 0.0% of all households
Household received Food Stamps/SNAP in the past 12 months: 1,007 Household did not receive Food Stamps/SNAP in the past 12 months: 22,554
Women who had a birth in the past 12 months: 901 (849 now married, 46 unmarried) Women who did not have a birth in the past 12 months: 18,023 (10,653 now married, 7,223 unmarried)
Housing units in zip code 94568 with a mortgage: 12,144 (1,610 second mortgage, 50 home equity loan, 1,384 both second mortgage and home equity loan) Houses without a mortgage: 176
Median monthly owner costs for units with a mortgage: $3,876 Median monthly owner costs for units without a mortgage: $1,196
Residents with income below the poverty level in 2022:
This zip code:
4.0%
Whole state:
12.2%
Residents with income below 50% of the poverty level in 2022:
This zip code:
1.4%
Whole state:
6.2%
Median number of rooms in houses and condos:
Here:
6.6
State:
6.0
Median number of rooms in apartments:
Here:
4.1
State:
3.9
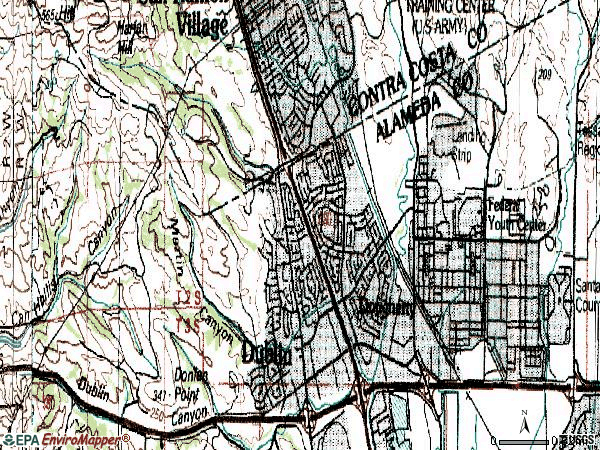
Notable locations in this zip code not listed on our city pages
Notable locations in zip code 94568: Camp Parks (A), Dublin Library (B), Shannon Community Center (C), Dublin City Hall (D), Alameda County Fire Department Station 17 (E), Alameda County Fire Department Station 15 (F), Alameda County Fire Department Station 18 (G), Camp Parks Fire and Emergency Services (H), Alameda County Fire Department Station 16 (I). Display/hide their locations on the map
Shopping Centers: Dublin Place Shopping Center (1), Dublin Plaza Shopping Center (2), Dublin Square Shopping Center (3), Shamrock Village Shopping Center (4), Valley Center Shopping Center (5). Display/hide their locations on the map
Parks in zip code 94568 include: Dublin Public Park (1), Dublin Sports Grounds (2), Kolb Park (3), Mape Park (4), Shannon Park (5), Dolan Park (6), Dublin Swim Center (7), Dougherty Hills Park (8), Stagecoach Park (9). Display/hide their locations on the map
15,154 married couples with children.
1,964 single-parent households (743 men, 1,221 women).
49.9% of residents of 94568 zip code speak English at home.
5.0% of residents speak Spanish at home (73% very well, 15% well, 11% not well, 1% not at all).
17.5% of residents speak other Indo-European language at home (80% very well, 15% well, 5% not well, 1% not at all).
26.4% of residents speak Asian or Pacific Island language at home (69% very well, 19% well, 8% not well, 3% not at all).
1.6% of residents speak other language at home (90% very well, 5% well, 2% not well, 4% not at all).
Foreign born population: 28,384 (40.3%) (52.3% of them are naturalized citizens)
This zip code:
40.3%
Whole state:
26.7%
45%Bhutan
6%Malaysia
4%Japan
3%Honduras
2%Thailand
2%China, excluding Hong Kong and Taiwan
2%Hong Kong
3%Afghan
2%Irish
2%Iranian
1%American
1%German
1%English
1%Italian
Year of entry for the foreign-born population
12,1222010 or later
8,2032000 to 2009
5,0551990 to 1999
5,164Before 1990
Major facilities with environmental interests located in this zip code:
HEXCEL (11711 DUBLIN BLVD. in DUBLIN, CA)
STATE MASTER (California - Hazardous Waste Tracking) - HAZARDOU WASTE PROGRAM CRITERIA AND HAZARDOUS AIR POLLUTANT INVENTORY (Inventory of air pollution sources) HAZARDOUS WASTE BIENNIAL REPORTER (Resource Conservation and Recovery Act (tracking hazardous waste)) Large Quantity Generators, more that 1000 kg of hazardous waste/month (Resource Conservation and Recovery Act (tracking hazardous waste)) - notification Business SIC classification: COATED FABRICS, NOT RUBBERIZED; METAL STAMPINGS Organizations: HEXCEL CORPORATION (CONTACT/OWNER)
Alternative names: HEXCEL RESEARCH AND DEVELOPMENT
GLORY'S DRY CLEANING & LAUNDRY (7988 AMADOR VALLEY BLVD in DUBLIN, CA)
STATE MASTER (California - Hazardous Waste Tracking) - HAZARDOU WASTE PROGRAM CRITERIA AND HAZARDOUS AIR POLLUTANT INVENTORY (Inventory of air pollution sources) Small Quantity Generators, between 100 kg and 1000 kg of hazardous waste/month (Resource Conservation and Recovery Act (tracking hazardous waste)) - notification Business SIC classification: DRYCLEANING PLANTS, EXCEPT RUG CLEANING Organizations: CHARLIE PERKINS (CONTACT/OWNER)
Alternative names: GLORY CLEANERS
KRAGEN AUTO PARTS #4045 (7100 REGIONAL ST in DUBLIN, CA)
Conditionally Exempt Small Quantity Generators, less than 100 kg/month of hazardous waste (Resource Conservation and Recovery Act (tracking hazardous waste)) - notification STATE MASTER (California - Used Oil Recycling System ) - USED OIL RECYCLING Organizations: GRAND AUTO, INC (CONTACT/OWNER)
Alternative names: GRAND AUTO, INC
LABEL CONCEPTS INC (6700 SIERRA LANE in DUBLIN, CA)
STATE MASTER (California - Hazardous Waste Tracking) - HAZARDOU WASTE PROGRAM Small Quantity Generators, between 100 kg and 1000 kg of hazardous waste/month (Resource Conservation and Recovery Act (tracking hazardous waste)) - notification Business NAICS classification: OTHER COMMERCIAL PRINTING. Organizations: DEE POPELAR (CONTACT/OWNER)
MAGNUSSENS CAR WEST AUTOBODY DUBLIN (6077 DUBLIN BLVD in DUBLIN, CA)
STATE MASTER (California - Hazardous Waste Tracking) - HAZARDOU WASTE PROGRAM CRITERIA AND HAZARDOUS AIR POLLUTANT INVENTORY (Inventory of air pollution sources) Small Quantity Generators, between 100 kg and 1000 kg of hazardous waste/month (Resource Conservation and Recovery Act (tracking hazardous waste)) - notification Business SIC classification: TOP, BODY, AND UPHOLSTERY REPAIR SHOPS AND PAINT SHOPS Alternative names: MAGNUSSEN'S CAR WEST AUTO BODY
EQUILON ENTERPRISES (11989 DUBLIN BL/SAN RAMON RD in DUBLIN, CA) . Federal Facility
STATE MASTER (California - Hazardous Waste Tracking) - HAZARDOU WASTE PROGRAM Small Quantity Generators, between 100 kg and 1000 kg of hazardous waste/month (Resource Conservation and Recovery Act (tracking hazardous waste)) - notification Organizations: EQUILON ENTERPRISES, LLC (CONTACT/OWNER)
Alternative names: SHELL OIL CO
LONGS DRUG STORE NO 495 (7201 REGIONAL ST in DUBLIN, CA)
STATE MASTER (California - Hazardous Waste Tracking) - HAZARDOU WASTE PROGRAM Small Quantity Generators, between 100 kg and 1000 kg of hazardous waste/month (Resource Conservation and Recovery Act (tracking hazardous waste)) - notification Organizations: LONGS DRUG STORES CAL (CONTACT/OWNER)
Alternative names: LONGS DRUG STORE #495
CHEVRON STATION NO 95542 (7007 SAN RAMON VLY BLVD in DUBLIN, CA)
STATE MASTER (California - Hazardous Waste Tracking) - HAZARDOU WASTE PROGRAM Small Quantity Generators, between 100 kg and 1000 kg of hazardous waste/month (Resource Conservation and Recovery Act (tracking hazardous waste)) - notification Organizations: CHEVRON PRODUCTS CO (CONTACT/OWNER)
Alternative names: CHEVRON STATION #95542
AMERICAN XTAL TECHNOLOGY (6780 SIERRA CT, SUITE I in DUBLIN, CA)
(Resource Conservation and Recovery Act (tracking hazardous waste)) Large Quantity Generators, more that 1000 kg of hazardous waste/month (Resource Conservation and Recovery Act (tracking hazardous waste)) Business NAICS classification: SEMICONDUCTOR AND RELATED DEVICE MANUFACTURING.
FREDERIKSEN ELEMENTARY (7243 TAMARACK DR. in DUBLIN, CA)
(National Center for Education Statistics) - STATE ID-6001390 Organizations: DUBLIN UNIFIED (SCHOOL DISTRICT)
LEW DOTY CADILLAC (6301 SCARLETT CT in DUBLIN, CA)
Small Quantity Generators, between 100 kg and 1000 kg of hazardous waste/month (Resource Conservation and Recovery Act (tracking hazardous waste)) - notification (Resource Conservation and Recovery Act (tracking hazardous waste)) Organizations: LEWIS E DOTY (CONTACT/OWNER)
, EL MONTE RV (CONTACT/OWNER)
Alternative names: EL MONTE RV
MURRAY ELEMENTARY (8435 DAVONA DR. in DUBLIN, CA)
(National Center for Education Statistics) - STATE ID-6001424 Organizations: DUBLIN UNIFIED (SCHOOL DISTRICT)
NIELSEN ELEMENTARY (7500 AMARILLO DR. in DUBLIN, CA)
(National Center for Education Statistics) - STATE ID-6001432 Organizations: DUBLIN UNIFIED (SCHOOL DISTRICT)
Housing units lacking complete plumbing facilities: 0.3% Housing units lacking complete kitchen facilities: 1.1%
64.1%Utility gas
32.5%Electricity
1.6%Solar energy
0.9%Bottled, tank, or LP gas
0.7%No fuel used
Population in 1990: 23,275. Population change in the 1990s: +6,358 (+27.3%).
Place of birth for U.S.-born residents:
This state: 31,498
Northeast: 2,273
Midwest: 2,752
South: 2,712
West: 1,824
47% of the 94568 zip code residents lived in the same house 5 years ago. Out of people who lived in different houses, 58% lived in this county. Out of people who lived in different counties, 50% lived in California.
84% of the 94568 zip code residents lived in the same house 1 year ago. Out of people who lived in different houses, 52% moved from this county. Out of people who lived in different houses, 27% moved from different county within same state. Out of people who lived in different houses, 15% moved from different state. Out of people who lived in different houses, 4% moved from abroad.
Private vs. public school enrollment:
Students in private schools in grades 1 to 8 (elementary and middle school): 700
Here:
8.3%
California:
10.5%
Students in private schools in grades 9 to 12 (high school): 301
Here:
8.5%
California:
8.5%
Students in private undergraduate colleges: 366
Here:
14.2%
California:
15.9%
Occupation by median earnings in the past 12 months ($)
170,668Computer and mathematical occupations
168,344Management occupations
140,500Architecture and engineering occupations
140,034Health diagnosing and treating practitioners and other technical occupations
139,366Law enforcement workers including supervisors
106,361Business and financial operations occupations
Companies with biggest federal contracts located in this zip code (DUBLIN, CA):
MCE CORPORATION (6515 TRINITY COURT; small business) : $21,779,109 in 86 contractsfrom 1999 to 2006
Contracts for Construction of Structures and Facilities -- Other Administrative Facilities and Service Buildings, Maintenance, Repair or Alteration of Real Property -- Other Non-Building Facilities, Construction of Structures and Facilities -- Other Non-Building Facilities, Construction of Structures and Facilities -- Miscellaneous Buildings, and moreby Army, Public Buildings Service Signed by year:2000: $10,531,731; 2001: $899,080; 2002: $964,288; 2003: $1,161,826; 2004: $2,619,777; 2005: $4,881,264; 2006: $313,910.
Biggest contracts:
$3,824,767 with Army for Construction of Structures and Facilities -- Other Administrative Facilities and Service Buildings. Taking place in NC. Signed on 2000-04-21. Completion date: 2002-08-04.
$1,828,678, same as above.Signed on 2000-06-09. Completion date: 2000-12-30.
$1,589,700 with Army for Maintenance, Repair or Alteration of Real Property -- Other Non-Building Facilities. Taking place in NC. Signed on 2005-09-30. Completion date: 2006-08-30.
$1,365,979 with Army for Construction of Structures and Facilities -- Other Non-Building Facilities. Taking place in NC. Signed on 2005-09-30. Completion date: 2006-07-30.
MAXIOS LASER CORPORATION (6551SIERRA LANE; small business)
$425,079 with Air Force for Ammunition -- Management and Support (R&D). Signed on 1999-12-07. Completion date: 2001-12-30.
CARL ZEISS MEDITEC INC (5160 HACIENDA DRIVE) : $376,798 in 74 contractsfrom 2000 to 2006
Contracts for X-Ray Equipment and Supplies: Medical, Dental, Veterinary, Ophthalmic Instruments, Equipment, and Supplies, Medical and Surgical Instruments, Equipment, and Supplies, Miscellaneous Furniture and Fixtures, and moreby Defense Logistics Agency, Army, Department of Veterans Affairs, Navy, and others Signed by year:2000: $65,000; 2001: $101,190; 2002: $3,461; 2003: $14,375; 2004: $20,864; 2005: $41,259; 2006: $130,649.
Biggest contracts:
$75,980 with Defense Logistics Agency for X-Ray Equipment and Supplies: Medical, Dental, Veterinary. Signed on 2001-01-08. Completion date: 2001-01-30.
$65,000 with Army for Ophthalmic Instruments, Equipment, and Supplies. Signed on 2000-09-30. Completion date: 2000-12-29.
$28,380 with Department of Veterans Affairs for Medical and Surgical Instruments, Equipment, and Supplies. Signed on 2006-06-28. Effective on 2006-06-27. Completion date: 2007-06-25.
$25,210 with Defense Logistics Agency for Ophthalmic Instruments, Equipment, and Supplies. Signed on 2001-01-08. Completion date: 2001-01-30.
SYNPEP CORPORATION (6905 SIERRA CT; small business) : $326,725 in 9 contractsfrom 2002 to 2006
Contracts for Laboratory Equipment and Supplies, Miscellaneous Chemical Specialties, Drugs and Biologicals, , and moreby Army, National Institutes of Health, Centers for Disease Control and Prevention, Uniformed Services University of the Health Sciences, and others Signed by year:2000: $0; 2001: $0; 2002: $33,540; 2003: $0; 2004: $187,287; 2005: $102,204; 2006: $3,694.
Biggest contracts:
$120,027 with Army for Laboratory Equipment and Supplies. Signed on 2004-09-02. Completion date: 2004-11-30.
$90,000 with Army for Miscellaneous Chemical Specialties. Signed on 2005-05-03. Completion date: 2005-07-25.
$56,760 with National Institutes of Health for Drugs and Biologicals. Taking place in VA. Signed on 2004-09-28. Completion date: 2004-11-05.
$28,000 with Centers for Disease Control and Prevention for Laboratory Equipment and Supplies. Taking place in GA. Signed on 2002-06-15. Completion date: 2002-07-15.
US ARMY PARKS LODGING (BLDG 1151 12TH STREET) : $290,393 in 11 contractsfrom 2002 to 2005
Contracts for Lodging - Hotel/Motel by Army Signed by year:2000: $0; 2001: $0; 2002: $73,933; 2003: $66,871; 2004: $133,079; 2005: $16,510; 2006: $0.
Biggest contracts:
$73,933 with Army for Lodging - Hotel/Motel. Signed on 2002-10-01. Completion date: 2003-04-30.
$71,510, same as above.Signed on 2005-04-15. Completion date: 2005-09-30.
$60,390, same as above.Signed on 2004-04-13. Completion date: 2004-09-30.
$55,137, same as above.Signed on 2003-07-01. Completion date: 2003-09-30.
INTERNATIONAL TECHNOLOGY CONCE (6951C SIERRA LANE; small business)
$99,994 with Air Force for Defense Electronics and Communication Equipment -- Management and Support (R&D). Signed on 2003-07-25. Completion date: 2004-05-02.
AOC TECHNOLOGIES INC (6690 AMADOR PLAZA DR STE 1; small business) : $95,962 in 6 contractsfrom 2002 to 2005
Contracts for Miscellaneous Electrical and Electronic Components, Fiber Optic Interconnectors, Misc Fiber Optic Components, Hose, Pipe, Tube, Lubrication, and Railing Fittings by Army Signed by year:2000: $0; 2001: $0; 2002: $26,638; 2003: $27,030; 2004: $21,546; 2005: $20,748; 2006: $0.
Biggest contracts:
$21,546 with Army for Miscellaneous Electrical and Electronic Components. Signed on 2004-03-30. Completion date: 2004-04-29.
$20,770 with Army for Fiber Optic Interconnectors. Signed on 2002-12-19. Completion date: 2003-01-09.
$20,748 with Army for Misc Fiber Optic Components. Signed on 2005-02-15. Completion date: 2005-03-08.
$15,105 with Army for Miscellaneous Electrical and Electronic Components. Signed on 2003-03-25. Completion date: 2003-04-05.
COMVIEW CORPORATION (6465 SIERRA LN) : $78,000 in 2 contractsfrom 2002 to 2003
$39,000 with Army for Medical and Surgical Instruments, Equipment, and Supplies. Taking place in GA. Signed on 2003-09-27. Completion date: 2006-09-28.
$39,000, same as above.Signed on 2002-08-15. Completion date: 2006-09-28.
ENCAPCO LP (11555 DUBLIN BLVD; small business)
$68,640 with Army for Other Defense -- Basic Research (R&D). Signed on 1999-12-07. Completion date: 2000-12-06.
IMAGERY INTERPRETATION INTERNA (7724 CANTERBURY LANE; small business) : $28,279 in 2 contractsfrom 2003 to 2004
$17,271 with Army for ADP Components. Taking place in CO. Signed on 2004-09-20. Completion date: 2004-10-22.
$11,008 with Federal Technology Service for ADPE System Configuration. Signed on 2003-03-15. Completion date: 2003-05-15.
Top industries in this zip code by the number of employees in 2005:
Administrative and Support and Waste Management and Remediation Services: Temporary Help Services (100-249: 2, 50-99: 2, 20-49: 2, 10-19: 2, 1-4: 1)
Management of Companies and Enterprises: Corporate, Subsidiary, and Regional Managing Offices (250-499: 1, 50-99: 1, 20-49: 2, 10-19: 3, 5-9: 1, 1-4: 6)
Professional, Scientific, and Technical Services: Research and Development in the Physical, Engineering, and Life Sciences (250-499: 1, 50-99: 1, 20-49: 1, 1-4: 2)
People in group quarters in 2010:
4,324 people in local jails and other municipal confinement facilities
1,345 people in federal prisons
42 people in group homes intended for adults
27 people in other noninstitutional facilities
19 people in workers' group living quarters and job corps centers
13 people in group homes for juveniles (non-correctional)
4 people in residential treatment centers for adults
People in group quarters in 2000:
3,646 people in local jails and other confinement facilities (including police lockups)
1,613 people in federal prisons and detention centers
12 people in military barracks, etc.
7 people in other noninstitutional group quarters
6 people in other nonhousehold living situations
3 people in unknown juvenile institutions
3 people in military transient quarters for temporary residents
2 people in religious group quarters
Fatal accident statistics in 2014:
Fatal accident count: 2
Vehicles involved in fatal accidents: 3
Fatal accidents caused by drunken drivers: 0
Fatalities: 2
Persons involved in fatal accidents: 3
Pedestrians involved in fatal accidents: 1
Fatal accident statistics in 2012:
Fatal accident count: 1
Vehicles involved in fatal accidents: 1
Fatal accidents caused by drunken drivers: 0
Fatalities: 1
Persons involved in fatal accidents: 1
Pedestrians involved in fatal accidents: 1
Home Mortgage Disclosure Act Aggregated Statistics For Year 2009 (Based on 5 full and 4 partial tracts)
A) FHA, FSA/RHS & VA Home Purchase Loans
B) Conventional Home Purchase Loans
C) Refinancings
D) Home Improvement Loans
E) Loans on Dwellings For 5+ Families
F) Non-occupant Loans on < 5 Family Dwellings (A B C & D)
G) Loans On Manufactured Home Dwelling (A B C & D)
Number
Average Value
Number
Average Value
Number
Average Value
Number
Average Value
Number
Average Value
Number
Average Value
Number
Average Value
LOANS ORIGINATED
209
$451,027
526
$384,788
2,173
$327,018
65
$229,126
4
$29,069,910
114
$281,342
4
$65,050
APPLICATIONS APPROVED, NOT ACCEPTED
14
$414,511
75
$370,737
278
$363,248
10
$199,642
0
$0
16
$280,629
2
$90,000
APPLICATIONS DENIED
40
$498,400
107
$381,843
471
$389,867
16
$172,591
0
$0
39
$305,624
4
$79,858
APPLICATIONS WITHDRAWN
32
$361,571
63
$369,518
312
$356,045
13
$109,880
0
$0
19
$249,117
0
$0
FILES CLOSED FOR INCOMPLETENESS
9
$430,716
29
$380,324
117
$388,920
4
$50,440
0
$0
10
$257,740
0
$0
Aggregated Statistics For Year 2008 (Based on 5 full and 4 partial tracts)
A) FHA, FSA/RHS & VA Home Purchase Loans
B) Conventional Home Purchase Loans
C) Refinancings
D) Home Improvement Loans
E) Loans on Dwellings For 5+ Families
F) Non-occupant Loans on < 5 Family Dwellings (A B C & D)
G) Loans On Manufactured Home Dwelling (A B C & D)
Number
Average Value
Number
Average Value
Number
Average Value
Number
Average Value
Number
Average Value
Number
Average Value
Number
Average Value
LOANS ORIGINATED
139
$456,783
810
$348,464
810
$353,880
57
$244,782
2
$11,802,620
141
$305,749
6
$71,877
APPLICATIONS APPROVED, NOT ACCEPTED
12
$460,450
139
$374,586
203
$358,221
16
$409,936
0
$0
12
$346,086
11
$84,362
APPLICATIONS DENIED
17
$433,552
202
$352,423
435
$397,075
83
$261,099
0
$0
59
$325,612
2
$83,765
APPLICATIONS WITHDRAWN
30
$457,364
115
$398,397
198
$383,226
32
$230,918
0
$0
29
$331,169
0
$0
FILES CLOSED FOR INCOMPLETENESS
6
$473,268
27
$357,640
85
$385,408
5
$53,858
0
$0
2
$326,145
0
$0
Aggregated Statistics For Year 2007 (Based on 5 full and 4 partial tracts)
A) FHA, FSA/RHS & VA Home Purchase Loans
B) Conventional Home Purchase Loans
C) Refinancings
D) Home Improvement Loans
F) Non-occupant Loans on < 5 Family Dwellings (A B C & D)
G) Loans On Manufactured Home Dwelling (A B C & D)
Number
Average Value
Number
Average Value
Number
Average Value
Number
Average Value
Number
Average Value
Number
Average Value
LOANS ORIGINATED
0
$0
1,584
$357,943
1,432
$408,331
153
$248,567
170
$356,009
2
$73,070
APPLICATIONS APPROVED, NOT ACCEPTED
0
$0
448
$403,109
300
$424,078
36
$234,605
65
$357,419
2
$58,815
APPLICATIONS DENIED
2
$371,590
392
$362,617
662
$441,036
72
$230,862
110
$407,360
4
$65,278
APPLICATIONS WITHDRAWN
0
$0
260
$336,794
220
$414,348
21
$287,358
30
$359,471
0
$0
FILES CLOSED FOR INCOMPLETENESS
0
$0
34
$404,731
84
$437,168
15
$132,285
8
$398,436
0
$0
Aggregated Statistics For Year 2006 (Based on 5 full and 4 partial tracts)
A) FHA, FSA/RHS & VA Home Purchase Loans
B) Conventional Home Purchase Loans
C) Refinancings
D) Home Improvement Loans
E) Loans on Dwellings For 5+ Families
F) Non-occupant Loans on < 5 Family Dwellings (A B C & D)
G) Loans On Manufactured Home Dwelling (A B C & D)
Number
Average Value
Number
Average Value
Number
Average Value
Number
Average Value
Number
Average Value
Number
Average Value
Number
Average Value
LOANS ORIGINATED
0
$0
1,422
$384,460
1,788
$407,156
228
$272,498
2
$21,925,200
211
$397,670
11
$74,008
APPLICATIONS APPROVED, NOT ACCEPTED
0
$0
321
$373,399
334
$394,827
56
$332,756
0
$0
48
$325,971
2
$148,495
APPLICATIONS DENIED
2
$211,995
394
$371,335
625
$434,650
121
$310,835
0
$0
76
$427,258
6
$109,788
APPLICATIONS WITHDRAWN
0
$0
237
$383,089
399
$416,183
36
$213,758
0
$0
38
$318,654
2
$87,330
FILES CLOSED FOR INCOMPLETENESS
0
$0
42
$320,041
134
$429,668
6
$117,932
0
$0
9
$441,437
0
$0
Aggregated Statistics For Year 2005 (Based on 5 full and 4 partial tracts)
B) Conventional Home Purchase Loans
C) Refinancings
D) Home Improvement Loans
F) Non-occupant Loans on < 5 Family Dwellings (A B C & D)
G) Loans On Manufactured Home Dwelling (A B C & D)
Number
Average Value
Number
Average Value
Number
Average Value
Number
Average Value
Number
Average Value
LOANS ORIGINATED
1,933
$455,438
2,398
$419,898
203
$295,950
265
$376,110
6
$189,355
APPLICATIONS APPROVED, NOT ACCEPTED
393
$432,647
360
$413,313
21
$436,178
41
$421,714
9
$124,659
APPLICATIONS DENIED
457
$440,525
670
$447,642
72
$221,213
45
$438,336
8
$69,396
APPLICATIONS WITHDRAWN
210
$460,437
495
$401,563
71
$309,275
33
$408,339
2
$191,345
FILES CLOSED FOR INCOMPLETENESS
65
$364,447
137
$434,537
8
$303,319
9
$435,394
0
$0
Aggregated Statistics For Year 2004 (Based on 5 full and 4 partial tracts)
B) Conventional Home Purchase Loans
C) Refinancings
D) Home Improvement Loans
E) Loans on Dwellings For 5+ Families
F) Non-occupant Loans on < 5 Family Dwellings (A B C & D)
G) Loans On Manufactured Home Dwelling (A B C & D)
Number
Average Value
Number
Average Value
Number
Average Value
Number
Average Value
Number
Average Value
Number
Average Value
LOANS ORIGINATED
2,326
$419,114
3,197
$353,322
198
$253,985
2
$11,356,800
360
$321,330
5
$90,148
APPLICATIONS APPROVED, NOT ACCEPTED
461
$450,236
444
$339,385
35
$173,432
0
$0
42
$288,387
2
$58,815
APPLICATIONS DENIED
495
$453,067
733
$378,435
87
$198,060
0
$0
88
$320,642
0
$0
APPLICATIONS WITHDRAWN
377
$419,269
604
$335,074
60
$197,208
0
$0
28
$364,248
2
$71,290
FILES CLOSED FOR INCOMPLETENESS
87
$446,175
109
$351,658
7
$27,644
0
$0
8
$312,125
0
$0
Aggregated Statistics For Year 2003 (Based on 5 full and 4 partial tracts)
A) FHA, FSA/RHS & VA Home Purchase Loans
B) Conventional Home Purchase Loans
C) Refinancings
D) Home Improvement Loans
E) Loans on Dwellings For 5+ Families
F) Non-occupant Loans on < 5 Family Dwellings (A B C & D)
Number
Average Value
Number
Average Value
Number
Average Value
Number
Average Value
Number
Average Value
Number
Average Value
LOANS ORIGINATED
6
$134,333
1,969
$349,373
6,780
$282,740
78
$71,562
2
$4,634,190
484
$246,357
APPLICATIONS APPROVED, NOT ACCEPTED
2
$23,170
301
$356,244
836
$298,530
29
$174,548
0
$0
58
$261,419
APPLICATIONS DENIED
2
$81,720
310
$352,424
843
$318,242
84
$80,697
0
$0
65
$292,365
APPLICATIONS WITHDRAWN
2
$231,870
239
$356,472
935
$300,470
24
$72,104
0
$0
35
$240,159
FILES CLOSED FOR INCOMPLETENESS
0
$0
75
$398,089
182
$312,730
4
$39,865
0
$0
23
$270,730
Aggregated Statistics For Year 2002 (Based on 5 full and 4 partial tracts)
A) FHA, FSA/RHS & VA Home Purchase Loans
B) Conventional Home Purchase Loans
C) Refinancings
D) Home Improvement Loans
F) Non-occupant Loans on < 5 Family Dwellings (A B C & D)
Number
Average Value
Number
Average Value
Number
Average Value
Number
Average Value
Number
Average Value
LOANS ORIGINATED
5
$161,580
1,856
$320,801
5,724
$293,772
65
$49,996
303
$236,527
APPLICATIONS APPROVED, NOT ACCEPTED
6
$121,110
221
$338,609
797
$300,662
42
$97,365
34
$272,572
APPLICATIONS DENIED
0
$0
207
$294,566
691
$292,192
54
$56,054
36
$283,123
APPLICATIONS WITHDRAWN
5
$209,238
202
$307,445
836
$303,872
26
$72,328
25
$314,692
FILES CLOSED FOR INCOMPLETENESS
2
$264,100
70
$337,784
206
$333,575
0
$0
14
$196,940
Aggregated Statistics For Year 2001 (Based on 5 full and 4 partial tracts)
A) FHA, FSA/RHS & VA Home Purchase Loans
B) Conventional Home Purchase Loans
C) Refinancings
D) Home Improvement Loans
E) Loans on Dwellings For 5+ Families
F) Non-occupant Loans on < 5 Family Dwellings (A B C & D)
Number
Average Value
Number
Average Value
Number
Average Value
Number
Average Value
Number
Average Value
Number
Average Value
LOANS ORIGINATED
12
$228,515
2,048
$301,600
4,451
$286,010
187
$58,339
4
$236,960
229
$228,310
APPLICATIONS APPROVED, NOT ACCEPTED
0
$0
491
$321,775
589
$285,652
45
$59,896
0
$0
21
$240,106
APPLICATIONS DENIED
5
$282,300
266
$311,254
676
$288,717
77
$54,332
0
$0
35
$216,018
APPLICATIONS WITHDRAWN
6
$254,717
334
$302,976
786
$281,651
36
$66,951
0
$0
37
$226,349
FILES CLOSED FOR INCOMPLETENESS
0
$0
111
$382,825
200
$261,237
12
$63,468
0
$0
17
$281,484
Aggregated Statistics For Year 2000 (Based on 5 full and 4 partial tracts)
A) FHA, FSA/RHS & VA Home Purchase Loans
B) Conventional Home Purchase Loans
C) Refinancings
D) Home Improvement Loans
E) Loans on Dwellings For 5+ Families
F) Non-occupant Loans on < 5 Family Dwellings (A B C & D)
Number
Average Value
Number
Average Value
Number
Average Value
Number
Average Value
Number
Average Value
Number
Average Value
LOANS ORIGINATED
6
$186,823
2,630
$276,983
916
$205,031
157
$42,666
2
$965,705
165
$225,122
APPLICATIONS APPROVED, NOT ACCEPTED
2
$53,815
666
$287,231
143
$180,485
48
$63,887
0
$0
25
$228,164
APPLICATIONS DENIED
0
$0
472
$284,194
296
$198,217
48
$61,646
0
$0
36
$202,314
APPLICATIONS WITHDRAWN
1
$190,000
385
$281,632
213
$181,741
26
$67,525
0
$0
19
$203,567
FILES CLOSED FOR INCOMPLETENESS
0
$0
129
$341,826
151
$209,164
6
$29,233
0
$0
4
$225,232
Aggregated Statistics For Year 1999 (Based on 3 full and 2 partial tracts)
A) FHA, FSA/RHS & VA Home Purchase Loans
B) Conventional Home Purchase Loans
C) Refinancings
D) Home Improvement Loans
E) Loans on Dwellings For 5+ Families
F) Non-occupant Loans on < 5 Family Dwellings (A B C & D)
2005 - 2018 National Fire Incident Reporting System (NFIRS) incidents
According to the data from the years 2005 - 2018 the average number of fire incidents per year is 75. The highest number of fires - 152 took place in 2017, and the least - 21 in 2014. The data has an increasing trend.
When looking into fire subcategories, the most incidents belonged to: Structure Fires (44.4%), and Outside Fires (35.4%).
Fire incident types reported to NFIRS in Zip Code 94568


 Nearest zip codes: 94582, 94583, 94566, 94506, 94588, 94552.


 According to the data from the years 2005 - 2018 the average number of fire incidents per year is 75. The highest number of fires - 152 took place in 2017, and the least - 21 in 2014. The data has an increasing trend.
 When looking into fire subcategories, the most incidents belonged to: Structure Fires (44.4%), and Outside Fires (35.4%).