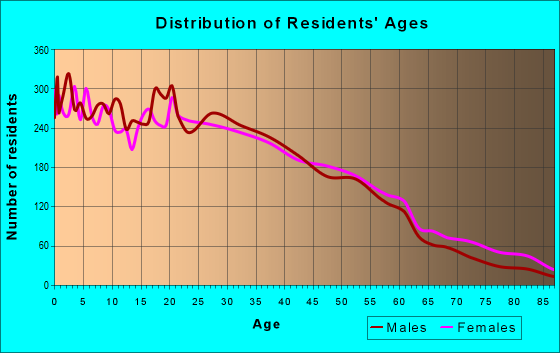
Estimated zip code population in 2022: 34,621 Zip code population in 2010: 29,870 Zip code population in 2000: 30,744
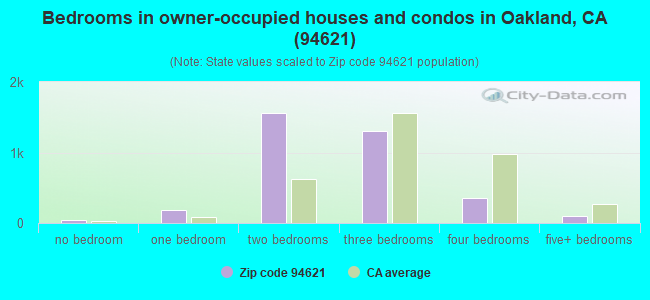
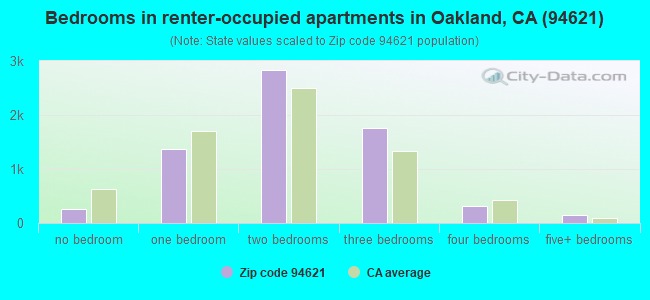
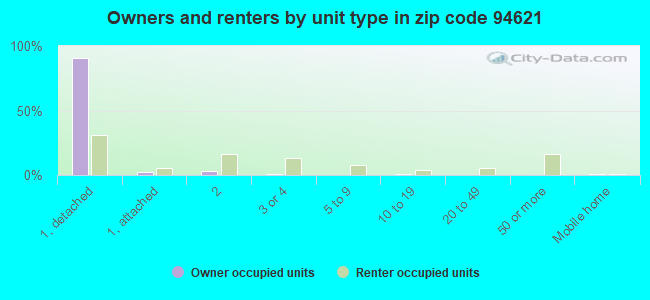
Houses and condos: 10,866 Renter-occupied apartments: 6,708
% of renters here:
65%
State:
44%
March 2022 cost of living index in zip code 94621: 120.2 (high, U.S. average is 100)
Land area: 7.8 sq. mi. Water area: 1.8 sq. mi.
Population density: 4,451 people per square mile
(average).
OSM Map
General Map
Google Map
MSN Map
OSM Map
General Map
Google Map
MSN Map
OSM Map
General Map
Google Map
MSN Map
OSM Map
General Map
Google Map
MSN Map
Please wait while loading the map...
Real estate property taxes paid for housing units in 2022:
This zip code:
0.8% ($4,448)
California:
0.7% ($4,831)
Median real estate property taxes paid for housing units with mortgages in 2022: $4,935 (0.9%) Median real estate property taxes paid for housing units with no mortgage in 2022: $3,607 (0.7%)
Averages for the 2020 tax year for zip code 94621, filed in 2021:
Average Adjusted Gross Income (AGI) in 2020: $42,801 (Individual Income Tax Returns)
Here:
$42,801
State:
$95,910
Salary/wage: $41,455 (reported on 85.0% of returns)
Here:
$41,455
State:
$77,331
(% of AGI for various income ranges: 1310.4% for AGIs below $25k, 4253.3% for AGIs $25k-50k, 7876.8% for AGIs $50k-75k, 11760.7% for AGIs $75k-100k, 20774.4% for AGIs $100k-200k, 77046.7% for AGIs over 200k)
Taxable interest for individuals: $239 (reported on 15.1% of returns)
This zip code:
$239
California:
$2,294
(% of AGI for various income ranges: 2.2% for AGIs below $25k, 3.0% for AGIs $25k-50k, 7.5% for AGIs $50k-75k, 13.6% for AGIs $75k-100k, 26.4% for AGIs $100k-200k, 36.7% for AGIs over 200k)
Ordinary dividends: $839 (reported on 2.8% of returns)
Here:
$839
State:
$10,949
(% of AGI for various income ranges: 1.9% for AGIs below $25k, 1.5% for AGIs $25k-50k, 5.9% for AGIs $50k-75k, 4.2% for AGIs $75k-100k, 15.3% for AGIs $100k-200k, 106.7% for AGIs over 200k)
Net capital gain/loss in AGI: +$22,183 (reported on 3.6% of returns)
Here:
+$22,183
State:
+$49,306
(% of AGI for various income ranges: 1.0% for AGIs below $25k, 4.6% for AGIs $25k-50k, 17.5% for AGIs $50k-75k, 17.2% for AGIs $75k-100k, 180.2% for AGIs $100k-200k, 34520.0% for AGIs over 200k)
Profit/loss from business: +$9,078 (reported on 18.6% of returns)
Here:
+$9,078
State:
+$15,671
(% of AGI for various income ranges: 254.6% for AGIs below $25k, 202.7% for AGIs $25k-50k, 183.9% for AGIs $50k-75k, 228.2% for AGIs $75k-100k, 871.6% for AGIs $100k-200k)
Taxable individual retirement arrangement distribution: $14,156 (reported on 1.1% of returns)
94621:
$14,156
California:
$23,505
(% of AGI for various income ranges: 6.2% for AGIs below $25k, 14.2% for AGIs $25k-50k, 32.6% for AGIs $50k-75k, 56.4% for AGIs $75k-100k, 141.8% for AGIs $100k-200k)
Total itemized deductions: $26,902 (reported on 6.6% of returns)
Here:
$26,902
State:
$39,517
(% of AGI for various income ranges: 29.2% for AGIs below $25k, 108.8% for AGIs $25k-50k, 388.4% for AGIs $50k-75k, 835.8% for AGIs $75k-100k, 1682.2% for AGIs $100k-200k, 4636.7% for AGIs over 200k)
Charity contributions: $5,447 (reported on 4.8% of returns)
Here:
$5,447
State:
$12,598
(% of AGI for various income ranges: 2.5% for AGIs below $25k, 15.5% for AGIs $25k-50k, 41.6% for AGIs $50k-75k, 119.0% for AGIs $75k-100k, 270.9% for AGIs $100k-200k, 1563.3% for AGIs over 200k)
Taxes paid: $8,893 (reported on 6.6% of returns)
94621:
$8,893
State:
$8,807
(% of AGI for various income ranges: 8.1% for AGIs below $25k, 35.0% for AGIs $25k-50k, 140.5% for AGIs $50k-75k, 265.1% for AGIs $75k-100k, 573.6% for AGIs $100k-200k, 1196.7% for AGIs over 200k)
Earned income credit: $2,478 (reported on 24.0% of returns)
Here:
$2,478
State:
$2,074
(% of AGI for various income ranges: 152.3% for AGIs below $25k, 91.3% for AGIs $25k-50k, 1.2% for AGIs $50k-75k)
Percentage of individuals using paid preparers for their 2020 taxes: 88.9%
Here:
89%
State:
92%
(% for various income ranges: 87.7% for AGIs below $25k, 89.2% for AGIs $25k-50k, 89.2% for AGIs $50k-75k, 90.1% for AGIs $75k-100k, 91.8% for AGIs $100k-200k, 100.0% for AGIs over 200k)
Averages for the 2012 tax year for zip code 94621, filed in 2013:
Average Adjusted Gross Income (AGI) in 2012: $29,529 (Individual Income Tax Returns)
Here:
$29,529
State:
$72,726
Salary/wage: $28,587 (reported on 85.5% of returns)
Here:
$28,587
State:
$59,079
(% of AGI for various income ranges: 76.2% for AGIs below $25k, 88.0% for AGIs $25k-50k, 87.6% for AGIs $50k-75k, 83.5% for AGIs $75k-100k, 68.0% for AGIs $100k-200k)
Taxable interest for individuals: $353 (reported on 13.6% of returns)
This zip code:
$353
California:
$2,146
(% of AGI for various income ranges: 0.1% for AGIs below $25k, 0.2% for AGIs $25k-50k, 0.1% for AGIs $50k-75k, 0.1% for AGIs $75k-100k, 0.4% for AGIs $100k-200k)
Ordinary dividends: $1,492 (reported on 2.1% of returns)
Here:
$1,492
State:
$9,308
(% of AGI for various income ranges: 0.1% for AGIs below $25k, 0.3% for AGIs $100k-200k)
Net capital gain/loss in AGI: +$1,938 (reported on 1.4% of returns)
Here:
+$1,938
State:
+$30,460
(% of AGI for various income ranges: 1.3% for AGIs $100k-200k)
Profit/loss from business: +$9,908 (reported on 17.2% of returns)
Here:
+$9,908
State:
+$17,064
(% of AGI for various income ranges: 15.7% for AGIs below $25k, 3.5% for AGIs $25k-50k, 1.4% for AGIs $50k-75k, 1.9% for AGIs $75k-100k, 2.3% for AGIs $100k-200k)
Taxable individual retirement arrangement distribution: $8,819 (reported on 1.4% of returns)
94621:
$8,819
California:
$19,557
(% of AGI for various income ranges: 0.2% for AGIs below $25k, 0.4% for AGIs $25k-50k, 0.4% for AGIs $50k-75k, 1.4% for AGIs $75k-100k)
Total itemized deductions: $19,121 (33% of AGI, reported on 16.0% of returns)
Here:
$19,121
State:
$34,004
Here:
32.9% of AGI
State:
22.7% of AGI
(% of AGI for various income ranges: 5.2% for AGIs below $25k, 8.3% for AGIs $25k-50k, 13.6% for AGIs $50k-75k, 15.7% for AGIs $75k-100k, 19.2% for AGIs $100k-200k)
Charity contributions: $3,073 (reported on 11.2% of returns)
Here:
$3,073
State:
$4,659
(% of AGI for various income ranges: 0.3% for AGIs below $25k, 0.8% for AGIs $25k-50k, 1.7% for AGIs $50k-75k, 2.0% for AGIs $75k-100k, 2.7% for AGIs $100k-200k)
Taxes paid: $5,026 (reported on 15.9% of returns)
94621:
$5,026
State:
$14,448
(% of AGI for various income ranges: 1.1% for AGIs below $25k, 1.9% for AGIs $25k-50k, 3.6% for AGIs $50k-75k, 4.6% for AGIs $75k-100k, 6.3% for AGIs $100k-200k)
Earned income credit: $2,658 (reported on 34.7% of returns)
Here:
$2,658
State:
$2,286
(% of AGI for various income ranges: 10.4% for AGIs below $25k, 1.6% for AGIs $25k-50k)
Percentage of individuals using paid preparers for their 2012 taxes: 65.1%
Here:
65%
State:
64%
(% for various income ranges: 62.8% for AGIs below $25k, 67.3% for AGIs $25k-50k, 68.0% for AGIs $50k-75k, 72.2% for AGIs $75k-100k, 70.0% for AGIs $100k-200k)
Averages for the 2004 tax year for zip code 94621, filed in 2005:
Average Adjusted Gross Income (AGI) in 2004: $29,097 (Individual Income Tax Returns)
Here:
$29,097
State:
$58,600
Salary/wage: $28,566 (reported on 88.4% of returns)
Here:
$28,566
State:
$49,455
(% of AGI for various income ranges: 89.5% for AGIs below $10k, 83.3% for AGIs $10k-25k, 90.6% for AGIs $25k-50k, 90.2% for AGIs $50k-75k, 85.8% for AGIs $75k-100k, 58.2% for AGIs over 100k)
Taxable interest for individuals: $486 (reported on 21.8% of returns)
This zip code:
$486
California:
$2,365
(% of AGI for various income ranges: 0.7% for AGIs below $10k, 0.5% for AGIs $10k-25k, 0.2% for AGIs $25k-50k, 0.4% for AGIs $50k-75k, 0.3% for AGIs $75k-100k, 0.7% for AGIs over 100k)
Taxable dividends: $542 (reported on 3.3% of returns)
Here:
$542
State:
$4,746
(% of AGI for various income ranges: 0.4% for AGIs below $10k, 0.1% for AGIs $10k-25k, 0.0% for AGIs $25k-50k, 0.0% for AGIs $50k-75k, 0.0% for AGIs $75k-100k, 0.1% for AGIs over 100k)
Net capital gain/loss: +$6,378 (reported on 2.2% of returns)
Here:
+$6,378
State:
+$23,418
(% of AGI for various income ranges: -0.1% for AGIs below $10k, 0.0% for AGIs $10k-25k, 0.0% for AGIs $25k-50k, 0.0% for AGIs $50k-75k, 1.3% for AGIs $75k-100k, 6.3% for AGIs over 100k)
Profit/loss from business: +$7,704 (reported on 12.0% of returns)
Here:
+$7,704
State:
+$16,826
(% of AGI for various income ranges: 12.1% for AGIs below $10k, 6.2% for AGIs $10k-25k, 2.1% for AGIs $25k-50k, 2.0% for AGIs $50k-75k, 1.6% for AGIs $75k-100k, 2.3% for AGIs over 100k)
IRA payment deduction: $2,391 (reported on 0.7% of returns)
94621:
$2,391
California:
$3,192
Total itemized deductions: $19,184 (39% of AGI, reported on 25.2% of returns)
Here:
$19,184
State:
$28,113
Here:
39.3% of AGI
State:
25.3% of AGI
(% of AGI for various income ranges: 12.3% for AGIs below $10k, 8.9% for AGIs $10k-25k, 16.5% for AGIs $25k-50k, 21.8% for AGIs $50k-75k, 21.1% for AGIs $75k-100k, 20.0% for AGIs over 100k)
Charity contributions deductions: $2,232 (4% of AGI, reported on 19.9% of returns)
Here:
$2,232
State:
$3,923
Here:
4.3% of AGI
State:
3.3% of AGI
(% of AGI for various income ranges: 0.8% for AGIs below $10k, 0.6% for AGIs $10k-25k, 1.3% for AGIs $25k-50k, 2.2% for AGIs $50k-75k, 2.9% for AGIs $75k-100k, 2.2% for AGIs over 100k)
Total tax: $2,843 (reported on 59.2% of returns)
94621:
$2,843
State:
$10,761
(% of AGI for various income ranges: 3.3% for AGIs below $10k, 3.1% for AGIs $10k-25k, 4.5% for AGIs $25k-50k, 6.8% for AGIs $50k-75k, 9.3% for AGIs $75k-100k, 16.7% for AGIs over 100k)
Earned income credit: $1,856 (reported on 26.4% of returns)
Here:
$1,856
State:
$1,763
Percentage of individuals using paid preparers for their 2004 taxes: 72.7%
Here:
73%
State:
66%
(% for various income ranges: 66.3% for AGIs below $10k, 74.7% for AGIs $10k-25k, 74.9% for AGIs $25k-50k, 72.1% for AGIs $50k-75k, 67.8% for AGIs $75k-100k, 70.8% for AGIs over 100k)
Likely homosexual households (counted as self-reported same-sex unmarried-partner households)
Lesbian couples: 0.0% of all households
Gay men: 0.1% of all households
Household received Food Stamps/SNAP in the past 12 months: 2,768 Household did not receive Food Stamps/SNAP in the past 12 months: 7,838
Women who had a birth in the past 12 months: 559 (330 now married, 230 unmarried) Women who did not have a birth in the past 12 months: 8,683 (2,675 now married, 6,040 unmarried)
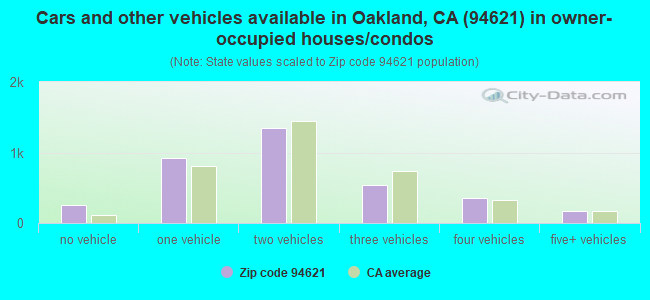
Housing units in zip code 94621 with a mortgage: 2,543 (127 second mortgage, 99 both second mortgage and home equity loan) Houses without a mortgage: 167
Median monthly owner costs for units with a mortgage: $2,247 Median monthly owner costs for units without a mortgage: $684
Residents with income below the poverty level in 2022:
This zip code:
20.0%
Whole state:
12.2%
Residents with income below 50% of the poverty level in 2022:
This zip code:
10.1%
Whole state:
6.2%
Median number of rooms in houses and condos:
Here:
5.1
State:
6.0
Median number of rooms in apartments:
Here:
4.2
State:
3.9
Notable locations in this zip code not listed on our city pages
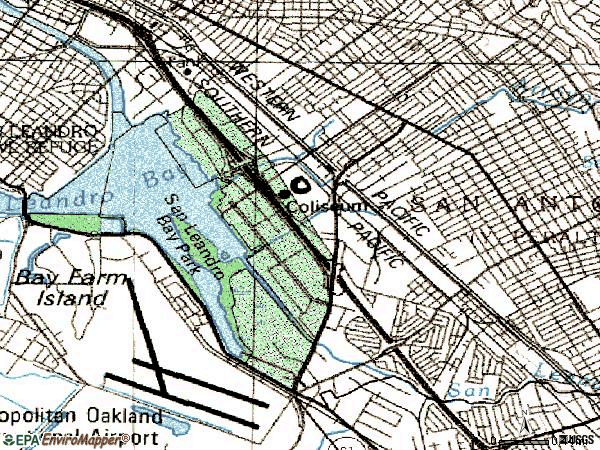
Notable locations in zip code 94621: Airport Marina (A), Oakland Executive Center (B), Overstock.com Coliseum (C), Elmhurst Branch Oakland Public Library (D), Martin Luther King Junior Branch Oakland Public Library (E), East Oakland Boys Club (F), Oakland Fire Department Station 27 (G), Oakland Fire Department Station 29 (H), Oakland Fire Department Station 22 (I), Oracle Arena (J), Saint Anthonys Hall (K). Display/hide their locations on the map
Churches in zip code 94621 include: Golden Gate Primitive Baptist Church (A), Havenscourt Colonial Church (B), Kingdom Hall of Jehovahs Witnesses (C), Saint Bernards Convent (D), Saint Johns Evangelical Lutheran Church (E), Saint Bernards Roman Catholic Church (F), Allen Temple Baptist Church (G), Calvary Temple (H), Calvary Temple Assembly of God Church (I). Display/hide their locations on the map
Parks in zip code 94621 include: The Arena in Oakland (1), Coliseum Gardens (2), Rainbow Recreation Center (3), Eightyeighth Avenue Mini Park (4), Eightyfifth Avenue Mini Park (5), San Leandro Bay Regional Shoreline (6), Tassafaronga Recreation Center (7), Greeman Field (8). Display/hide their locations on the map
4,254 married couples with children.
3,115 single-parent households (614 men, 2,501 women).
40.6% of residents of 94621 zip code speak English at home.
48.7% of residents speak Spanish at home (66% very well, 12% well, 14% not well, 7% not at all).
1.3% of residents speak other Indo-European language at home (71% very well, 29% well).
3.7% of residents speak Asian or Pacific Island language at home (44% very well, 24% well, 24% not well, 8% not at all).
5.1% of residents speak other language at home (58% very well, 15% well, 16% not well, 11% not at all).
Foreign born population: 12,174 (35.2%) (37.9% of them are naturalized citizens)
Major facilities with environmental interests located in this zip code:
HIGH TECH. PACKAGING (860-81ST AVE. in OAKLAND, CA)
STATE MASTER (California - Hazardous Waste Tracking) - HAZARDOU WASTE PROGRAM CRITERIA AND HAZARDOUS AIR POLLUTANT INVENTORY (Inventory of air pollution sources) HAZARDOUS WASTE BIENNIAL REPORTER (Resource Conservation and Recovery Act (tracking hazardous waste)) - ICIS-, ENFORCEMENT/COMPLIANCE ACTIVITY Large Quantity Generators, more that 1000 kg of hazardous waste/month (Resource Conservation and Recovery Act (tracking hazardous waste)) - ICIS-, ENFORCEMENT/COMPLIANCE ACTIVITY TRI REPORTER (Tracking of toxic chemicals releasing facilities) Business SIC classification: CHEMICALS AND ALLIED PRODUCTS Alternative names: ALAMEDA CHEMICAL H T P, ALAMEDA CHEMICAL HTP
NATIONAL AIRMOTIVE CORPORATION (7200 LOCKHEED STREET in OAKLAND, CA)
STATE MASTER (California - Hazardous Waste Tracking) - HAZARDOU WASTE PROGRAM (Integrated Compliance Information System) - ICIS-09-1998-0119, FORMAL ENFORCEMENT ACTION CRITERIA AND HAZARDOUS AIR POLLUTANT INVENTORY (Inventory of air pollution sources) HAZARDOUS WASTE BIENNIAL REPORTER (Resource Conservation and Recovery Act (tracking hazardous waste)) Large Quantity Generators, more that 1000 kg of hazardous waste/month (Resource Conservation and Recovery Act (tracking hazardous waste)) - notification TRI REPORTER (Tracking of toxic chemicals releasing facilities) Business SIC classification: AIRCRAFT ENGINES AND ENGINE PARTS; AIRPORTS, FLYING FIELDS, AND AIRPORT TERMINAL SERVICES; ARMATURE REWINDING SHOPS Organizations: ROLLS-ROYCE ENGINE SERVICE OAKLAND INC (CONTACT/OPERATOR)
, PORT OF OAKLAND (CONTACT/OWNER)
Alternative names: ROLLS ROYCE ENGINE SERVICES OA, ROLLS ROYCE ENGINE SERVICES-OAKLAND
CHEMICAL COMPOUNDING COMPANY (791 66TH AVENUE in OAKLAND, CA)
FORMAL ENFORCEMENT ACTION (Integrated Compliance Information System) - ICIS-09-2004-0426, ENFORCEMENT/COMPLIANCE ACTIVITY COMPLIANCE ACTIVITY (Tracking inspections of insecticide, fungicide, and rodenticide, and toxic substances) CRITERIA AND HAZARDOUS AIR POLLUTANT INVENTORY (Inventory of air pollution sources) HAZARDOUS WASTE BIENNIAL REPORTER (Resource Conservation and Recovery Act (tracking hazardous waste)) Large Quantity Generators, more that 1000 kg of hazardous waste/month (Resource Conservation and Recovery Act (tracking hazardous waste)) Business SIC classification: SOAP AND OTHER DETERGENTS, EXCEPT SPECIALTY CLEANERS Alternative names: CHEMICAL COMPOUNDING & POLYMER CHEMISTS, VULCAN CHEMICAL TECHNOLOGIES
AB&I FOUNDRY (7825 SAN LEANDRO STREET in OAKLAND, CA)
AIR MAJOR (AIRS/AFS) STATE MASTER (California - Hazardous Waste Tracking) - HAZARDOU WASTE PROGRAM COMPLIANCE ACTIVITY (Tracking inspections of insecticide, fungicide, and rodenticide, and toxic substances) CRITERIA AND HAZARDOUS AIR POLLUTANT INVENTORY (Inventory of air pollution sources) HAZARDOUS WASTE BIENNIAL REPORTER (Resource Conservation and Recovery Act (tracking hazardous waste)) Large Quantity Generators, more that 1000 kg of hazardous waste/month (Resource Conservation and Recovery Act (tracking hazardous waste)) TRI REPORTER (Tracking of toxic chemicals releasing facilities) Business SIC classification: GRAY AND DUCTILE IRON FOUNDRIES Business NAICS classification: IRON FOUNDRIES. Organizations: ALLAN BOSCACCI (CONTACT/OWNER)
Alternative names: AMERICAN BRASS & IRON, AMERICAN BRASS & IRON FNDY. INC.
HAVENSCOURT MIDDLE SCHOOL (1390 66TH AVE in OAKLAND, CA)
STATE MASTER (California - Hazardous Waste Tracking) - HAZARDOU WASTE PROGRAM (National Center for Education Statistics) - STATE ID-6065866 Small Quantity Generators, between 100 kg and 1000 kg of hazardous waste/month (Resource Conservation and Recovery Act (tracking hazardous waste)) - notification Organizations: OAKLAND UNIFIED SCHOOL DIST (CONTACT/OWNER)
, OAKLAND UNIFIED (SCHOOL DISTRICT)
ABLE METALS PLATING (932 86TH AVENUE in OAKLAND, CA)
SUPERFUND (Superfund database) STATE MASTER (California - Hazardous Waste Tracking) - HAZARDOU WASTE PROGRAM HAZARDOUS WASTE BIENNIAL REPORTER (Resource Conservation and Recovery Act (tracking hazardous waste)) Large Quantity Generators, more that 1000 kg of hazardous waste/month (Resource Conservation and Recovery Act (tracking hazardous waste)) - notification Organizations: JOSE VAZQUEZ ABLE METAL PLAT (CONTACT/OWNER)
Alternative names: ABLE METAL PLATING, AMERICAN CHROME
METRO FURNITURE (7220 EDGEWATER DR in OAKLAND, CA)
STATE MASTER (California - Hazardous Waste Tracking) - HAZARDOU WASTE PROGRAM Large Quantity Generators, more that 1000 kg of hazardous waste/month (Resource Conservation and Recovery Act (tracking hazardous waste)) Organizations: AMB PROPERTY L.P. (CONTACT/OWNER)
EVERETT GRAPHICS INC (7300 EDGEWATER DRIVE in OAKLAND, CA)
STATE MASTER (California - Hazardous Waste Tracking) - HAZARDOU WASTE PROGRAM CRITERIA AND HAZARDOUS AIR POLLUTANT INVENTORY (Inventory of air pollution sources) AIR MAJOR ("Best Available" air pollution technologies tracking) Small Quantity Generators, between 100 kg and 1000 kg of hazardous waste/month (Resource Conservation and Recovery Act (tracking hazardous waste)) - notification Business SIC classification: COMMERCIAL PRINTING, LITHOGRAPHIC Business NAICS classification: ADMINISTRATIVE MANAGEMENT AND GENERAL MANAGEMENT CONSULTING SERVICES. Organizations: MUNSON W EVERETT (CONTACT/OWNER)
Alternative names: EVERETT GRAPHICS CO.
CHEVRON AIRCRAFT SVC (7799 EARHART RD in OAKLAND, CA)
STATE MASTER (California - Hazardous Waste Tracking) - HAZARDOU WASTE PROGRAM Small Quantity Generators, between 100 kg and 1000 kg of hazardous waste/month (Resource Conservation and Recovery Act (tracking hazardous waste)) - notification Small Quantity Generators, between 100 kg and 1000 kg of hazardous waste/month (Resource Conservation and Recovery Act (tracking hazardous waste)) Organizations: CHEVRON CORP (CONTACT/OWNER)
Alternative names: CHEVRON TEXACO AVIATION SVC, CHEVRON USA INC OAKLAND AP NO FIELD
ARCH CHEMICALS INC (860 81ST AVE STE B in OAKLAND, CA)
STATE MASTER (California - Hazardous Waste Tracking) - HAZARDOU WASTE PROGRAM Large Quantity Generators, more that 1000 kg of hazardous waste/month (Resource Conservation and Recovery Act (tracking hazardous waste)) - notification Organizations: ARCH CHEMICALS, INC. (CONTACT/OWNER)
GOLDEN GATE TRUCK CENTER (8200 BALDWIN ST in OAKLAND, CA)
STATE MASTER (California - Hazardous Waste Tracking) - HAZARDOU WASTE PROGRAM CRITERIA AND HAZARDOUS AIR POLLUTANT INVENTORY (Inventory of air pollution sources) Small Quantity Generators, between 100 kg and 1000 kg of hazardous waste/month (Resource Conservation and Recovery Act (tracking hazardous waste)) Business SIC classification: TOP, BODY, AND UPHOLSTERY REPAIR SHOPS AND PAINT SHOPS
A A D DISPOSAL INC (8460 BALDWIN ST in OAKLAND, CA)
SUPERFUND (Superfund database) (Integrated Compliance Information System) - ICIS-09-2001-0043, FORMAL ENFORCEMENT ACTION TRANSPORTER (Resource Conservation and Recovery Act (tracking hazardous waste)) - notification Business SIC classification: SPECIALTY CLEANING, POLISHING, AND SANITATION PREPARATIONS Organizations: A A D DISPOSAL CO INC (CONTACT/OWNER)
Alternative names: AAD OAKLAND, BALDWIN PROPERTIES
A C TRANSIT DISTRICT (1100 SEMINARY AVE in OAKLAND, CA)
STATE MASTER (California - Hazardous Waste Tracking) - HAZARDOU WASTE PROGRAM CRITERIA AND HAZARDOUS AIR POLLUTANT INVENTORY (Inventory of air pollution sources) Small Quantity Generators, between 100 kg and 1000 kg of hazardous waste/month (Resource Conservation and Recovery Act (tracking hazardous waste)) - notification Business SIC classification: LOCAL AND SUBURBAN TRANSIT Organizations: AC TRANSIT (CONTACT/OWNER)
Alternative names: SEMINARY AVE DIV
Housing units lacking complete plumbing facilities: 0.5% Housing units lacking complete kitchen facilities: 0.7%
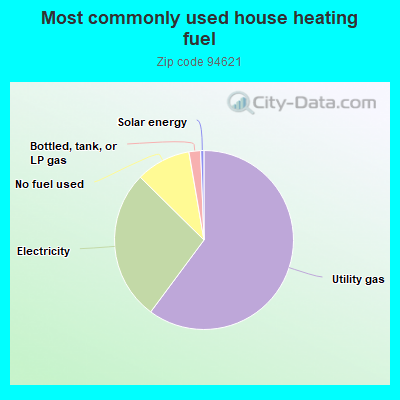
60.1%Utility gas
27.2%Electricity
9.9%No fuel used
2.1%Bottled, tank, or LP gas
0.6%Solar energy
Population in 1990: 26,689. Population change in the 1990s: +4,055 (+15.2%).
Place of birth for U.S.-born residents:
This state: 19,300
Northeast: 147
Midwest: 423
South: 1,481
West: 266
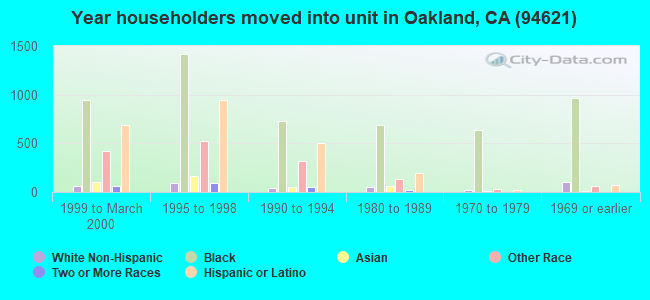
57% of the 94621 zip code residents lived in the same house 5 years ago. Out of people who lived in different houses, 78% lived in this county. Out of people who lived in different counties, 50% lived in California.
91% of the 94621 zip code residents lived in the same house 1 year ago. Out of people who lived in different houses, 67% moved from this county. Out of people who lived in different houses, 17% moved from different county within same state. Out of people who lived in different houses, 4% moved from different state. Out of people who lived in different houses, 12% moved from abroad.
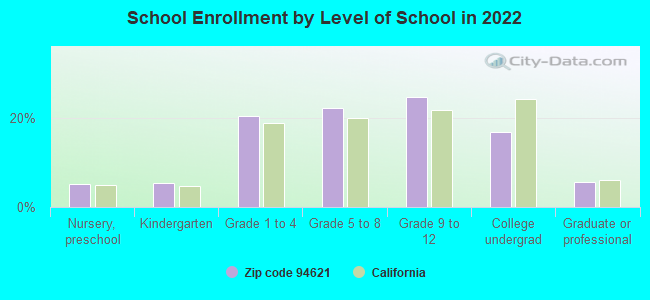
Private vs. public school enrollment:
Students in private schools in grades 1 to 8 (elementary and middle school): 197
Here:
4.8%
California:
10.5%
Students in private schools in grades 9 to 12 (high school): 120
Here:
5.0%
California:
8.5%
Students in private undergraduate colleges: 24
Here:
1.5%
California:
15.9%
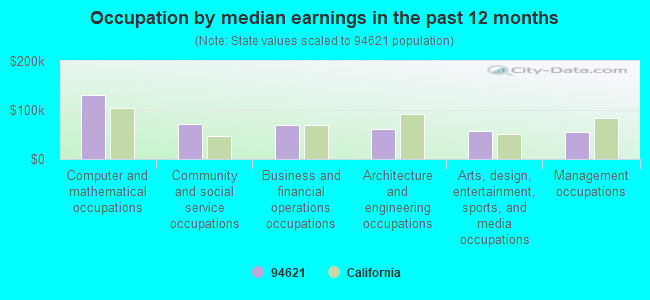
Occupation by median earnings in the past 12 months ($)
131,580Computer and mathematical occupations
70,711Community and social service occupations
68,659Business and financial operations occupations
62,173Architecture and engineering occupations
57,551Arts, design, entertainment, sports, and media occupations
56,111Management occupations
Companies with biggest federal contracts located in this zip code (OAKLAND, CA):
ROLLS-ROYCE ENGINE SERVICES-OA (7200 EARHART RD) : $166,880,328 in 269 contractsfrom 1999 to 2006
Contracts for Maintenance, Repair and Rebuilding of Equipment -- Engines, Turbines, and Components, Miscellaneous Engines and Components, Miscellaneous Aircraft Accessories and Components, Gas Turbines and Jet Engines, Aircraft; Prime Moving, and Components, and moreby Navy, Army, Immigration and Naturalization Service, Department of Defense, and others Signed by year:2000: $22,324,949; 2001: $1,140,671; 2002: $5,656,570; 2003: $38,269,519; 2004: $56,546,216; 2005: $41,928,767; 2006: $105,881.
Biggest contracts:
$11,623,480 with Navy for Maintenance, Repair and Rebuilding of Equipment -- Engines, Turbines, and Components. Signed on 2004-12-28. Completion date: 2007-12-31.
$10,762,280, same as above.Signed on 2005-08-29. Completion date: 2006-12-28.
$9,517,634 with Navy for Miscellaneous Engines and Components. Signed on 2005-08-02. Completion date: 2005-11-01.
$7,981,969, same as above.Signed on 2005-04-29. Completion date: 2005-07-26.
R&M ENVIRONMENTAL AND INFRASTR (7996 CAPWELL DRIVE; small business) : $6,953,362 in 98 contractsfrom 1999 to 2006
Contracts for Architect - Engineer Services (including landscaping, interior layout, and designing), Maintenance, Repair or Alteration of Real Property -- Other Non-Building Facilities, Other Environmental Services, Studies, and Analytical Support, Well Drilling/Exploratory Services, and moreby Navy, U.S. Army Corps of Engineers - civil program financing only, Army, United States Coast Guard (disused code: now 7008), and others Signed by year:2000: $1,680,808; 2001: $409,336; 2002: $2,805,529; 2003: $42,548; 2004: $245,322; 2005: $1,493,782; 2006: $173,037.
Biggest contracts:
$1,680,212 with Navy for Architect - Engineer Services (including landscaping, interior layout, and designing). Signed on 2002-05-23. Completion date: 2003-05-31.
$1,320,904 with U.S. Army Corps of Engineers - civil program financing only for Maintenance, Repair or Alteration of Real Property -- Other Non-Building Facilities. Signed on 2000-09-16. Completion date: 2000-11-29.
$1,118,317 with Navy for Other Environmental Services, Studies, and Analytical Support. Signed on 2002-04-17. Completion date: 2002-08-09.
$542,537 with Army for Well Drilling/Exploratory Services. Signed on 2005-04-08. Completion date: 2005-04-04.
COCA-COLA BOTTLING COMPANY OF (7901 OAKPORT ST) : $3,003,719 in 25 contractsfrom 1999 to 2005
Contracts for Food Items For Resale, Non-Food Items For Resale by Defense Commissary Agency, Department of Defense Signed by year:2000: $202,777; 2001: $271,238; 2002: $500,340; 2003: $147,801; 2004: $635,034; 2005: $1,160,919; 2006: $0.
Biggest contracts:
$531,129 with Defense Commissary Agency for Food Items For Resale. Signed on 2005-04-01. Completion date: 2005-08-31.
$463,459, same as above.Signed on 2004-10-01. Completion date: 2005-02-28.
$275,930 with Defense Commissary Agency for Non-Food Items For Resale. Signed on 2005-10-01. Completion date: 2005-12-31.
$242,581 with Department of Defense for Food Items For Resale. Signed on 2002-01-02. Completion date: 2002-07-31.
US FILTER (6611 SAN LEANDRO ST) : $910,391 in 45 contractsfrom 2001 to 2005
Contracts for Facilities Operations Support Services, Maintenance, Repair and Rebuilding of Equipment -- Miscellaneous, Maintenance, Repair and Rebuilding of Equipment -- Refrigeration, Air Conditioning, and Air Circulating Equipment, Miscellaneous Items, and moreby Navy, Air Force, Department of Veterans Affairs, National Institutes of Health, and others Signed by year:2000: $0; 2001: $51,269; 2002: $191,627; 2003: $108,462; 2004: $141,485; 2005: $417,548; 2006: $0.
Biggest contracts:
$100,000 with Navy for Facilities Operations Support Services. Signed on 2005-03-15. Completion date: 2005-09-30.
$100,000, same as above.Signed on 2005-04-11. Completion date: 2005-09-30.
$96,577 with Air Force for Maintenance, Repair and Rebuilding of Equipment -- Miscellaneous. Taking place in UT. Signed on 2002-09-09. Completion date: 2002-11-09.
$70,971 with Navy for Facilities Operations Support Services. Signed on 2004-12-27. Completion date: 2005-09-30.
PK CONSULTANTS INC (7901 OAKPORT ST STE 3350; small business) : $341,050 in 5 contractsfrom 2004 to 2006
Contracts for Public Relations Services(includes writing services, event planning and management, media relations, radio and television analysis, and press services), Other Professional Services by Army, U.S. Army Corps of Engineers - civil program financing only Signed by year:2000: $0; 2001: $0; 2002: $0; 2003: $0; 2004: $118,868; 2005: $81,132; 2006: $141,050.
Biggest contracts:
$141,050 with Army for Public Relations Services(includes writing services, event planning and management, media relations, radio and television analysis, and press services). Signed on 2006-01-10. Completion date: 2007-01-09.
$59,434 with Army for Other Professional Services. Signed on 2004-01-21. Completion date: 2003-12-04.
$59,434 with U.S. Army Corps of Engineers - civil program financing only for Other Professional Services. Signed on 2004-01-21. Completion date: 2003-12-04.
$40,566 with Army for Other Professional Services. Signed on 2005-02-10. Completion date: 2003-12-04.
R&M /BURLESON, A JOINT VENTURE (7996 CAPWELL DR; small business) : $166,796 in 10 contractsfrom 2004 to 2005
Contracts for Other Architect and Engineering Services by Army, U.S. Army Corps of Engineers - civil program financing only Signed by year:2000: $0; 2001: $0; 2002: $0; 2003: $0; 2004: $40,000; 2005: $126,796; 2006: $0.
Biggest contracts:
$73,398 with Army for Other Architect and Engineering Services. Signed on 2005-06-27. Completion date: 2005-08-29.
$73,398 with U.S. Army Corps of Engineers - civil program financing only for Other Architect and Engineering Services. Signed on 2005-06-27. Completion date: 2005-08-29.
$20,000, same as above.Signed on 2004-07-02. Completion date: 2005-07-01.
$20,000 with Army for Other Architect and Engineering Services. Signed on 2004-07-02. Completion date: 2005-07-01.
VINCENT ELECTRIC COMPANY (8383 BALDWIN ST; small business) : $11,064 in 3 contractsfrom 2005 to 2006
$6,160 with Air Force for Maintenance, Repair and Rebuilding of Equipment -- Electric Wire, and Power and Distribution Equipment. Signed on 2006-02-15. Completion date: 2006-03-03.
$4,610 with U.S. Coast Guard for Non-nuclear Ship Repair (West) Ship repair (including overhauls and conversions) performed on. non-nuclear propelled and nonpropelled ships west of the 108th meridian. Signed on 2006-02-11. Completion date: 2006-02-20.
$294 with U.S. Coast Guard for Miscellaneous Ship and Marine Equipment. Signed on 2005-06-01. Completion date: 2005-07-01.
WEST COAST WIRE ROPE & RIGGING (597 85TH AVE; small business)
$7,640 with Navy for Chain and Wire Rope. Signed on 2005-06-24. Completion date: 2005-07-01.
RIGHT AWAY REDY MIX INC (725 JULIE ANN WAY; small business) : $5,222 in 2 contractsin 2006
$4,853 with Army for Miscellaneous Construction Materials. Signed on 2006-02-24. Completion date: 2006-02-25.
$369, same as above.Signed on 2006-03-06. Completion date: 2006-02-25.
INTERNATIONAL SURFACE PREPARAT (180 HEGENBERGER LOOP A; small business) 750 employees, $0 revenue: $4,561 in 2 contractsin 2005
$5,068 with Navy for Non-nuclear Ship Repair (West) Ship repair (including overhauls and conversions) performed on. non-nuclear propelled and nonpropelled ships west of the 108th meridian. Signed on 2005-08-02. Completion date: 2005-07-29.
-$507, same as above.Signed on 2005-08-30. Completion date: 2005-07-29.
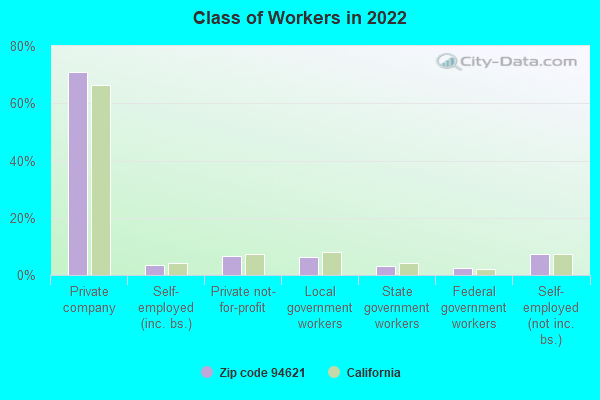
Top industries in this zip code by the number of employees in 2005:
Administrative and Support and Waste Management and Remediation Services: Security Guards and Patrol Services (250-499 employees: 2 establishments, 100-249 employees: 3 establishments, 5-9 employees: 2 establishments, 1-4 employees: 5 establishments)
Educational Services: Fine Arts Schools (500-999: 1)
Arts, Entertainment, and Recreation: Promoters of Performing Arts, Sports, and Similar Events with Facilities (500-999: 1)
Other Services (except Public Administration): Industrial Launderers (500-999: 1)
Accommodation and Food Services: Food Service Contractors (250-499: 1, 100-249: 1, 50-99: 2, 10-19: 1, 1-4: 1)
Accommodation and Food Services: Hotels (except Casino Hotels) and Motels (100-249: 1, 50-99: 2, 20-49: 3, 10-19: 1, 1-4: 1)
Other Services (except Public Administration): Labor Unions and Similar Labor Organizations (100-249: 1, 20-49: 4, 10-19: 4, 5-9: 3, 1-4: 18)
People in group quarters in 2010:
99 people in emergency and transitional shelters (with sleeping facilities) for people experiencing homelessness
88 people in other noninstitutional facilities
63 people in nursing facilities/skilled-nursing facilities
43 people in workers' group living quarters and job corps centers
9 people in group homes for juveniles (non-correctional)
8 people in group homes intended for adults
People in group quarters in 2000:
146 people in other noninstitutional group quarters
92 people in nursing homes
26 people in other group homes
14 people in homes for the mentally ill
10 people in homes or halfway houses for drug/alcohol abuse
6 people in homes for the mentally retarded
2 people in homes for the physically handicapped
Fatal accident statistics in 2014:
Fatal accident count: 3
Vehicles involved in fatal accidents: 5
Fatal accidents caused by drunken drivers: 0
Fatalities: 3
Persons involved in fatal accidents: 5
Pedestrians involved in fatal accidents: 1
Fatal accident statistics in 2013:
Fatal accident count: 1
Vehicles involved in fatal accidents: 2
Fatal accidents caused by drunken drivers: 1
Fatalities: 1
Persons involved in fatal accidents: 2
Pedestrians involved in fatal accidents: 0
Home Mortgage Disclosure Act Aggregated Statistics For Year 2009 (Based on 3 full and 18 partial tracts)
A) FHA, FSA/RHS & VA Home Purchase Loans
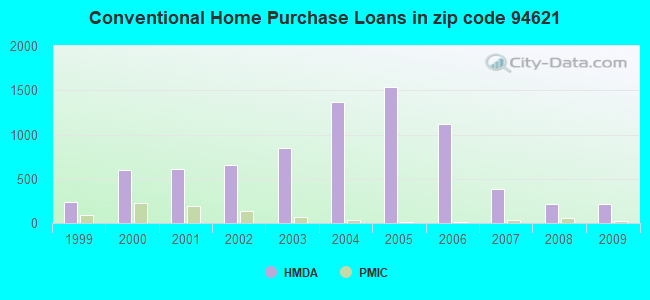
B) Conventional Home Purchase Loans
C) Refinancings
D) Home Improvement Loans
E) Loans on Dwellings For 5+ Families
F) Non-occupant Loans on < 5 Family Dwellings (A B C & D)
G) Loans On Manufactured Home Dwelling (A B C & D)
Number
Average Value
Number
Average Value
Number
Average Value
Number
Average Value
Number
Average Value
Number
Average Value
Number
Average Value
LOANS ORIGINATED
163
$144,359
215
$98,952
74
$149,243
9
$155,794
4
$745,400
121
$95,920
0
$0
APPLICATIONS APPROVED, NOT ACCEPTED
24
$141,702
38
$112,576
20
$173,288
2
$53,795
0
$0
22
$117,956
0
$0
APPLICATIONS DENIED
54
$135,671
146
$105,837
207
$210,063
26
$144,520
1
$314,900
97
$118,167
1
$104,000
APPLICATIONS WITHDRAWN
41
$150,624
51
$109,281
48
$182,226
6
$62,143
0
$0
27
$108,905
0
$0
FILES CLOSED FOR INCOMPLETENESS
9
$120,877
12
$101,202
41
$187,622
7
$118,526
0
$0
6
$91,027
1
$16,000
Aggregated Statistics For Year 2008 (Based on 3 full and 18 partial tracts)
A) FHA, FSA/RHS & VA Home Purchase Loans
B) Conventional Home Purchase Loans
C) Refinancings
D) Home Improvement Loans
E) Loans on Dwellings For 5+ Families
F) Non-occupant Loans on < 5 Family Dwellings (A B C & D)
G) Loans On Manufactured Home Dwelling (A B C & D)
Number
Average Value
Number
Average Value
Number
Average Value
Number
Average Value
Number
Average Value
Number
Average Value
Number
Average Value
LOANS ORIGINATED
74
$183,284
219
$145,436
201
$227,682
36
$174,708
7
$992,230
133
$150,233
0
$0
APPLICATIONS APPROVED, NOT ACCEPTED
18
$219,282
54
$221,792
118
$266,926
15
$245,882
1
$366,600
34
$237,582
0
$0
APPLICATIONS DENIED
35
$248,088
180
$193,901
514
$296,334
105
$185,977
8
$998,408
160
$215,241
5
$229,668
APPLICATIONS WITHDRAWN
16
$199,544
79
$150,696
117
$279,961
16
$217,397
0
$0
53
$204,714
0
$0
FILES CLOSED FOR INCOMPLETENESS
5
$187,690
32
$226,732
72
$282,639
8
$216,062
0
$0
24
$204,816
0
$0
Aggregated Statistics For Year 2007 (Based on 3 full and 18 partial tracts)
A) FHA, FSA/RHS & VA Home Purchase Loans
B) Conventional Home Purchase Loans
C) Refinancings
D) Home Improvement Loans
E) Loans on Dwellings For 5+ Families
F) Non-occupant Loans on < 5 Family Dwellings (A B C & D)
G) Loans On Manufactured Home Dwelling (A B C & D)
Number
Average Value
Number
Average Value
Number
Average Value
Number
Average Value
Number
Average Value
Number
Average Value
Number
Average Value
LOANS ORIGINATED
1
$350,070
379
$273,852
1,245
$302,048
171
$234,615
19
$520,073
344
$292,206
0
$0
APPLICATIONS APPROVED, NOT ACCEPTED
0
$0
162
$292,499
362
$309,816
39
$315,569
2
$2,423,870
75
$302,319
0
$0
APPLICATIONS DENIED
3
$255,567
480
$307,819
1,457
$342,614
256
$205,220
6
$1,382,635
317
$327,512
4
$218,630
APPLICATIONS WITHDRAWN
0
$0
90
$289,542
392
$325,370
34
$280,746
4
$1,340,762
79
$316,891
1
$287,760
FILES CLOSED FOR INCOMPLETENESS
0
$0
54
$317,495
186
$315,259
13
$292,916
0
$0
40
$314,269
0
$0
Aggregated Statistics For Year 2006 (Based on 3 full and 18 partial tracts)
B) Conventional Home Purchase Loans
C) Refinancings
D) Home Improvement Loans
E) Loans on Dwellings For 5+ Families
F) Non-occupant Loans on < 5 Family Dwellings (A B C & D)
G) Loans On Manufactured Home Dwelling (A B C & D)
Number
Average Value
Number
Average Value
Number
Average Value
Number
Average Value
Number
Average Value
Number
Average Value
LOANS ORIGINATED
1,117
$256,484
2,049
$303,188
325
$249,834
14
$2,248,788
466
$315,188
2
$193,885
APPLICATIONS APPROVED, NOT ACCEPTED
364
$266,162
530
$303,259
88
$237,564
2
$102,410
131
$314,243
1
$26,510
APPLICATIONS DENIED
1,095
$273,431
1,520
$326,138
256
$234,042
8
$548,316
346
$342,448
7
$196,583
APPLICATIONS WITHDRAWN
335
$279,991
732
$305,347
67
$236,803
1
$275,000
111
$297,594
0
$0
FILES CLOSED FOR INCOMPLETENESS
84
$263,375
235
$290,700
21
$233,426
1
$471,900
45
$292,992
0
$0
Aggregated Statistics For Year 2005 (Based on 3 full and 18 partial tracts)
A) FHA, FSA/RHS & VA Home Purchase Loans
B) Conventional Home Purchase Loans
C) Refinancings
D) Home Improvement Loans
E) Loans on Dwellings For 5+ Families
F) Non-occupant Loans on < 5 Family Dwellings (A B C & D)
G) Loans On Manufactured Home Dwelling (A B C & D)
Number
Average Value
Number
Average Value
Number
Average Value
Number
Average Value
Number
Average Value
Number
Average Value
Number
Average Value
LOANS ORIGINATED
0
$0
1,537
$235,844
2,335
$270,409
258
$221,761
24
$625,710
597
$277,823
5
$142,280
APPLICATIONS APPROVED, NOT ACCEPTED
0
$0
326
$233,096
490
$277,176
39
$222,252
1
$556,000
157
$275,404
4
$96,710
APPLICATIONS DENIED
2
$175,355
807
$242,856
1,401
$281,968
250
$183,954
7
$982,243
288
$306,876
10
$202,925
APPLICATIONS WITHDRAWN
0
$0
309
$243,298
774
$271,525
92
$212,876
1
$222,220
145
$274,564
2
$402,125
FILES CLOSED FOR INCOMPLETENESS
0
$0
70
$252,486
233
$269,592
12
$197,468
1
$2,932,800
49
$271,461
0
$0
Aggregated Statistics For Year 2004 (Based on 3 full and 18 partial tracts)
A) FHA, FSA/RHS & VA Home Purchase Loans
B) Conventional Home Purchase Loans
C) Refinancings
D) Home Improvement Loans
E) Loans on Dwellings For 5+ Families
F) Non-occupant Loans on < 5 Family Dwellings (A B C & D)
G) Loans On Manufactured Home Dwelling (A B C & D)
Number
Average Value
Number
Average Value
Number
Average Value
Number
Average Value
Number
Average Value
Number
Average Value
Number
Average Value
LOANS ORIGINATED
4
$299,442
1,371
$206,572
2,044
$214,319
194
$187,344
24
$904,648
622
$225,761
4
$202,072
APPLICATIONS APPROVED, NOT ACCEPTED
1
$133,060
272
$236,870
405
$226,765
22
$159,187
2
$360,255
108
$244,594
0
$0
APPLICATIONS DENIED
2
$253,990
759
$217,012
1,365
$230,821
214
$146,283
6
$304,050
332
$243,083
10
$213,323
APPLICATIONS WITHDRAWN
3
$173,883
241
$232,926
534
$227,169
62
$145,375
3
$297,827
131
$260,088
4
$170,292
FILES CLOSED FOR INCOMPLETENESS
0
$0
66
$203,374
190
$232,266
13
$141,538
3
$722,087
40
$224,465
0
$0
Aggregated Statistics For Year 2003 (Based on 3 full and 18 partial tracts)
A) FHA, FSA/RHS & VA Home Purchase Loans
B) Conventional Home Purchase Loans
C) Refinancings
D) Home Improvement Loans
E) Loans on Dwellings For 5+ Families
F) Non-occupant Loans on < 5 Family Dwellings (A B C & D)
Number
Average Value
Number
Average Value
Number
Average Value
Number
Average Value
Number
Average Value
Number
Average Value
LOANS ORIGINATED
20
$210,532
848
$190,721
2,553
$182,124
65
$45,439
19
$598,183
603
$199,193
APPLICATIONS APPROVED, NOT ACCEPTED
1
$156,760
178
$196,502
582
$192,710
16
$39,630
5
$329,410
124
$208,691
APPLICATIONS DENIED
2
$184,980
416
$197,421
1,252
$194,544
118
$44,761
10
$1,049,536
248
$217,135
APPLICATIONS WITHDRAWN
1
$244,930
157
$196,948
1,047
$181,034
16
$79,951
4
$1,222,150
133
$213,905
FILES CLOSED FOR INCOMPLETENESS
2
$150,790
31
$169,807
173
$200,967
5
$69,560
1
$800,000
27
$215,818
Aggregated Statistics For Year 2002 (Based on 3 full and 18 partial tracts)
A) FHA, FSA/RHS & VA Home Purchase Loans
B) Conventional Home Purchase Loans
C) Refinancings
D) Home Improvement Loans
E) Loans on Dwellings For 5+ Families
F) Non-occupant Loans on < 5 Family Dwellings (A B C & D)
Number
Average Value
Number
Average Value
Number
Average Value
Number
Average Value
Number
Average Value
Number
Average Value
LOANS ORIGINATED
38
$204,210
653
$175,315
1,938
$162,343
52
$54,918
31
$648,872
483
$180,765
APPLICATIONS APPROVED, NOT ACCEPTED
6
$112,070
148
$183,726
413
$166,838
19
$48,133
0
$0
90
$179,619
APPLICATIONS DENIED
8
$215,710
323
$169,770
770
$160,513
115
$29,158
13
$848,459
166
$170,804
APPLICATIONS WITHDRAWN
2
$238,525
111
$175,026
785
$163,006
40
$51,772
4
$408,072
74
$188,410
FILES CLOSED FOR INCOMPLETENESS
2
$126,305
40
$180,680
215
$152,945
2
$78,685
2
$617,145
41
$166,543
Aggregated Statistics For Year 2001 (Based on 3 full and 18 partial tracts)
A) FHA, FSA/RHS & VA Home Purchase Loans
B) Conventional Home Purchase Loans
C) Refinancings
D) Home Improvement Loans
E) Loans on Dwellings For 5+ Families
F) Non-occupant Loans on < 5 Family Dwellings (A B C & D)
Number
Average Value
Number
Average Value
Number
Average Value
Number
Average Value
Number
Average Value
Number
Average Value
LOANS ORIGINATED
73
$209,988
606
$149,043
1,486
$139,435
95
$42,315
9
$530,329
351
$149,914
APPLICATIONS APPROVED, NOT ACCEPTED
7
$255,560
104
$148,521
299
$133,749
22
$43,358
2
$156,910
75
$147,493
APPLICATIONS DENIED
9
$185,504
255
$154,908
874
$139,098
161
$25,874
5
$585,938
134
$134,069
APPLICATIONS WITHDRAWN
13
$189,484
114
$156,809
628
$132,243
42
$41,226
1
$193,400
47
$139,569
FILES CLOSED FOR INCOMPLETENESS
3
$197,130
41
$127,079
170
$144,210
6
$27,777
2
$459,635
27
$127,608
Aggregated Statistics For Year 2000 (Based on 3 full and 18 partial tracts)
A) FHA, FSA/RHS & VA Home Purchase Loans
B) Conventional Home Purchase Loans
C) Refinancings
D) Home Improvement Loans
E) Loans on Dwellings For 5+ Families
F) Non-occupant Loans on < 5 Family Dwellings (A B C & D)
Number
Average Value
Number
Average Value
Number
Average Value
Number
Average Value
Number
Average Value
Number
Average Value
LOANS ORIGINATED
107
$152,025
604
$122,288
639
$109,287
71
$25,845
12
$292,162
229
$119,008
APPLICATIONS APPROVED, NOT ACCEPTED
23
$142,668
114
$127,688
156
$111,083
27
$40,666
0
$0
34
$117,639
APPLICATIONS DENIED
24
$149,603
307
$123,330
634
$107,101
128
$33,395
12
$353,349
116
$127,027
APPLICATIONS WITHDRAWN
6
$142,165
113
$125,423
345
$145,519
20
$30,254
4
$605,315
36
$119,729
FILES CLOSED FOR INCOMPLETENESS
3
$117,560
45
$122,901
251
$119,375
4
$16,955
3
$514,423
35
$119,747
Aggregated Statistics For Year 1999 (Based on 3 full and 8 partial tracts)
A) FHA, FSA/RHS & VA Home Purchase Loans
B) Conventional Home Purchase Loans
C) Refinancings
D) Home Improvement Loans
E) Loans on Dwellings For 5+ Families
F) Non-occupant Loans on < 5 Family Dwellings (A B C & D)
2005 - 2018 National Fire Incident Reporting System (NFIRS) incidents
According to the data from the years 2005 - 2018 the average number of fire incidents per year is 92. The highest number of reported fire incidents - 253 took place in 2018, and the least - 0 in 2010. The data has an increasing trend.
When looking into fire subcategories, the most reports belonged to: Outside Fires (39.8%), and Mobile Property/Vehicle Fires (39.0%).
Fire incident types reported to NFIRS in Zip Code 94621


 Nearest zip codes: 94601, 94502, 94603, 94613, 94606, 94602.


 According to the data from the years 2005 - 2018 the average number of fire incidents per year is 92. The highest number of reported fire incidents - 253 took place in 2018, and the least - 0 in 2010. The data has an increasing trend.
 When looking into fire subcategories, the most reports belonged to: Outside Fires (39.8%), and Mobile Property/Vehicle Fires (39.0%).