Estimated zip code population in 2022: 12,491 Zip code population in 2010: 11,710 Zip code population in 2000: 11,880
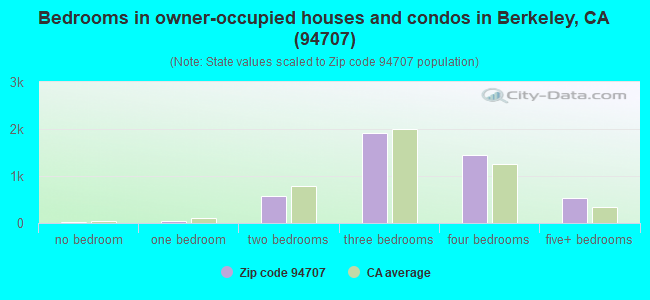
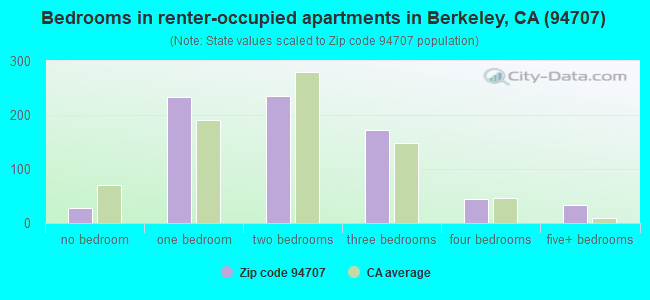
Houses and condos: 5,441 Renter-occupied apartments: 746
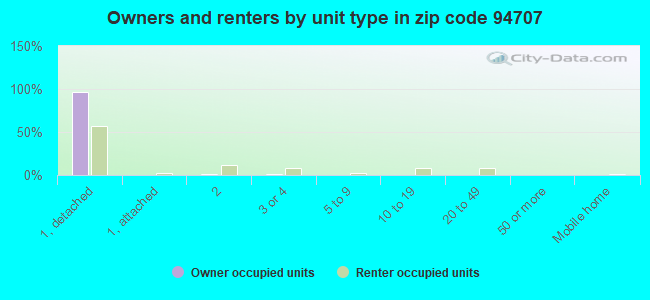
% of renters here:
14%
State:
44%
March 2022 cost of living index in zip code 94707: 119.9 (more than average, U.S. average is 100)
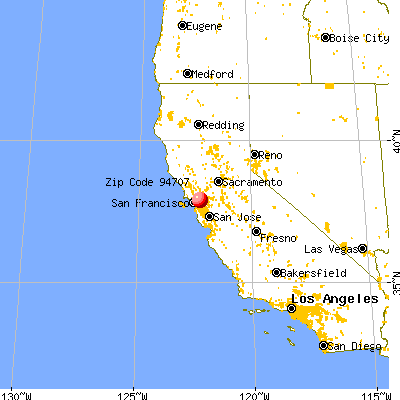
Land area: 1.7 sq. mi. Water area: 0.0 sq. mi.
Population density: 7,368 people per square mile
(high).
OSM Map
General Map
Google Map
MSN Map
OSM Map
General Map
Google Map
MSN Map
OSM Map
General Map
Google Map
MSN Map
OSM Map
General Map
Google Map
MSN Map
Please wait while loading the map...
Real estate property taxes paid for housing units in 2022:
This zip code:
0.6% ($10,292)
California:
0.7% ($4,831)
Median real estate property taxes paid for housing units with mortgages in 2022: $10,330 (0.6%) Median real estate property taxes paid for housing units with no mortgage in 2022: $7,179 (0.5%)
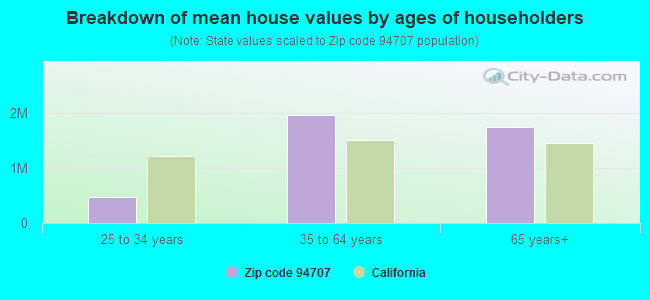
Estimated median house/condo value in 2022: $1,689,146
94707:
$1,689,146
California:
$715,900
According to our research of California and other state lists, there were 5 registered sex offenders living in 94707 zip code as of May 28, 2024. The ratio of all residents to sex offenders in zip code 94707 is 2,469 to 1. The ratio of registered sex offenders to all residents in this zip code is much lower than the state average.
Median resident age:
This zip code:
54.6 years
California median age:
37.9 years
Average household size:
This zip code:
2.4 people
California:
2.8 people
Averages for the 2020 tax year for zip code 94707, filed in 2021:
Average Adjusted Gross Income (AGI) in 2020: $267,891 (Individual Income Tax Returns)
Here:
$267,891
State:
$95,910
Salary/wage: $186,492 (reported on 65.6% of returns)
Here:
$186,492
State:
$77,331
(% of AGI for various income ranges: 1107.2% for AGIs below $25k, 3531.7% for AGIs $25k-50k, 6567.8% for AGIs $50k-75k, 8542.4% for AGIs $75k-100k, 16163.6% for AGIs $100k-200k, 125312.0% for AGIs over 200k)
Taxable interest for individuals: $6,462 (reported on 66.4% of returns)
This zip code:
$6,462
California:
$2,294
(% of AGI for various income ranges: 57.4% for AGIs below $25k, 107.9% for AGIs $25k-50k, 152.5% for AGIs $50k-75k, 256.0% for AGIs $75k-100k, 552.6% for AGIs $100k-200k, 4465.6% for AGIs over 200k)
Ordinary dividends: $25,019 (reported on 61.5% of returns)
Here:
$25,019
State:
$10,949
(% of AGI for various income ranges: 196.1% for AGIs below $25k, 386.0% for AGIs $25k-50k, 782.2% for AGIs $50k-75k, 1110.0% for AGIs $75k-100k, 2525.3% for AGIs $100k-200k, 15226.7% for AGIs over 200k)
Net capital gain/loss in AGI: +$82,271 (reported on 58.1% of returns)
Here:
+$82,271
State:
+$49,306
(% of AGI for various income ranges: 111.7% for AGIs below $25k, 341.7% for AGIs $25k-50k, 616.6% for AGIs $50k-75k, 806.8% for AGIs $75k-100k, 2366.4% for AGIs $100k-200k, 56673.9% for AGIs over 200k)
Profit/loss from business: +$39,010 (reported on 28.2% of returns)
Here:
+$39,010
State:
+$15,671
(% of AGI for various income ranges: 282.8% for AGIs below $25k, 650.5% for AGIs $25k-50k, 915.0% for AGIs $50k-75k, 1454.0% for AGIs $75k-100k, 2812.2% for AGIs $100k-200k, 8845.7% for AGIs over 200k)
Taxable individual retirement arrangement distribution: $33,328 (reported on 18.6% of returns)
94707:
$33,328
California:
$23,505
(% of AGI for various income ranges: 106.9% for AGIs below $25k, 312.4% for AGIs $25k-50k, 618.4% for AGIs $50k-75k, 970.0% for AGIs $75k-100k, 2293.8% for AGIs $100k-200k, 4209.1% for AGIs over 200k)
Self-employed (Keogh) retirement plans: $32,229 (reported on 6.2% of returns)
94707:
$32,229
California:
$30,163
(% of AGI for various income ranges: 110.7% for AGIs $25k-50k, 146.4% for AGIs $75k-100k, 409.0% for AGIs $100k-200k, 1913.5% for AGIs over 200k)
Total itemized deductions: $70,736 (reported on 35.2% of returns)
Here:
$70,736
State:
$39,517
(% of AGI for various income ranges: 358.5% for AGIs below $25k, 764.5% for AGIs $25k-50k, 1617.5% for AGIs $50k-75k, 2040.0% for AGIs $75k-100k, 3747.4% for AGIs $100k-200k, 24557.0% for AGIs over 200k)
Charity contributions: $26,382 (reported on 30.5% of returns)
Here:
$26,382
State:
$12,598
(% of AGI for various income ranges: 17.4% for AGIs below $25k, 49.8% for AGIs $25k-50k, 173.1% for AGIs $50k-75k, 289.6% for AGIs $75k-100k, 580.3% for AGIs $100k-200k, 9245.7% for AGIs over 200k)
Taxes paid: $9,418 (reported on 35.2% of returns)
94707:
$9,418
State:
$8,807
(% of AGI for various income ranges: 75.7% for AGIs below $25k, 179.3% for AGIs $25k-50k, 311.2% for AGIs $50k-75k, 518.8% for AGIs $75k-100k, 987.6% for AGIs $100k-200k, 2485.2% for AGIs over 200k)
Earned income credit: $832 (reported on 2.8% of returns)
Here:
$832
State:
$2,074
(% of AGI for various income ranges: 19.8% for AGIs below $25k, 12.1% for AGIs $25k-50k)
Percentage of individuals using paid preparers for their 2020 taxes: 91.3%
Here:
91%
State:
92%
(% for various income ranges: 86.7% for AGIs below $25k, 90.5% for AGIs $25k-50k, 90.8% for AGIs $50k-75k, 88.9% for AGIs $75k-100k, 92.1% for AGIs $100k-200k, 94.2% for AGIs over 200k)
Averages for the 2012 tax year for zip code 94707, filed in 2013:
Average Adjusted Gross Income (AGI) in 2012: $216,170 (Individual Income Tax Returns)
Here:
$216,170
State:
$72,726
Salary/wage: $113,527 (reported on 67.7% of returns)
Here:
$113,527
State:
$59,079
(% of AGI for various income ranges: 58.2% for AGIs below $25k, 55.8% for AGIs $25k-50k, 49.5% for AGIs $50k-75k, 49.2% for AGIs $75k-100k, 53.4% for AGIs $100k-200k, 29.5% for AGIs over 200k)
Taxable interest for individuals: $4,672 (reported on 65.4% of returns)
This zip code:
$4,672
California:
$2,146
(% of AGI for various income ranges: 3.4% for AGIs below $25k, 2.4% for AGIs $25k-50k, 2.2% for AGIs $50k-75k, 2.1% for AGIs $75k-100k, 1.4% for AGIs $100k-200k, 1.3% for AGIs over 200k)
Ordinary dividends: $19,057 (reported on 56.3% of returns)
Here:
$19,057
State:
$9,308
(% of AGI for various income ranges: 10.5% for AGIs below $25k, 6.2% for AGIs $25k-50k, 6.2% for AGIs $50k-75k, 6.1% for AGIs $75k-100k, 5.0% for AGIs $100k-200k, 4.7% for AGIs over 200k)
Net capital gain/loss in AGI: +$54,817 (reported on 52.0% of returns)
Here:
+$54,817
State:
+$30,460
(% of AGI for various income ranges: 1.9% for AGIs below $25k, 1.5% for AGIs $25k-50k, 2.2% for AGIs $50k-75k, 2.5% for AGIs $75k-100k, 2.6% for AGIs $100k-200k, 17.0% for AGIs over 200k)
Profit/loss from business: +$36,871 (reported on 30.6% of returns)
Here:
+$36,871
State:
+$17,064
(% of AGI for various income ranges: 17.2% for AGIs below $25k, 11.7% for AGIs $25k-50k, 11.3% for AGIs $50k-75k, 8.7% for AGIs $75k-100k, 8.7% for AGIs $100k-200k, 3.7% for AGIs over 200k)
Taxable individual retirement arrangement distribution: $28,885 (reported on 20.9% of returns)
94707:
$28,885
California:
$19,557
(% of AGI for various income ranges: 7.3% for AGIs below $25k, 4.3% for AGIs $25k-50k, 4.3% for AGIs $50k-75k, 5.7% for AGIs $75k-100k, 4.7% for AGIs $100k-200k, 2.1% for AGIs over 200k)
Self-employment retirement plans: $24,779 (reported on 7.6% of returns)
94707:
$24,779
California:
$24,530
(% of AGI for various income ranges: 0.9% for AGIs $25k-50k, 1.0% for AGIs $50k-75k, 0.9% for AGIs $75k-100k, 1.3% for AGIs $100k-200k, 0.8% for AGIs over 200k)
Total itemized deductions: $71,471 (23% of AGI, reported on 63.9% of returns)
Here:
$71,471
State:
$34,004
Here:
22.6% of AGI
State:
22.7% of AGI
(% of AGI for various income ranges: 33.0% for AGIs below $25k, 22.2% for AGIs $25k-50k, 22.4% for AGIs $50k-75k, 22.3% for AGIs $75k-100k, 25.4% for AGIs $100k-200k, 19.9% for AGIs over 200k)
Charity contributions: $20,964 (reported on 55.6% of returns)
Here:
$20,964
State:
$4,659
(% of AGI for various income ranges: 1.1% for AGIs below $25k, 1.4% for AGIs $25k-50k, 1.9% for AGIs $50k-75k, 2.1% for AGIs $75k-100k, 2.0% for AGIs $100k-200k, 6.6% for AGIs over 200k)
Taxes paid: $33,778 (reported on 63.7% of returns)
94707:
$33,778
State:
$14,448
(% of AGI for various income ranges: 7.1% for AGIs below $25k, 6.0% for AGIs $25k-50k, 7.4% for AGIs $50k-75k, 8.1% for AGIs $75k-100k, 9.6% for AGIs $100k-200k, 10.4% for AGIs over 200k)
Earned income credit: $1,038 (reported on 3.8% of returns)
Here:
$1,038
State:
$2,286
(% of AGI for various income ranges: 1.5% for AGIs below $25k, 0.1% for AGIs $25k-50k)
Percentage of individuals using paid preparers for their 2012 taxes: 59.4%
Here:
59%
State:
64%
(% for various income ranges: 47.6% for AGIs below $25k, 50.0% for AGIs $25k-50k, 60.8% for AGIs $50k-75k, 60.6% for AGIs $75k-100k, 63.6% for AGIs $100k-200k, 70.7% for AGIs over 200k)
Averages for the 2004 tax year for zip code 94707, filed in 2005:
Average Adjusted Gross Income (AGI) in 2004: $121,542 (Individual Income Tax Returns)
Here:
$121,542
State:
$58,600
Salary/wage: $88,699 (reported on 68.0% of returns)
Here:
$88,699
State:
$49,455
(% of AGI for various income ranges: 55.6% for AGIs $10k-25k, 53.2% for AGIs $25k-50k, 56.3% for AGIs $50k-75k, 54.9% for AGIs $75k-100k, 47.7% for AGIs over 100k)
Taxable interest for individuals: $3,923 (reported on 73.6% of returns)
This zip code:
$3,923
California:
$2,365
(% of AGI for various income ranges: 6.2% for AGIs $10k-25k, 4.1% for AGIs $25k-50k, 2.9% for AGIs $50k-75k, 2.5% for AGIs $75k-100k, 2.1% for AGIs over 100k)
Taxable dividends: $11,261 (reported on 61.8% of returns)
Here:
$11,261
State:
$4,746
(% of AGI for various income ranges: 7.9% for AGIs $10k-25k, 6.8% for AGIs $25k-50k, 4.5% for AGIs $50k-75k, 5.7% for AGIs $75k-100k, 5.5% for AGIs over 100k)
Net capital gain/loss: +$27,388 (reported on 53.8% of returns)
Here:
+$27,388
State:
+$23,418
(% of AGI for various income ranges: 3.1% for AGIs $10k-25k, 3.3% for AGIs $25k-50k, 3.0% for AGIs $50k-75k, 3.1% for AGIs $75k-100k, 14.3% for AGIs over 100k)
Profit/loss from business: +$33,782 (reported on 31.1% of returns)
Here:
+$33,782
State:
+$16,826
(% of AGI for various income ranges: 15.0% for AGIs $10k-25k, 14.5% for AGIs $25k-50k, 11.3% for AGIs $50k-75k, 10.4% for AGIs $75k-100k, 7.8% for AGIs over 100k)
IRA payment deduction: $3,448 (reported on 4.5% of returns)
94707:
$3,448
California:
$3,192
(% of AGI for various income ranges: 0.6% for AGIs $10k-25k, 0.6% for AGIs $25k-50k, 0.4% for AGIs $50k-75k, 0.1% for AGIs $75k-100k, 0.1% for AGIs over 100k)
Self-employed pension: $19,707 (reported on 9.1% of returns)
Here:
$19,707
California:
$17,688
(% of AGI for various income ranges: 0.6% for AGIs $10k-25k, 1.4% for AGIs $25k-50k, 1.5% for AGIs $50k-75k, 1.4% for AGIs $75k-100k, 1.5% for AGIs over 100k)
Total itemized deductions: $37,790 (21% of AGI, reported on 59.9% of returns)
Here:
$37,790
State:
$28,113
Here:
20.6% of AGI
State:
25.3% of AGI
(% of AGI for various income ranges: 29.1% for AGIs $10k-25k, 21.5% for AGIs $25k-50k, 22.7% for AGIs $50k-75k, 23.6% for AGIs $75k-100k, 17.2% for AGIs over 100k)
Charity contributions deductions: $6,863 (4% of AGI, reported on 54.5% of returns)
Here:
$6,863
State:
$3,923
Here:
3.5% of AGI
State:
3.3% of AGI
(% of AGI for various income ranges: 2.0% for AGIs $10k-25k, 2.1% for AGIs $25k-50k, 2.2% for AGIs $50k-75k, 2.6% for AGIs $75k-100k, 3.3% for AGIs over 100k)
Total tax: $25,893 (reported on 86.4% of returns)
94707:
$25,893
State:
$10,761
(% of AGI for various income ranges: 6.3% for AGIs $10k-25k, 9.9% for AGIs $25k-50k, 11.4% for AGIs $50k-75k, 11.9% for AGIs $75k-100k, 20.1% for AGIs over 100k)
Earned income credit: $755 (reported on 3.0% of returns)
Here:
$755
State:
$1,763
Percentage of individuals using paid preparers for their 2004 taxes: 60.1%
Here:
60%
State:
66%
(% for various income ranges: 52.5% for AGIs below $10k, 49.3% for AGIs $10k-25k, 56.0% for AGIs $25k-50k, 61.3% for AGIs $50k-75k, 61.4% for AGIs $75k-100k, 68.2% for AGIs over 100k)
Likely homosexual households (counted as self-reported same-sex unmarried-partner households)
Lesbian couples: 0.1% of all households
Gay men: 0.7% of all households
Household received Food Stamps/SNAP in the past 12 months: 69 Household did not receive Food Stamps/SNAP in the past 12 months: 5,069
Women who had a birth in the past 12 months: 69 (69 now married, 0 unmarried) Women who did not have a birth in the past 12 months: 1,674 (962 now married, 699 unmarried)
Housing units in zip code 94707 with a mortgage: 2,807 (437 second mortgage, 13 home equity loan, 366 both second mortgage and home equity loan) Houses without a mortgage: 154
Median monthly owner costs for units with a mortgage: $3,876 Median monthly owner costs for units without a mortgage: $1,154
Residents with income below the poverty level in 2022:
This zip code:
3.8%
Whole state:
12.2%
Residents with income below 50% of the poverty level in 2022:
This zip code:
2.0%
Whole state:
6.2%
Median number of rooms in houses and condos:
Here:
7.4
State:
6.0
Median number of rooms in apartments:
Here:
4.5
State:
3.9
Notable locations in this zip code not listed on our city pages
Notable locations in zip code 94707: The Circle (A), Summit Booster Station El Cerrito Pumping Plant (B), Kensington Branch Contra Costa County Library (C), North Branch Berkeley Public Library (D), Berkeley Fire Department Station 4 (E), Kensington Fire Protection District (F), Thousand Oaks Masonic Temple (G), Oaks Theatre (H). Display/hide their locations on the map
Churches in zip code 94707 include: Reorganized Church of Jesus Christ of Latter Day Saints (A), Northbrae Community Church (B), Epworth United Methodist Church (C), Thousand Oaks Baptist Church (D). Display/hide their locations on the map
Parks in zip code 94707 include: Grotto Rock Park (1), Michigan Park (2), Mortar Rock Park (3), Great Stone Face Park (4), Indian Rock Park (5), John Hinkel Park (6). Display/hide their locations on the map
1,754 married couples with children.
360 single-parent households (80 men, 280 women).
78.6% of residents of 94707 zip code speak English at home.
4.5% of residents speak Spanish at home (81% very well, 8% well, 10% not well).
10.9% of residents speak other Indo-European language at home (97% very well, 3% well).
6.7% of residents speak Asian or Pacific Island language at home (78% very well, 18% well, 3% not well, 1% not at all).
0.4% of residents speak other language at home (100% very well).
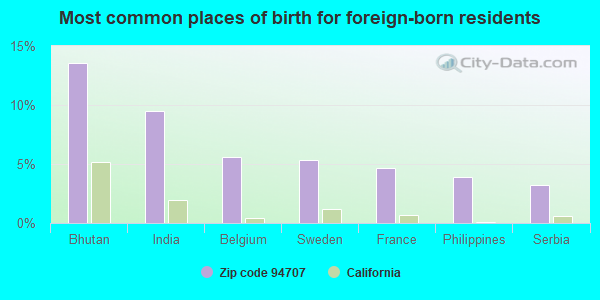
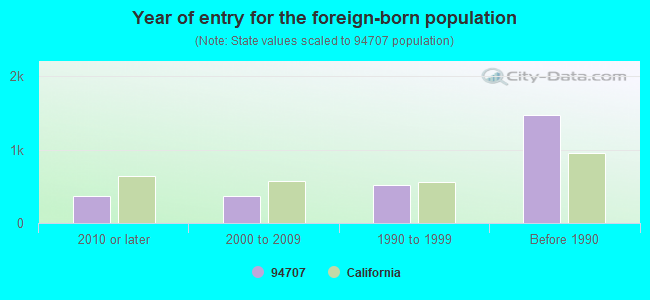
Foreign born population: 2,529 (20.3%) (77.3% of them are naturalized citizens)
Facilities with environmental interests located in this zip code:
CHEVRON USA INC SERV STA #1229 (1820 SOLANO in BERKELEY, CA)
(Resource Conservation and Recovery Act (tracking hazardous waste))
MIRIAM NG AND KORMAN NG (2025 ROSE ST in BERKELEY, CA)
COMPLIANCE ACTIVITY (Tracking inspections of insecticide, fungicide, and rodenticide, and toxic substances) Alternative names: KORMAN AND NG
J. B. JONES AND J. SCHLIESSER (1511 VALLEY RD in KENSINGTON, CA)
COMPLIANCE ACTIVITY (Tracking inspections of insecticide, fungicide, and rodenticide, and toxic substances)
MERIT CLEANERS (1779 SOLANO AVENUE in BERKELEY, CA)
CRITERIA AND HAZARDOUS AIR POLLUTANT INVENTORY (Inventory of air pollution sources) Business SIC classification: DRYCLEANING PLANTS, EXCEPT RUG CLEANING
Housing units lacking complete plumbing facilities: 0.7% Housing units lacking complete kitchen facilities: 0.7%
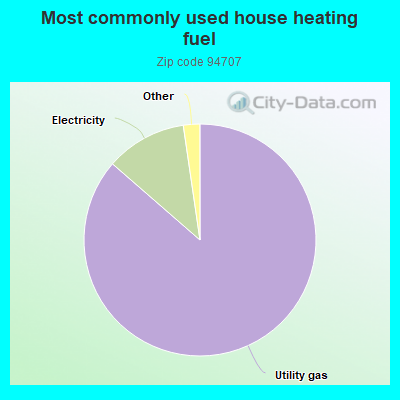
86.4%Utility gas
11.3%Electricity
0.9%No fuel used
0.6%Solar energy
Population in 1990: 9,152. Population change in the 1990s: +2,728 (+29.8%).
Place of birth for U.S.-born residents:
This state: 5,743
Northeast: 1,435
Midwest: 1,101
South: 850
West: 502
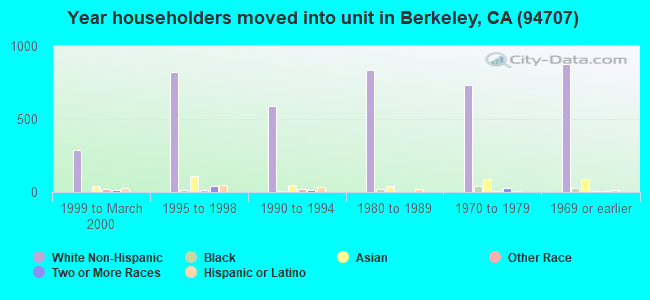
70% of the 94707 zip code residents lived in the same house 5 years ago. Out of people who lived in different houses, 46% lived in this county. Out of people who lived in different counties, 50% lived in California.
92% of the 94707 zip code residents lived in the same house 1 year ago. Out of people who lived in different houses, 34% moved from this county. Out of people who lived in different houses, 48% moved from different county within same state. Out of people who lived in different houses, 13% moved from different state. Out of people who lived in different houses, 8% moved from abroad.
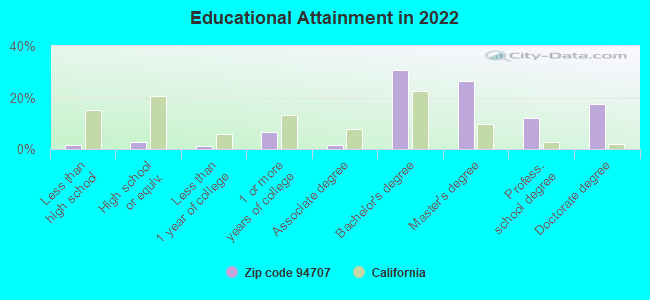
Private vs. public school enrollment:
Students in private schools in grades 1 to 8 (elementary and middle school): 358
Here:
33.8%
California:
10.5%
Students in private schools in grades 9 to 12 (high school): 57
Here:
11.8%
California:
8.5%
Students in private undergraduate colleges: 17
Here:
6.5%
California:
15.9%
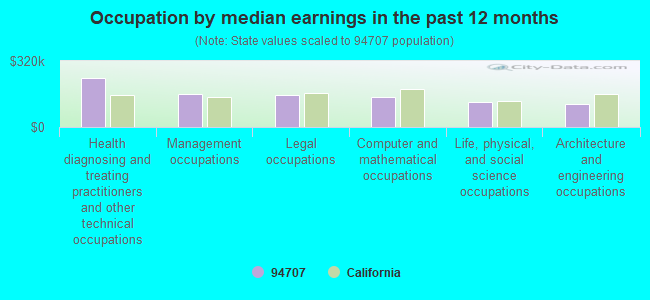
Occupation by median earnings in the past 12 months ($)
238,237Health diagnosing and treating practitioners and other technical occupations
159,594Management occupations
155,168Legal occupations
146,980Computer and mathematical occupations
123,472Life, physical, and social science occupations
113,424Architecture and engineering occupations
Companies with federal contracts located in this zip code:
THOMAS CLARK (175 ARDMORE RD in BERKELEY, CA; small business) : $34,226 in 5 contractsin 2005
Contracts for Other Professional Services by Army, U.S. Army Corps of Engineers - civil program financing only Signed by year:2000: $0; 2001: $0; 2002: $0; 2003: $0; 2004: $0; 2005: $34,226; 2006: $0.
Biggest contracts:
$12,000 with Army for Other Professional Services. Signed on 2005-11-07. Completion date: 2007-05-31.
$8,000 with U.S. Army Corps of Engineers - civil program financing only for Other Professional Services. Taking place in AL. Signed on 2005-05-24. Completion date: 2005-06-02.
$8,000 with Army for Other Professional Services. Taking place in AL. Signed on 2005-05-24. Completion date: 2005-06-02.
$3,113 with U.S. Army Corps of Engineers - civil program financing only for Other Professional Services. Taking place in AL. Signed on 2005-05-24. Completion date: 2005-06-02.
CAROL KINSEY GOMAN (711 ARLINGTON AVE in BERKELEY, CA; small business) : $14,000 in 3 contractsfrom 2004 to 2005
$8,000 with Army for Lectures For Training. Taking place in MI. Signed on 2005-06-13. Completion date: 2005-06-27.
$3,000 with Department of Defense for Lectures For Training. Signed on 2004-03-03. Completion date: 2004-03-05.
$3,000, same as above.Signed on 2004-03-03. Completion date: 2004-03-05.
PETER S MCNELL (705 ALAMEDA ST in BERKELEY, CA; small business)
-$25,000 with Internal Revenue Service for Expert Witness. Signed on 2000-03-15. Completion date: 1999-12-15.
Top industries in this zip code by the number of employees in 2005:
2005 - 2018 National Fire Incident Reporting System (NFIRS) incidents
Based on the data from the years 2005 - 2018 the average number of fire incidents per year is 9. The highest number of fire incidents - 24 took place in 2005, and the least - 4 in 2013. The data has a declining trend.
When looking into fire subcategories, the most reports belonged to: Structure Fires (58.1%), and Outside Fires (25.0%).
Fire incident types reported to NFIRS in Zip Code 94707


 Nearest zip codes: 94708, 94706, 94709, 94530, 94702, 94720.


 Based on the data from the years 2005 - 2018 the average number of fire incidents per year is 9. The highest number of fire incidents - 24 took place in 2005, and the least - 4 in 2013. The data has a declining trend.
 When looking into fire subcategories, the most reports belonged to: Structure Fires (58.1%), and Outside Fires (25.0%).