Estimated zip code population in 2022: 899 Zip code population in 2010: 834 Zip code population in 2000: 850
Houses and condos: 325 Renter-occupied apartments: 151
% of renters here:
54%
State:
44%
March 2022 cost of living index in zip code 95017: 115.2 (more than average, U.S. average is 100)
Land area: 50.0 sq. mi. Water area: 2.7 sq. mi.
Population density: 18 people per square mile
(very low).
OSM Map
General Map
Google Map
MSN Map
OSM Map
General Map
Google Map
MSN Map
OSM Map
General Map
Google Map
MSN Map
OSM Map
General Map
Google Map
MSN Map
Please wait while loading the map...
Real estate property taxes paid for housing units in 2022:
This zip code:
0.6% ($6,485)
California:
0.7% ($4,831)
Median real estate property taxes paid for housing units with mortgages in 2022: $9,791 (0.9%) Median real estate property taxes paid for housing units with no mortgage in 2022: $2,994 (0.3%)
Business Search- 14 Million verified businesses
Males: 454
(50.6%)
Females: 444
(49.4%)
For population 25 years and over in 95017:
High school or higher: 82.5%
Bachelor's degree or higher: 36.5%
Graduate or professional degree: 11.9%
Unemployed: 5.5%
Mean travel time to work (commute): 21.1 minutes
For population 15 years and over in 95017:
Never married: 41.9%
Now married: 49.6%
Separated: 1.1%
Widowed: 3.0%
Divorced: 4.5%
Zip code 95017 compared to state average:
Median house value above state average.
Black race population percentage significantly below state average.
Length of stay since moving in significantly above state average.
Estimated median house/condo value in 2022: $1,117,121
95017:
$1,117,121
California:
$715,900
Median resident age:
This zip code:
38.8 years
California median age:
37.9 years
Average household size:
This zip code:
3.0 people
California:
2.8 people
Averages for the 2020 tax year for zip code 95017, filed in 2021:
Average Adjusted Gross Income (AGI) in 2020: $86,074 (Individual Income Tax Returns)
Here:
$86,074
State:
$95,910
Salary/wage: $67,465 (reported on 74.3% of returns)
Here:
$67,465
State:
$77,331
(% of AGI for various income ranges: 1487.5% for AGIs below $25k, 7253.3% for AGIs $25k-50k, 7925.0% for AGIs $50k-75k, 11075.0% for AGIs $75k-100k, 15190.0% for AGIs $100k-200k)
Taxable interest for individuals: $2,079 (reported on 40.0% of returns)
This zip code:
$2,079
California:
$2,294
(% of AGI for various income ranges: 17.5% for AGIs below $25k, 110.0% for AGIs $25k-50k, 65.0% for AGIs $50k-75k, 120.0% for AGIs $100k-200k)
Ordinary dividends: $20,550 (reported on 22.9% of returns)
Here:
$20,550
State:
$10,949
(% of AGI for various income ranges: 473.3% for AGIs $25k-50k, 1086.7% for AGIs $100k-200k)
Net capital gain/loss in AGI: +$29,762 (reported on 22.9% of returns)
Here:
+$29,762
State:
+$49,306
(% of AGI for various income ranges: 450.0% for AGIs $25k-50k, 643.3% for AGIs $100k-200k)
Profit/loss from business: +$9,550 (reported on 17.1% of returns)
Here:
+$9,550
State:
+$15,671
(% of AGI for various income ranges: 620.0% for AGIs below $25k, 473.3% for AGIs $25k-50k, 610.0% for AGIs $100k-200k)
Total itemized deductions: $42,233 (reported on 17.1% of returns)
Here:
$42,233
State:
$39,517
(% of AGI for various income ranges: 2797.5% for AGIs $50k-75k, 4716.7% for AGIs $100k-200k)
Charity contributions: $3,067 (reported on 8.6% of returns)
Here:
$3,067
State:
$12,598
(% of AGI for various income ranges: 306.7% for AGIs $100k-200k)
Taxes paid: $8,500 (reported on 14.3% of returns)
95017:
$8,500
State:
$8,807
(% of AGI for various income ranges: 1416.7% for AGIs $100k-200k)
Earned income credit: $1,150 (reported on 11.4% of returns)
Here:
$1,150
State:
$2,074
(% of AGI for various income ranges: 115.0% for AGIs below $25k)
Percentage of individuals using paid preparers for their 2020 taxes: 88.6%
Here:
89%
State:
92%
(% for various income ranges: 88.9% for AGIs below $25k, 87.5% for AGIs $25k-50k, 71.4% for AGIs $50k-75k, 100.0% for AGIs $75k-100k, 100.0% for AGIs $100k-200k, 100.0% for AGIs over 200k)
Averages for the 2012 tax year for zip code 95017, filed in 2013:
Average Adjusted Gross Income (AGI) in 2012: $59,632 (Individual Income Tax Returns)
Here:
$59,632
State:
$72,726
Salary/wage: $45,019 (reported on 78.0% of returns)
Here:
$45,019
State:
$59,079
(% of AGI for various income ranges: 67.7% for AGIs below $25k, 76.9% for AGIs $25k-50k, 63.9% for AGIs $50k-75k, 79.0% for AGIs $75k-100k, 45.7% for AGIs $100k-200k)
Taxable interest for individuals: $1,540 (reported on 36.6% of returns)
This zip code:
$1,540
California:
$2,146
(% of AGI for various income ranges: 0.9% for AGIs below $25k, 0.3% for AGIs $25k-50k, 1.5% for AGIs $50k-75k, 1.3% for AGIs $100k-200k)
Ordinary dividends: $7,422 (reported on 22.0% of returns)
Here:
$7,422
State:
$9,308
(% of AGI for various income ranges: 3.0% for AGIs below $25k, 4.8% for AGIs $50k-75k, 3.6% for AGIs $100k-200k)
Net capital gain/loss in AGI: +$46,186 (reported on 17.1% of returns)
Here:
+$46,186
State:
+$30,460
(% of AGI for various income ranges: 26.7% for AGIs $100k-200k)
Profit/loss from business: +$11,991 (reported on 26.8% of returns)
Here:
+$11,991
State:
+$17,064
(% of AGI for various income ranges: 16.5% for AGIs below $25k, 12.8% for AGIs $25k-50k, 15.3% for AGIs $75k-100k)
Taxable individual retirement arrangement distribution: $5,900 (reported on 4.9% of returns)
95017:
$5,900
California:
$19,557
Total itemized deductions: $30,827 (23% of AGI, reported on 26.8% of returns)
Here:
$30,827
State:
$34,004
Here:
22.6% of AGI
State:
22.7% of AGI
(% of AGI for various income ranges: 22.4% for AGIs below $25k, 16.7% for AGIs $50k-75k, 14.6% for AGIs $75k-100k, 15.3% for AGIs $100k-200k)
Charity contributions: $2,600 (reported on 17.1% of returns)
Here:
$2,600
State:
$4,659
Taxes paid: $11,945 (reported on 26.8% of returns)
95017:
$11,945
State:
$14,448
(% of AGI for various income ranges: 4.6% for AGIs below $25k, 3.7% for AGIs $50k-75k, 6.1% for AGIs $75k-100k, 7.4% for AGIs $100k-200k)
Earned income credit: $1,767 (reported on 14.6% of returns)
Here:
$1,767
State:
$2,286
(% of AGI for various income ranges: 4.2% for AGIs below $25k)
Percentage of individuals using paid preparers for their 2012 taxes: 63.4%
Here:
63%
State:
64%
(% for various income ranges: 55.6% for AGIs below $25k, 70.0% for AGIs $25k-50k, 100.0% for AGIs $50k-75k, 80.0% for AGIs $100k-200k)
Averages for the 2004 tax year for zip code 95017, filed in 2005:
Average Adjusted Gross Income (AGI) in 2004: $45,253 (Individual Income Tax Returns)
Here:
$45,253
State:
$58,600
Salary/wage: $39,183 (reported on 77.3% of returns)
Here:
$39,183
State:
$49,455
(% of AGI for various income ranges: 295.5% for AGIs below $10k, 70.2% for AGIs $10k-25k, 82.5% for AGIs $25k-50k, 82.3% for AGIs $50k-75k, 72.5% for AGIs $75k-100k, 49.0% for AGIs over 100k)
Taxable interest for individuals: $3,368 (reported on 44.1% of returns)
This zip code:
$3,368
California:
$2,365
(% of AGI for various income ranges: 59.6% for AGIs below $10k, 1.6% for AGIs $10k-25k, 1.5% for AGIs $25k-50k, 1.1% for AGIs $50k-75k, 1.0% for AGIs $75k-100k, 5.4% for AGIs over 100k)
Taxable dividends: $4,148 (reported on 22.7% of returns)
Here:
$4,148
State:
$4,746
(% of AGI for various income ranges: 30.3% for AGIs below $10k, 2.8% for AGIs $10k-25k, 0.4% for AGIs $25k-50k, 1.8% for AGIs $75k-100k, 3.2% for AGIs over 100k)
Net capital gain/loss: +$12,015 (reported on 16.8% of returns)
Here:
+$12,015
State:
+$23,418
(% of AGI for various income ranges: -15.7% for AGIs below $10k, -0.1% for AGIs $10k-25k, 3.2% for AGIs $75k-100k, 9.8% for AGIs over 100k)
Profit/loss from business: +$12,948 (reported on 24.7% of returns)
Here:
+$12,948
State:
+$16,826
(% of AGI for various income ranges: -18.0% for AGIs below $10k, 14.4% for AGIs $10k-25k, 10.5% for AGIs $25k-50k, 9.0% for AGIs $50k-75k, 10.7% for AGIs $75k-100k, 2.1% for AGIs over 100k)
IRA payment deduction: $3,118 (reported on 4.4% of returns)
95017:
$3,118
California:
$3,192
Total itemized deductions: $22,227 (23% of AGI, reported on 28.4% of returns)
Here:
$22,227
State:
$28,113
Here:
23.3% of AGI
State:
25.3% of AGI
(% of AGI for various income ranges: 9.0% for AGIs $10k-25k, 9.8% for AGIs $25k-50k, 13.4% for AGIs $50k-75k, 21.4% for AGIs $75k-100k, 14.6% for AGIs over 100k)
Charity contributions deductions: $1,943 (2% of AGI, reported on 22.4% of returns)
Here:
$1,943
State:
$3,923
Here:
1.9% of AGI
State:
3.3% of AGI
(% of AGI for various income ranges: 0.6% for AGIs $25k-50k, 0.6% for AGIs $50k-75k, 1.5% for AGIs $75k-100k, 1.3% for AGIs over 100k)
Total tax: $7,333 (reported on 74.2% of returns)
95017:
$7,333
State:
$10,761
(% of AGI for various income ranges: 24.7% for AGIs below $10k, 5.1% for AGIs $10k-25k, 8.6% for AGIs $25k-50k, 9.7% for AGIs $50k-75k, 10.5% for AGIs $75k-100k, 16.4% for AGIs over 100k)
Earned income credit: $1,600 (reported on 12.9% of returns)
Here:
$1,600
State:
$1,763
Percentage of individuals using paid preparers for their 2004 taxes: 60.3%
Here:
60%
State:
66%
(% for various income ranges: 49.4% for AGIs below $10k, 62.2% for AGIs $10k-25k, 55.9% for AGIs $25k-50k, 54.8% for AGIs $50k-75k, 76.7% for AGIs $75k-100k, 84.2% for AGIs over 100k)
Likely homosexual households (counted as self-reported same-sex unmarried-partner households)
Lesbian couples: 0.0% of all households
Gay men: 0.7% of all households
Household received Food Stamps/SNAP in the past 12 months: 65 Household did not receive Food Stamps/SNAP in the past 12 months: 220
Women who did not have a birth in the past 12 months: 213 (71 now married, 142 unmarried)
Housing units in zip code 95017 with a mortgage: 55 (4 second mortgage, 2 home equity loan, 1 both second mortgage and home equity loan) Median monthly owner costs for units with a mortgage: $3,633 Median monthly owner costs for units without a mortgage: $770
Residents with income below the poverty level in 2022:
This zip code:
5.8%
Whole state:
12.2%
Residents with income below 50% of the poverty level in 2022:
This zip code:
1.0%
Whole state:
6.2%
Median number of rooms in houses and condos:
Here:
5.7
State:
6.0
Median number of rooms in apartments:
Here:
4.0
State:
3.9
Notable locations in this zip code not listed on our city pages
Notable locations in zip code 95017: Whitehouse Camp (A), Chalks Lookout (B), Twin Redwoods Trail Camp (C), Rancho del Osos Nature and History Center (D), Olives Landing (E), Horse Trail Camp (F), Alder Trail Camp (G), Sunset Trail Camp (H), Mount McAbee Overlook (I), Camp Herbert Trail Camp (J), Big Creek Fire Station (K), Big Creek Powerhouse (L), Greyhound Rock Fishing Access (M), Davenport Overlook (N). Display/hide their locations on the map
Streams, rivers, and creeks: Boyer Creek (A), Henry Creek (B), Kelly Creek (C), Last Chance Creek (D), Liddell Creek (E), Little Creek (F), Molino Creek (G), Winter Creek (H), Waddell Creek (I). Display/hide their locations on the map
178 married couples with children.
0 single-parent households ().
60.1% of residents of 95017 zip code speak English at home.
38.7% of residents speak Spanish at home (54% very well, 20% well, 6% not well, 20% not at all).
0.2% of residents speak other Indo-European language at home (100% well).
0.7% of residents speak Asian or Pacific Island language at home (100% very well).
0.3% of residents speak other language at home (100% very well).
Foreign born population: 180 (20.1%) (21.7% of them are naturalized citizens)
This zip code:
20.1%
Whole state:
26.7%
77%Honduras
7%Thailand
7%Costa Rica
2%Iraq
1%Norway
5%European
4%Irish
2%English
2%German
2%Scottish
2%Polish
1%Eastern European
Year of entry for the foreign-born population
232010 or later
872000 to 2009
171990 to 1999
66Before 1990
Facilities with environmental interests located in this zip code:
LUNDBERG STUDIOS INCORPORATED (131 OLD COAST ROAD in DAVENPORT, CA)
TRI REPORTER (Tracking of toxic chemicals releasing facilities) Business SIC classification: GLASS PRODUCTS, MADE OF PURCHASED GLASS
Housing units lacking complete plumbing facilities: 11.5% Housing units lacking complete kitchen facilities: 6.1%
29.0%Bottled, tank, or LP gas
25.0%Wood
20.2%Utility gas
15.4%Electricity
11.4%No fuel used
Population in 1990: 42. Population change in the 1990s: +808 (+1923.8%).
Place of birth for U.S.-born residents:
This state: 547
Northeast: 58
Midwest: 32
South: 23
West: 40
55% of the 95017 zip code residents lived in the same house 5 years ago. Out of people who lived in different houses, 71% lived in this county. Out of people who lived in different counties, 50% lived in California.
83% of the 95017 zip code residents lived in the same house 1 year ago. Out of people who lived in different houses, 31% moved from this county. Out of people who lived in different houses, 62% moved from different county within same state. Out of people who lived in different houses, 4% moved from abroad.
Private vs. public school enrollment:
Students in private schools in grades 1 to 8 (elementary and middle school):
Here:
0.0%
California:
10.5%
Students in private schools in grades 9 to 12 (high school): 8
Here:
20.7%
California:
8.5%
Students in private undergraduate colleges:
Here:
0.0%
California:
15.9%
Occupation by median earnings in the past 12 months ($)
159,976Health diagnosing and treating practitioners and other technical occupations
143,053Food preparation and serving related occupations
75,400Office and administrative support occupations
62,691Construction and extraction occupations
52,100Management occupations
52,038Installation, maintenance, and repair occupations
Top industries in this zip code by the number of employees in 2005:
Accommodation and Food Services: Limited-Service Restaurants (20-49 employees: 1 establishment)
Accommodation and Food Services: Full-Service Restaurants (10-19: 2, 1-4: 1)
Construction: New Single-Family Housing Construction (except Operative Builders) (1-4: 2)
Arts, Entertainment, and Recreation: Independent Artists, Writers, and Performers (1-4: 2)
Professional, Scientific, and Technical Services: Other Scientific and Technical Consulting Services (1-4: 1)
Accommodation and Food Services: Snack and Nonalcoholic Beverage Bars (1-4: 1)
People in group quarters in 2010:
81 people in other noninstitutional facilities
17 people in workers' group living quarters and job corps centers
2 people in college/university student housing
People in group quarters in 2000:
86 people in state prisons
27 people in other noninstitutional group quarters
14 people in agriculture workers' dormitories on farms
2 people in college dormitories (includes college quarters off campus)
Fatal accident statistics in 2011:
Fatal accident count: 1
Vehicles involved in fatal accidents: 1
Fatal accidents caused by drunken drivers: 0
Fatalities: 1
Persons involved in fatal accidents: 1
Pedestrians involved in fatal accidents: 0
Home Mortgage Disclosure Act Aggregated Statistics For Year 2009 (Based on 2 partial tracts)
A) FHA, FSA/RHS & VA Home Purchase Loans
B) Conventional Home Purchase Loans
C) Refinancings
D) Home Improvement Loans
F) Non-occupant Loans on < 5 Family Dwellings (A B C & D)
Number
Average Value
Number
Average Value
Number
Average Value
Number
Average Value
Number
Average Value
LOANS ORIGINATED
7
$400,803
25
$453,041
159
$348,011
15
$247,063
14
$381,591
APPLICATIONS APPROVED, NOT ACCEPTED
0
$0
3
$515,433
20
$429,058
0
$0
1
$469,290
APPLICATIONS DENIED
0
$0
6
$489,362
51
$452,080
3
$35,263
9
$363,254
APPLICATIONS WITHDRAWN
1
$464,790
5
$289,228
17
$365,888
5
$96,334
3
$222,830
FILES CLOSED FOR INCOMPLETENESS
0
$0
1
$364,630
8
$415,976
1
$168,810
0
$0
Aggregated Statistics For Year 2008 (Based on 2 partial tracts)
A) FHA, FSA/RHS & VA Home Purchase Loans
B) Conventional Home Purchase Loans
C) Refinancings
D) Home Improvement Loans
F) Non-occupant Loans on < 5 Family Dwellings (A B C & D)
G) Loans On Manufactured Home Dwelling (A B C & D)
Number
Average Value
Number
Average Value
Number
Average Value
Number
Average Value
Number
Average Value
Number
Average Value
LOANS ORIGINATED
1
$514,310
28
$506,751
51
$375,553
5
$341,446
8
$525,280
0
$0
APPLICATIONS APPROVED, NOT ACCEPTED
0
$0
0
$0
12
$384,042
0
$0
1
$261,090
1
$438,910
APPLICATIONS DENIED
1
$734,890
14
$604,983
46
$497,892
7
$541,157
2
$548,070
2
$266,720
APPLICATIONS WITHDRAWN
0
$0
7
$582,796
18
$531,752
3
$218,703
2
$437,220
0
$0
FILES CLOSED FOR INCOMPLETENESS
0
$0
2
$469,290
1
$469,290
2
$709,565
0
$0
0
$0
Aggregated Statistics For Year 2007 (Based on 2 partial tracts)
B) Conventional Home Purchase Loans
C) Refinancings
D) Home Improvement Loans
F) Non-occupant Loans on < 5 Family Dwellings (A B C & D)
G) Loans On Manufactured Home Dwelling (A B C & D)
Number
Average Value
Number
Average Value
Number
Average Value
Number
Average Value
Number
Average Value
LOANS ORIGINATED
39
$520,252
99
$459,788
10
$195,932
6
$456,162
0
$0
APPLICATIONS APPROVED, NOT ACCEPTED
14
$348,633
23
$521,843
1
$467,040
1
$764,150
2
$97,910
APPLICATIONS DENIED
15
$635,026
53
$789,988
10
$361,028
5
$809,388
0
$0
APPLICATIONS WITHDRAWN
3
$547,693
23
$477,072
0
$0
1
$467,040
0
$0
FILES CLOSED FOR INCOMPLETENESS
0
$0
11
$562,291
0
$0
0
$0
0
$0
Aggregated Statistics For Year 2006 (Based on 2 partial tracts)
B) Conventional Home Purchase Loans
C) Refinancings
D) Home Improvement Loans
F) Non-occupant Loans on < 5 Family Dwellings (A B C & D)
G) Loans On Manufactured Home Dwelling (A B C & D)
Number
Average Value
Number
Average Value
Number
Average Value
Number
Average Value
Number
Average Value
LOANS ORIGINATED
42
$512,646
123
$458,431
11
$302,528
14
$412,781
0
$0
APPLICATIONS APPROVED, NOT ACCEPTED
12
$563,637
29
$440,613
2
$419,775
2
$387,140
0
$0
APPLICATIONS DENIED
14
$578,214
38
$603,599
5
$294,854
5
$329,292
1
$102,410
APPLICATIONS WITHDRAWN
8
$438,484
38
$459,637
1
$67,520
3
$466,290
0
$0
FILES CLOSED FOR INCOMPLETENESS
1
$765,270
8
$426,386
1
$11,250
1
$526,690
0
$0
Aggregated Statistics For Year 2005 (Based on 2 partial tracts)
B) Conventional Home Purchase Loans
C) Refinancings
D) Home Improvement Loans
F) Non-occupant Loans on < 5 Family Dwellings (A B C & D)
G) Loans On Manufactured Home Dwelling (A B C & D)
Number
Average Value
Number
Average Value
Number
Average Value
Number
Average Value
Number
Average Value
LOANS ORIGINATED
63
$471,203
150
$437,811
15
$296,655
12
$572,266
1
$94,530
APPLICATIONS APPROVED, NOT ACCEPTED
18
$488,486
37
$540,922
2
$70,335
8
$295,559
0
$0
APPLICATIONS DENIED
14
$696,221
60
$564,801
7
$292,604
6
$373,820
2
$136,175
APPLICATIONS WITHDRAWN
8
$482,375
48
$501,624
1
$168,810
3
$572,077
0
$0
FILES CLOSED FOR INCOMPLETENESS
1
$688,740
20
$572,998
0
$0
1
$202,570
0
$0
Aggregated Statistics For Year 2004 (Based on 2 partial tracts)
B) Conventional Home Purchase Loans
C) Refinancings
D) Home Improvement Loans
F) Non-occupant Loans on < 5 Family Dwellings (A B C & D)
G) Loans On Manufactured Home Dwelling (A B C & D)
Number
Average Value
Number
Average Value
Number
Average Value
Number
Average Value
Number
Average Value
LOANS ORIGINATED
70
$431,543
160
$357,856
17
$257,849
19
$362,675
1
$45,020
APPLICATIONS APPROVED, NOT ACCEPTED
12
$508,587
25
$326,591
1
$33,760
0
$0
1
$168,810
APPLICATIONS DENIED
16
$453,888
65
$496,977
6
$118,167
6
$333,307
7
$460,450
APPLICATIONS WITHDRAWN
18
$425,776
37
$406,634
2
$54,580
2
$432,715
0
$0
FILES CLOSED FOR INCOMPLETENESS
2
$455,785
9
$294,730
1
$124,920
0
$0
0
$0
Aggregated Statistics For Year 2003 (Based on 2 partial tracts)
B) Conventional Home Purchase Loans
C) Refinancings
D) Home Improvement Loans
F) Non-occupant Loans on < 5 Family Dwellings (A B C & D)
Number
Average Value
Number
Average Value
Number
Average Value
Number
Average Value
LOANS ORIGINATED
82
$331,032
425
$298,043
3
$73,150
50
$307,954
APPLICATIONS APPROVED, NOT ACCEPTED
10
$324,340
43
$296,425
2
$78,780
5
$145,626
APPLICATIONS DENIED
3
$504,180
62
$353,811
1
$90,030
2
$272,910
APPLICATIONS WITHDRAWN
16
$398,040
36
$348,405
0
$0
1
$696,620
FILES CLOSED FOR INCOMPLETENESS
2
$226,770
14
$331,591
0
$0
0
$0
Aggregated Statistics For Year 2002 (Based on 2 partial tracts)
B) Conventional Home Purchase Loans
C) Refinancings
D) Home Improvement Loans
F) Non-occupant Loans on < 5 Family Dwellings (A B C & D)
Number
Average Value
Number
Average Value
Number
Average Value
Number
Average Value
LOANS ORIGINATED
51
$360,128
248
$308,922
5
$31,512
10
$250,064
APPLICATIONS APPROVED, NOT ACCEPTED
5
$463,214
36
$327,679
0
$0
6
$230,707
APPLICATIONS DENIED
9
$332,993
24
$389,904
1
$45,020
3
$449,033
APPLICATIONS WITHDRAWN
11
$411,385
33
$333,391
0
$0
0
$0
FILES CLOSED FOR INCOMPLETENESS
3
$244,963
12
$338,745
0
$0
1
$620,100
Aggregated Statistics For Year 2001 (Based on 2 partial tracts)
B) Conventional Home Purchase Loans
C) Refinancings
D) Home Improvement Loans
F) Non-occupant Loans on < 5 Family Dwellings (A B C & D)
Number
Average Value
Number
Average Value
Number
Average Value
Number
Average Value
LOANS ORIGINATED
46
$341,510
199
$292,525
15
$66,099
12
$338,558
APPLICATIONS APPROVED, NOT ACCEPTED
8
$307,094
36
$309,985
1
$112,540
6
$187,942
APPLICATIONS DENIED
2
$337,620
37
$343,703
5
$77,652
3
$366,880
APPLICATIONS WITHDRAWN
10
$317,475
21
$310,021
0
$0
2
$298,230
FILES CLOSED FOR INCOMPLETENESS
2
$424,840
12
$296,262
1
$135,050
0
$0
Aggregated Statistics For Year 2000 (Based on 2 partial tracts)
A) FHA, FSA/RHS & VA Home Purchase Loans
B) Conventional Home Purchase Loans
C) Refinancings
D) Home Improvement Loans
F) Non-occupant Loans on < 5 Family Dwellings (A B C & D)
Number
Average Value
Number
Average Value
Number
Average Value
Number
Average Value
Number
Average Value
LOANS ORIGINATED
0
$0
51
$385,990
55
$269,462
18
$57,708
6
$226,018
APPLICATIONS APPROVED, NOT ACCEPTED
0
$0
7
$339,067
8
$251,949
3
$33,013
1
$276,850
APPLICATIONS DENIED
0
$0
12
$303,671
32
$351,125
3
$30,010
3
$412,270
APPLICATIONS WITHDRAWN
1
$173,310
10
$201,559
9
$305,359
0
$0
0
$0
FILES CLOSED FOR INCOMPLETENESS
0
$0
1
$56,270
8
$280,225
0
$0
0
$0
Aggregated Statistics For Year 1999 (Based on 1 partial tract)
B) Conventional Home Purchase Loans
C) Refinancings
D) Home Improvement Loans
F) Non-occupant Loans on < 5 Family Dwellings (A B C & D)
Detailed PMIC statistics for the following Tracts:1202.00
2006 - 2018 National Fire Incident Reporting System (NFIRS) incidents
According to the data from the years 2006 - 2018 the average number of fire incidents per year is 9. The highest number of fire incidents - 34 took place in 2009, and the least - 2 in 2006. The data has a growing trend.
When looking into fire subcategories, the most incidents belonged to: Outside Fires (55.2%), and Structure Fires (19.8%).
Fire incident types reported to NFIRS in Zip Code 95017

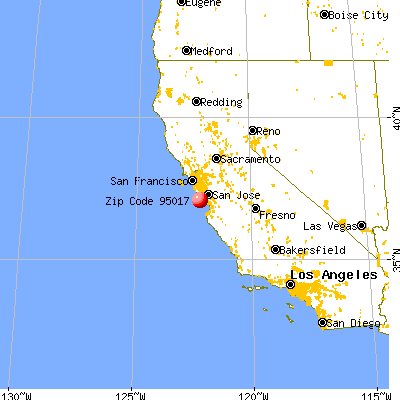


 Nearest zip codes: 95006, 95007, 94060, 95060, 95005, 94020.


 According to the data from the years 2006 - 2018 the average number of fire incidents per year is 9. The highest number of fire incidents - 34 took place in 2009, and the least - 2 in 2006. The data has a growing trend.
 When looking into fire subcategories, the most incidents belonged to: Outside Fires (55.2%), and Structure Fires (19.8%).