Estimated median house/condo value in 2022: $495,364
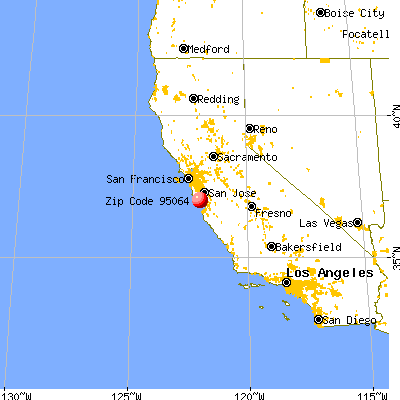
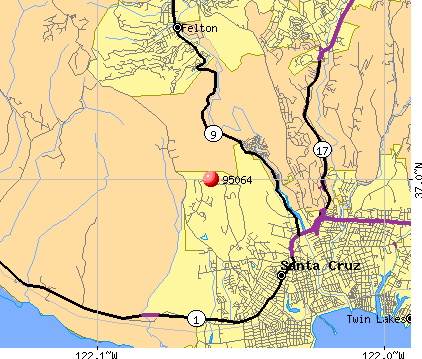
95064:
$495,364
California:
$715,900
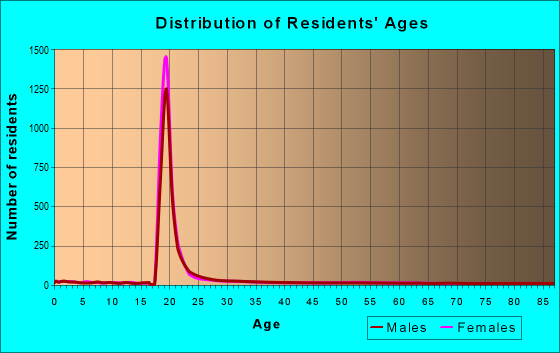
Median resident age:
This zip code:
20.0 years
California median age:
37.9 years
Average household size:
This zip code:
2.1 people
California:
2.8 people
Averages for the 2020 tax year for zip code 95064, filed in 2021:
Average Adjusted Gross Income (AGI) in 2020: $91,312 (Individual Income Tax Returns)
Here:
$91,312
State:
$95,910
Salary/wage: $77,738 (reported on 93.8% of returns)
Here:
$77,738
State:
$77,331
(% of AGI for various income ranges: 1171.0% for AGIs below $25k, 3917.5% for AGIs $25k-50k, 4120.0% for AGIs $50k-75k, 20847.1% for AGIs $100k-200k, 55690.0% for AGIs over 200k)
Taxable interest for individuals: $883 (reported on 37.5% of returns)
This zip code:
$883
California:
$2,294
(% of AGI for various income ranges: 5.0% for AGIs below $25k, 13.3% for AGIs $50k-75k, 104.3% for AGIs $100k-200k, 365.0% for AGIs over 200k)
Ordinary dividends: $5,293 (reported on 29.2% of returns)
Here:
$5,293
State:
$10,949
(% of AGI for various income ranges: 51.2% for AGIs $25k-50k, 232.9% for AGIs $100k-200k, 2685.0% for AGIs over 200k)
Net capital gain/loss in AGI: +$16,582 (reported on 22.9% of returns)
Here:
+$16,582
State:
+$49,306
(% of AGI for various income ranges: 86.2% for AGIs $25k-50k, 284.3% for AGIs $100k-200k, 7780.0% for AGIs over 200k)
Profit/loss from business: +$3,120 (reported on 20.8% of returns)
Here:
+$3,120
State:
+$15,671
(% of AGI for various income ranges: 207.5% for AGIs $25k-50k, 95.7% for AGIs $100k-200k, 395.0% for AGIs over 200k)
Total itemized deductions: $28,950 (reported on 12.5% of returns)
Here:
$28,950
State:
$39,517
(% of AGI for various income ranges: 1364.3% for AGIs $100k-200k, 3910.0% for AGIs over 200k)
Charity contributions: $8,100 (reported on 8.3% of returns)
Here:
$8,100
State:
$12,598
(% of AGI for various income ranges: 462.9% for AGIs $100k-200k)
Taxes paid: $9,050 (reported on 12.5% of returns)
95064:
$9,050
State:
$8,807
(% of AGI for various income ranges: 490.0% for AGIs $100k-200k, 1000.0% for AGIs over 200k)
Earned income credit: $2,025 (reported on 8.3% of returns)
Here:
$2,025
State:
$2,074
(% of AGI for various income ranges: 81.0% for AGIs below $25k)
Percentage of individuals using paid preparers for their 2020 taxes: 93.8%
Here:
94%
State:
92%
(% for various income ranges: 92.3% for AGIs below $25k, 90.0% for AGIs $25k-50k, 100.0% for AGIs $50k-75k, 100.0% for AGIs $75k-100k, 91.7% for AGIs $100k-200k, 100.0% for AGIs over 200k)
Averages for the 2012 tax year for zip code 95064, filed in 2013:
Average Adjusted Gross Income (AGI) in 2012: $55,369 (Individual Income Tax Returns)
Here:
$55,369
State:
$72,726
Salary/wage: $51,056 (reported on 90.9% of returns)
Here:
$51,056
State:
$59,079
(% of AGI for various income ranges: 90.7% for AGIs below $25k, 90.8% for AGIs $25k-50k, 91.7% for AGIs $50k-75k, 92.5% for AGIs $75k-100k, 78.5% for AGIs $100k-200k)
Taxable interest for individuals: $735 (reported on 36.4% of returns)
This zip code:
$735
California:
$2,146
(% of AGI for various income ranges: 0.2% for AGIs below $25k, 0.1% for AGIs $25k-50k, 0.4% for AGIs $50k-75k, 0.1% for AGIs $75k-100k, 0.7% for AGIs $100k-200k)
Ordinary dividends: $4,007 (reported on 25.5% of returns)
Here:
$4,007
State:
$9,308
(% of AGI for various income ranges: 3.5% for AGIs below $25k, 1.5% for AGIs $50k-75k, 2.3% for AGIs $100k-200k)
Net capital gain/loss in AGI: +$1,740 (reported on 18.2% of returns)
Here:
+$1,740
State:
+$30,460
(% of AGI for various income ranges: 0.9% for AGIs $50k-75k, 1.0% for AGIs $100k-200k)
Profit/loss from business: +$2,982 (reported on 20.0% of returns)
Here:
+$2,982
State:
+$17,064
(% of AGI for various income ranges: 2.2% for AGIs below $25k, 0.8% for AGIs $50k-75k, 1.3% for AGIs $100k-200k)
Total itemized deductions: $22,744 (19% of AGI, reported on 32.7% of returns)
Here:
$22,744
State:
$34,004
Here:
19.4% of AGI
State:
22.7% of AGI
(% of AGI for various income ranges: 20.2% for AGIs $50k-75k, 13.9% for AGIs $75k-100k, 16.1% for AGIs $100k-200k)
Charity contributions: $3,071 (reported on 25.5% of returns)
Here:
$3,071
State:
$4,659
Taxes paid: $10,494 (reported on 30.9% of returns)
95064:
$10,494
State:
$14,448
(% of AGI for various income ranges: 5.4% for AGIs $50k-75k, 6.1% for AGIs $75k-100k, 7.7% for AGIs $100k-200k)
Earned income credit: $1,250 (reported on 10.9% of returns)
Here:
$1,250
State:
$2,286
(% of AGI for various income ranges: 2.9% for AGIs below $25k)
Percentage of individuals using paid preparers for their 2012 taxes: 29.1%
Here:
29%
State:
64%
(% for various income ranges: 26.9% for AGIs below $25k, 66.7% for AGIs $50k-75k, 45.5% for AGIs $100k-200k)
Averages for the 2004 tax year for zip code 95064, filed in 2005:
Average Adjusted Gross Income (AGI) in 2004: $34,456 (Individual Income Tax Returns)
Here:
$34,456
State:
$58,600
Salary/wage: $32,859 (reported on 95.9% of returns)
Here:
$32,859
State:
$49,455
(% of AGI for various income ranges: 103.7% for AGIs below $10k, 99.6% for AGIs $10k-25k, 96.3% for AGIs $25k-50k, 93.6% for AGIs $50k-75k, 91.8% for AGIs $75k-100k, 84.1% for AGIs over 100k)
Taxable interest for individuals: $490 (reported on 34.5% of returns)
This zip code:
$490
California:
$2,365
(% of AGI for various income ranges: 1.2% for AGIs below $10k, 0.2% for AGIs $10k-25k, 0.3% for AGIs $25k-50k, 0.4% for AGIs $50k-75k, 0.7% for AGIs $75k-100k, 0.5% for AGIs over 100k)
Taxable dividends: $1,843 (reported on 17.4% of returns)
Here:
$1,843
State:
$4,746
(% of AGI for various income ranges: 1.2% for AGIs below $10k, 0.3% for AGIs $25k-50k, 0.3% for AGIs $50k-75k, 1.3% for AGIs $75k-100k, 1.5% for AGIs over 100k)
Net capital gain/loss: +$1,957 (reported on 15.7% of returns)
Here:
+$1,957
State:
+$23,418
(% of AGI for various income ranges: 1.7% for AGIs below $10k, 0.0% for AGIs $25k-50k, -0.3% for AGIs $50k-75k, -0.5% for AGIs $75k-100k, 2.7% for AGIs over 100k)
Profit/loss from business: +$403 (reported on 11.4% of returns)
Here:
+$403
State:
+$16,826
(% of AGI for various income ranges: 4.3% for AGIs below $10k, 0.0% for AGIs $50k-75k, -0.7% for AGIs $75k-100k, 0.1% for AGIs over 100k)
Total itemized deductions: $16,024 (21% of AGI, reported on 29.0% of returns)
Here:
$16,024
State:
$28,113
Here:
21.1% of AGI
State:
25.3% of AGI
(% of AGI for various income ranges: 1.0% for AGIs below $10k, 2.9% for AGIs $10k-25k, 4.9% for AGIs $25k-50k, 18.1% for AGIs $50k-75k, 19.6% for AGIs $75k-100k, 16.1% for AGIs over 100k)
Charity contributions deductions: $2,386 (2% of AGI, reported on 19.5% of returns)
Here:
$2,386
State:
$3,923
Here:
2.4% of AGI
State:
3.3% of AGI
(% of AGI for various income ranges: 0.4% for AGIs $25k-50k, 1.1% for AGIs $50k-75k, 2.4% for AGIs $75k-100k, 1.8% for AGIs over 100k)
Total tax: $5,717 (reported on 65.2% of returns)
95064:
$5,717
State:
$10,761
(% of AGI for various income ranges: 1.7% for AGIs below $10k, 4.9% for AGIs $10k-25k, 7.7% for AGIs $25k-50k, 9.9% for AGIs $50k-75k, 10.7% for AGIs $75k-100k, 15.7% for AGIs over 100k)
Earned income credit: $1,463 (reported on 9.2% of returns)
Here:
$1,463
State:
$1,763
Percentage of individuals using paid preparers for their 2004 taxes: 23.4%
Here:
23%
State:
66%
(% for various income ranges: 14.8% for AGIs below $10k, 13.8% for AGIs $10k-25k, 23.0% for AGIs $25k-50k, 49.1% for AGIs $50k-75k, 37.8% for AGIs $75k-100k, 50.0% for AGIs over 100k)
Likely homosexual households (counted as self-reported same-sex unmarried-partner households)
Lesbian couples: 1.2% of all households
Gay men: 0.0% of all households
Household received Food Stamps/SNAP in the past 12 months: 95 Household did not receive Food Stamps/SNAP in the past 12 months: 422
Women who had a birth in the past 12 months: 22 (16 now married, 6 unmarried) Women who did not have a birth in the past 12 months: 5,033 (106 now married, 5,005 unmarried)
Housing units in zip code 95064 with a mortgage: 119 (6 second mortgage, 3 both second mortgage and home equity loan) Median monthly owner costs for units with a mortgage: $2,517 Median monthly owner costs for units without a mortgage: $760
Residents with income below the poverty level in 2022:
This zip code:
26.3%
Whole state:
12.2%
Residents with income below 50% of the poverty level in 2022:
This zip code:
3.2%
Whole state:
6.2%
Median number of rooms in houses and condos:
Here:
4.4
State:
6.0
Median number of rooms in apartments:
Here:
4.1
State:
3.9
Notable locations in this zip code not listed on our city pages
Notable locations in zip code 95064: Agroecology Program Farm (A), University House (B), University of California Santa Cruz Fire Department (C). Display/hide their locations on the map
In group quarters: 8,852 (-1 institutionalized population)
Size of family households: 126 2-persons, 64 3-persons, 46 4-persons, 6 5-persons
Size of nonfamily households: 118 1-person, 65 2-persons, 90 4-persons
113 married couples with children.
18 single-parent households (12 men, 6 women).
57.0% of residents of 95064 zip code speak English at home.
18.8% of residents speak Spanish at home (91% very well, 8% well, 1% not well).
7.0% of residents speak other Indo-European language at home (92% very well, 6% well, 1% not well).
14.9% of residents speak Asian or Pacific Island language at home (75% very well, 16% well, 9% not well).
1.4% of residents speak other language at home (100% very well).
Foreign born population: 1,447 (14.8%) (32.6% of them are naturalized citizens)
Housing units lacking complete plumbing facilities: 7.4%
54.3%Utility gas
41.5%Electricity
4.6%Bottled, tank, or LP gas
Population in 1990: 4,658.
Place of birth for U.S.-born residents:
This state: 6,893
Northeast: 311
Midwest: 199
South: 287
West: 415
14% of the 95064 zip code residents lived in the same house 5 years ago. Out of people who lived in different houses, 6% lived in this county. Out of people who lived in different counties, 50% lived in California.
66% of the 95064 zip code residents lived in the same house 1 year ago. Out of people who lived in different houses, 15% moved from this county. Out of people who lived in different houses, 44% moved from different county within same state. Out of people who lived in different houses, 18% moved from different state. Out of people who lived in different houses, 26% moved from abroad.
Private vs. public school enrollment:
Students in private schools in grades 1 to 8 (elementary and middle school): 8
Here:
15.0%
California:
10.5%
Students in private schools in grades 9 to 12 (high school):
Here:
1.9%
California:
8.5%
Students in private undergraduate colleges: 1,209
Here:
15.2%
California:
15.9%
Occupation by median earnings in the past 12 months ($)
34,935Management occupations
12,679Computer and mathematical occupations
9,403Material moving occupations
8,415Business and financial operations occupations
7,320Architecture and engineering occupations
6,015Food preparation and serving related occupations
Top industries in this zip code by the number of employees in 2005:
Accommodation and Food Services: Food Service Contractors (20-49 employees: 1 establishment, 5-9 employees: 1 establishment)
Educational Services: All Other Miscellaneous Schools and Instruction (5-9: 1)
Construction: Masonry Contractors (1-4: 1)
Other Services (except Public Administration): Professional Organizations (1-4: 1)
Administrative and Support and Waste Management and Remediation Services: Temporary Help Services (1-4: 1)
People in group quarters in 2010:
6,385 people in college/university student housing
People in group quarters in 2000:
3,140 people in college dormitories (includes college quarters off campus)
Fatal accident statistics in 2011:
Fatal accident count: 1
Vehicles involved in fatal accidents: 1
Fatal accidents caused by drunken drivers: 0
Fatalities: 1
Persons involved in fatal accidents: 1
Pedestrians involved in fatal accidents: 1
Home Mortgage Disclosure Act Aggregated Statistics For Year 2009 (Based on 2 partial tracts)
A) FHA, FSA/RHS & VA Home Purchase Loans
B) Conventional Home Purchase Loans
C) Refinancings
D) Home Improvement Loans
F) Non-occupant Loans on < 5 Family Dwellings (A B C & D)
G) Loans On Manufactured Home Dwelling (A B C & D)
Number
Average Value
Number
Average Value
Number
Average Value
Number
Average Value
Number
Average Value
Number
Average Value
LOANS ORIGINATED
6
$370,183
13
$288,402
79
$313,974
1
$288,740
8
$318,331
1
$145,960
APPLICATIONS APPROVED, NOT ACCEPTED
0
$0
1
$104,070
9
$345,434
1
$147,230
1
$479,760
1
$104,070
APPLICATIONS DENIED
1
$242,420
3
$287,687
20
$427,054
1
$130,730
1
$396,630
1
$228,460
APPLICATIONS WITHDRAWN
1
$474,680
3
$260,610
18
$383,581
1
$147,230
1
$261,460
0
$0
FILES CLOSED FOR INCOMPLETENESS
0
$0
3
$362,780
4
$191,650
0
$0
0
$0
1
$102,810
Aggregated Statistics For Year 2008 (Based on 2 partial tracts)
B) Conventional Home Purchase Loans
C) Refinancings
D) Home Improvement Loans
F) Non-occupant Loans on < 5 Family Dwellings (A B C & D)
G) Loans On Manufactured Home Dwelling (A B C & D)
Number
Average Value
Number
Average Value
Number
Average Value
Number
Average Value
Number
Average Value
LOANS ORIGINATED
18
$401,173
33
$369,491
1
$222,110
3
$236,283
0
$0
APPLICATIONS APPROVED, NOT ACCEPTED
3
$260,820
8
$358,788
0
$0
1
$235,440
1
$142,790
APPLICATIONS DENIED
3
$221,687
15
$365,318
2
$49,815
1
$417,570
1
$57,110
APPLICATIONS WITHDRAWN
1
$436,600
14
$368,974
0
$0
1
$126,920
0
$0
FILES CLOSED FOR INCOMPLETENESS
0
$0
1
$526,720
0
$0
0
$0
0
$0
Aggregated Statistics For Year 2007 (Based on 2 partial tracts)
B) Conventional Home Purchase Loans
C) Refinancings
D) Home Improvement Loans
F) Non-occupant Loans on < 5 Family Dwellings (A B C & D)
G) Loans On Manufactured Home Dwelling (A B C & D)
Number
Average Value
Number
Average Value
Number
Average Value
Number
Average Value
Number
Average Value
LOANS ORIGINATED
30
$399,248
52
$374,487
5
$231,502
13
$425,915
1
$95,190
APPLICATIONS APPROVED, NOT ACCEPTED
4
$455,168
13
$348,688
3
$201,590
0
$0
1
$107,880
APPLICATIONS DENIED
16
$304,449
25
$349,385
4
$255,902
6
$384,778
0
$0
APPLICATIONS WITHDRAWN
3
$588,910
13
$349,958
3
$116,133
1
$28,560
0
$0
FILES CLOSED FOR INCOMPLETENESS
1
$76,150
1
$324,920
1
$120,570
0
$0
1
$76,150
Aggregated Statistics For Year 2006 (Based on 2 partial tracts)
B) Conventional Home Purchase Loans
C) Refinancings
D) Home Improvement Loans
F) Non-occupant Loans on < 5 Family Dwellings (A B C & D)
G) Loans On Manufactured Home Dwelling (A B C & D)
Number
Average Value
Number
Average Value
Number
Average Value
Number
Average Value
Number
Average Value
LOANS ORIGINATED
44
$462,248
76
$378,639
11
$288,512
20
$390,850
1
$6,350
APPLICATIONS APPROVED, NOT ACCEPTED
11
$361,087
15
$436,563
5
$289,504
2
$461,670
0
$0
APPLICATIONS DENIED
13
$474,290
32
$446,322
4
$162,775
0
$0
0
$0
APPLICATIONS WITHDRAWN
2
$634,915
17
$374,974
2
$40,295
1
$194,820
0
$0
FILES CLOSED FOR INCOMPLETENESS
1
$261,460
3
$425,817
0
$0
1
$103,440
0
$0
Aggregated Statistics For Year 2005 (Based on 2 partial tracts)
B) Conventional Home Purchase Loans
C) Refinancings
D) Home Improvement Loans
F) Non-occupant Loans on < 5 Family Dwellings (A B C & D)
G) Loans On Manufactured Home Dwelling (A B C & D)
Number
Average Value
Number
Average Value
Number
Average Value
Number
Average Value
Number
Average Value
LOANS ORIGINATED
54
$464,045
107
$358,656
10
$267,230
12
$380,442
3
$83,133
APPLICATIONS APPROVED, NOT ACCEPTED
13
$312,907
14
$407,051
1
$229,090
1
$484,830
1
$93,920
APPLICATIONS DENIED
10
$442,824
31
$372,101
8
$278,828
3
$434,490
0
$0
APPLICATIONS WITHDRAWN
11
$268,840
25
$303,770
3
$194,187
7
$297,809
1
$117,400
FILES CLOSED FOR INCOMPLETENESS
3
$244,320
4
$527,195
2
$61,240
0
$0
0
$0
Aggregated Statistics For Year 2004 (Based on 2 partial tracts)
A) FHA, FSA/RHS & VA Home Purchase Loans
B) Conventional Home Purchase Loans
C) Refinancings
D) Home Improvement Loans
F) Non-occupant Loans on < 5 Family Dwellings (A B C & D)
Number
Average Value
Number
Average Value
Number
Average Value
Number
Average Value
Number
Average Value
LOANS ORIGINATED
1
$161,820
52
$335,520
94
$299,734
8
$273,512
17
$247,494
APPLICATIONS APPROVED, NOT ACCEPTED
0
$0
8
$420,501
16
$293,502
1
$53,940
1
$190,380
APPLICATIONS DENIED
0
$0
11
$356,415
34
$364,018
4
$150,242
3
$239,033
APPLICATIONS WITHDRAWN
0
$0
11
$288,108
22
$256,955
3
$116,133
1
$166,900
FILES CLOSED FOR INCOMPLETENESS
0
$0
1
$446,120
1
$283,030
1
$158,650
0
$0
Aggregated Statistics For Year 2003 (Based on 2 partial tracts)
A) FHA, FSA/RHS & VA Home Purchase Loans
B) Conventional Home Purchase Loans
C) Refinancings
D) Home Improvement Loans
E) Loans on Dwellings For 5+ Families
F) Non-occupant Loans on < 5 Family Dwellings (A B C & D)
Number
Average Value
Number
Average Value
Number
Average Value
Number
Average Value
Number
Average Value
Number
Average Value
LOANS ORIGINATED
1
$39,350
51
$273,973
251
$245,982
1
$2,540
1
$380,760
31
$229,418
APPLICATIONS APPROVED, NOT ACCEPTED
0
$0
6
$173,880
27
$250,173
1
$95,190
0
$0
1
$329,990
APPLICATIONS DENIED
0
$0
4
$305,085
47
$304,757
1
$24,110
1
$452,470
3
$223,380
APPLICATIONS WITHDRAWN
0
$0
8
$341,019
33
$273,263
0
$0
0
$0
2
$241,150
FILES CLOSED FOR INCOMPLETENESS
0
$0
1
$158,020
11
$270,051
0
$0
0
$0
3
$226,340
Aggregated Statistics For Year 2002 (Based on 2 partial tracts)
B) Conventional Home Purchase Loans
C) Refinancings
D) Home Improvement Loans
F) Non-occupant Loans on < 5 Family Dwellings (A B C & D)
Number
Average Value
Number
Average Value
Number
Average Value
Number
Average Value
LOANS ORIGINATED
71
$271,519
260
$246,276
1
$102,170
18
$228,668
APPLICATIONS APPROVED, NOT ACCEPTED
5
$197,106
36
$215,676
1
$22,210
2
$170,075
APPLICATIONS DENIED
12
$257,119
37
$253,874
4
$82,180
3
$292,550
APPLICATIONS WITHDRAWN
13
$264,335
33
$216,610
2
$56,160
3
$187,207
FILES CLOSED FOR INCOMPLETENESS
3
$185,937
6
$248,447
0
$0
0
$0
Aggregated Statistics For Year 2001 (Based on 2 partial tracts)
A) FHA, FSA/RHS & VA Home Purchase Loans
B) Conventional Home Purchase Loans
C) Refinancings
D) Home Improvement Loans
F) Non-occupant Loans on < 5 Family Dwellings (A B C & D)
Number
Average Value
Number
Average Value
Number
Average Value
Number
Average Value
Number
Average Value
LOANS ORIGINATED
1
$203,070
74
$229,151
208
$238,832
12
$76,575
15
$226,552
APPLICATIONS APPROVED, NOT ACCEPTED
0
$0
8
$223,935
30
$233,914
1
$59,650
4
$247,970
APPLICATIONS DENIED
0
$0
15
$166,519
36
$240,355
4
$51,562
4
$235,755
APPLICATIONS WITHDRAWN
0
$0
7
$210,869
36
$207,549
4
$49,182
3
$193,763
FILES CLOSED FOR INCOMPLETENESS
0
$0
1
$378,860
11
$215,014
0
$0
1
$326,820
Aggregated Statistics For Year 2000 (Based on 2 partial tracts)
B) Conventional Home Purchase Loans
C) Refinancings
D) Home Improvement Loans
F) Non-occupant Loans on < 5 Family Dwellings (A B C & D)
Number
Average Value
Number
Average Value
Number
Average Value
Number
Average Value
LOANS ORIGINATED
67
$213,188
61
$185,262
11
$49,615
10
$168,042
APPLICATIONS APPROVED, NOT ACCEPTED
11
$170,592
10
$173,436
3
$45,480
3
$94,133
APPLICATIONS DENIED
21
$188,265
23
$220,372
4
$27,605
3
$170,073
APPLICATIONS WITHDRAWN
9
$221,193
18
$151,987
1
$50,770
1
$126,920
FILES CLOSED FOR INCOMPLETENESS
2
$249,400
5
$168,296
0
$0
0
$0
Aggregated Statistics For Year 1999 (Based on 2 partial tracts)
B) Conventional Home Purchase Loans
C) Refinancings
D) Home Improvement Loans
F) Non-occupant Loans on < 5 Family Dwellings (A B C & D)


 Nearest zip codes: 95041, 95062, 95060, 95018, 95065, 95066.


