Estimated zip code population in 2022: 32,554 Zip code population in 2010: 31,932 Zip code population in 2000: 31,916
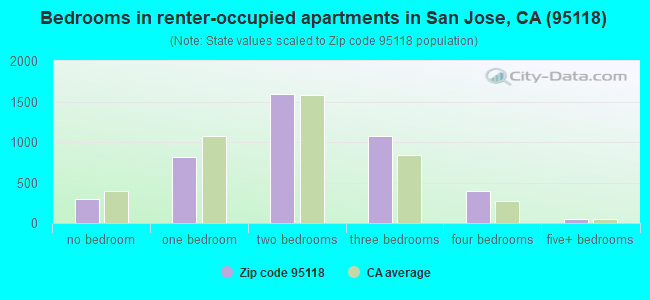
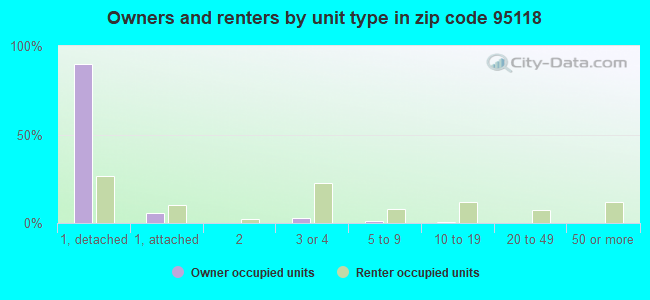
Houses and condos: 12,146 Renter-occupied apartments: 4,216
% of renters here:
36%
State:
44%
March 2022 cost of living index in zip code 95118: 124.2 (high, U.S. average is 100)
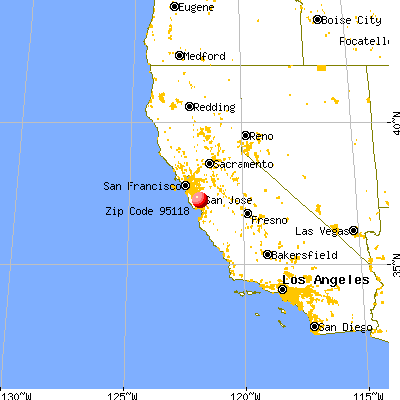
Land area: 4.1 sq. mi. Water area: 0.0 sq. mi.
Population density: 7,864 people per square mile
(high).
OSM Map
General Map
Google Map
MSN Map
OSM Map
General Map
Google Map
MSN Map
OSM Map
General Map
Google Map
MSN Map
OSM Map
General Map
Google Map
MSN Map
Please wait while loading the map...
Real estate property taxes paid for housing units in 2022:
This zip code:
0.7% ($9,288)
California:
0.7% ($4,831)
Median real estate property taxes paid for housing units with mortgages in 2022: $10,330 (0.7%) Median real estate property taxes paid for housing units with no mortgage in 2022: $5,099 (0.4%)
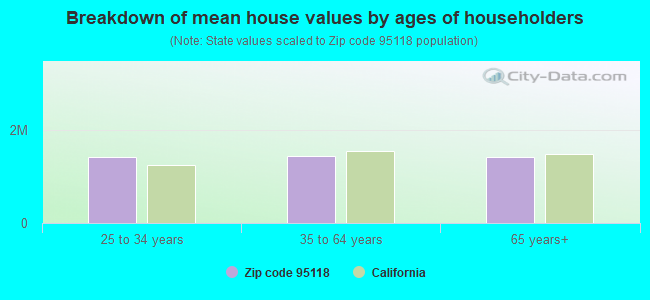
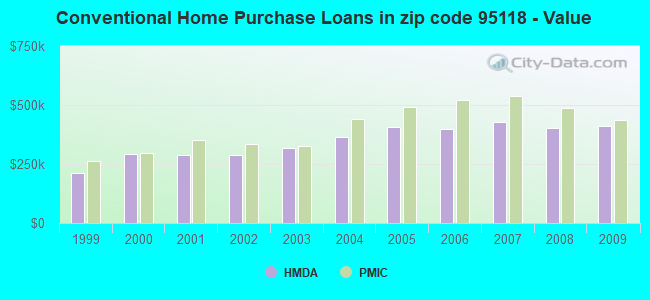
Estimated median house/condo value in 2022: $1,416,924
95118:
$1,416,924
California:
$715,900
According to our research of California and other state lists, there were 26 registered sex offenders living in 95118 zip code as of May 15, 2024. The ratio of all residents to sex offenders in zip code 95118 is 1,243 to 1. The ratio of registered sex offenders to all residents in this zip code is lower than the state average.
Median resident age:
This zip code:
39.9 years
California median age:
37.9 years
Average household size:
This zip code:
2.8 people
California:
2.8 people
Averages for the 2020 tax year for zip code 95118, filed in 2021:
Average Adjusted Gross Income (AGI) in 2020: $142,586 (Individual Income Tax Returns)
Here:
$142,586
State:
$95,910
Salary/wage: $138,280 (reported on 82.9% of returns)
Here:
$138,280
State:
$77,331
(% of AGI for various income ranges: 1298.4% for AGIs below $25k, 3977.0% for AGIs $25k-50k, 7313.3% for AGIs $50k-75k, 10799.6% for AGIs $75k-100k, 21578.2% for AGIs $100k-200k, 130691.1% for AGIs over 200k)
Taxable interest for individuals: $1,302 (reported on 47.1% of returns)
This zip code:
$1,302
California:
$2,294
(% of AGI for various income ranges: 22.9% for AGIs below $25k, 39.7% for AGIs $25k-50k, 67.6% for AGIs $50k-75k, 97.9% for AGIs $75k-100k, 160.9% for AGIs $100k-200k, 480.2% for AGIs over 200k)
Ordinary dividends: $5,085 (reported on 34.7% of returns)
Here:
$5,085
State:
$10,949
(% of AGI for various income ranges: 44.5% for AGIs below $25k, 78.4% for AGIs $25k-50k, 122.3% for AGIs $50k-75k, 162.3% for AGIs $75k-100k, 371.0% for AGIs $100k-200k, 1851.1% for AGIs over 200k)
Net capital gain/loss in AGI: +$28,179 (reported on 33.7% of returns)
Here:
+$28,179
State:
+$49,306
(% of AGI for various income ranges: 21.0% for AGIs below $25k, 42.6% for AGIs $25k-50k, 132.7% for AGIs $50k-75k, 203.4% for AGIs $75k-100k, 814.0% for AGIs $100k-200k, 14400.0% for AGIs over 200k)
Profit/loss from business: +$23,196 (reported on 14.9% of returns)
Here:
+$23,196
State:
+$15,671
(% of AGI for various income ranges: 173.9% for AGIs below $25k, 216.3% for AGIs $25k-50k, 277.8% for AGIs $50k-75k, 549.4% for AGIs $75k-100k, 869.4% for AGIs $100k-200k, 2825.1% for AGIs over 200k)
Taxable individual retirement arrangement distribution: $19,265 (reported on 8.0% of returns)
95118:
$19,265
California:
$23,505
(% of AGI for various income ranges: 61.3% for AGIs below $25k, 115.0% for AGIs $25k-50k, 210.5% for AGIs $50k-75k, 376.5% for AGIs $75k-100k, 590.9% for AGIs $100k-200k, 691.8% for AGIs over 200k)
Self-employed (Keogh) retirement plans: $23,668 (reported on 1.2% of returns)
95118:
$23,668
California:
$30,163
(% of AGI for various income ranges: 16.3% for AGIs $25k-50k, 56.8% for AGIs $100k-200k, 378.3% for AGIs over 200k)
Total itemized deductions: $33,639 (reported on 25.2% of returns)
Here:
$33,639
State:
$39,517
(% of AGI for various income ranges: 161.5% for AGIs below $25k, 304.8% for AGIs $25k-50k, 436.4% for AGIs $50k-75k, 1098.3% for AGIs $75k-100k, 2328.8% for AGIs $100k-200k, 8147.6% for AGIs over 200k)
Charity contributions: $5,670 (reported on 19.9% of returns)
Here:
$5,670
State:
$12,598
(% of AGI for various income ranges: 4.5% for AGIs below $25k, 21.2% for AGIs $25k-50k, 35.2% for AGIs $50k-75k, 103.2% for AGIs $75k-100k, 294.8% for AGIs $100k-200k, 1256.3% for AGIs over 200k)
Taxes paid: $9,410 (reported on 25.1% of returns)
95118:
$9,410
State:
$8,807
(% of AGI for various income ranges: 36.6% for AGIs below $25k, 74.9% for AGIs $25k-50k, 126.3% for AGIs $50k-75k, 334.2% for AGIs $75k-100k, 708.3% for AGIs $100k-200k, 2182.7% for AGIs over 200k)
Earned income credit: $1,693 (reported on 6.4% of returns)
Here:
$1,693
State:
$2,074
(% of AGI for various income ranges: 51.9% for AGIs below $25k, 38.0% for AGIs $25k-50k)
Percentage of individuals using paid preparers for their 2020 taxes: 92.6%
Here:
93%
State:
92%
(% for various income ranges: 88.5% for AGIs below $25k, 92.7% for AGIs $25k-50k, 93.5% for AGIs $50k-75k, 92.4% for AGIs $75k-100k, 93.1% for AGIs $100k-200k, 95.5% for AGIs over 200k)
Averages for the 2012 tax year for zip code 95118, filed in 2013:
Average Adjusted Gross Income (AGI) in 2012: $84,165 (Individual Income Tax Returns)
Here:
$84,165
State:
$72,726
Salary/wage: $81,013 (reported on 83.9% of returns)
Here:
$81,013
State:
$59,079
(% of AGI for various income ranges: 73.2% for AGIs below $25k, 76.2% for AGIs $25k-50k, 73.6% for AGIs $50k-75k, 76.5% for AGIs $75k-100k, 84.5% for AGIs $100k-200k, 82.2% for AGIs over 200k)
Taxable interest for individuals: $814 (reported on 46.0% of returns)
This zip code:
$814
California:
$2,146
(% of AGI for various income ranges: 1.3% for AGIs below $25k, 0.7% for AGIs $25k-50k, 0.7% for AGIs $50k-75k, 0.5% for AGIs $75k-100k, 0.3% for AGIs $100k-200k, 0.3% for AGIs over 200k)
Ordinary dividends: $3,297 (reported on 28.1% of returns)
Here:
$3,297
State:
$9,308
(% of AGI for various income ranges: 2.1% for AGIs below $25k, 1.1% for AGIs $25k-50k, 1.4% for AGIs $50k-75k, 1.2% for AGIs $75k-100k, 0.8% for AGIs $100k-200k, 1.1% for AGIs over 200k)
Net capital gain/loss in AGI: +$8,597 (reported on 25.2% of returns)
Here:
+$8,597
State:
+$30,460
(% of AGI for various income ranges: 0.3% for AGIs $50k-75k, 0.3% for AGIs $75k-100k, 1.0% for AGIs $100k-200k, 6.6% for AGIs over 200k)
Profit/loss from business: +$20,657 (reported on 16.4% of returns)
Here:
+$20,657
State:
+$17,064
(% of AGI for various income ranges: 10.0% for AGIs below $25k, 6.6% for AGIs $25k-50k, 5.9% for AGIs $50k-75k, 4.4% for AGIs $75k-100k, 3.0% for AGIs $100k-200k, 3.1% for AGIs over 200k)
Taxable individual retirement arrangement distribution: $15,416 (reported on 9.8% of returns)
95118:
$15,416
California:
$19,557
(% of AGI for various income ranges: 3.5% for AGIs below $25k, 3.1% for AGIs $25k-50k, 2.7% for AGIs $50k-75k, 2.5% for AGIs $75k-100k, 1.5% for AGIs $100k-200k, 1.1% for AGIs over 200k)
Self-employment retirement plans: $14,588 (reported on 1.1% of returns)
95118:
$14,588
California:
$24,530
(% of AGI for various income ranges: 0.3% for AGIs below $25k, 0.3% for AGIs $50k-75k, 0.2% for AGIs $100k-200k, 0.3% for AGIs over 200k)
Total itemized deductions: $31,749 (22% of AGI, reported on 45.9% of returns)
Here:
$31,749
State:
$34,004
Here:
22.4% of AGI
State:
22.7% of AGI
(% of AGI for various income ranges: 12.6% for AGIs below $25k, 12.3% for AGIs $25k-50k, 15.3% for AGIs $50k-75k, 18.4% for AGIs $75k-100k, 20.1% for AGIs $100k-200k, 16.4% for AGIs over 200k)
Charity contributions: $2,865 (reported on 38.3% of returns)
Here:
$2,865
State:
$4,659
(% of AGI for various income ranges: 0.5% for AGIs below $25k, 0.9% for AGIs $25k-50k, 1.2% for AGIs $50k-75k, 1.6% for AGIs $75k-100k, 1.6% for AGIs $100k-200k, 1.2% for AGIs over 200k)
Taxes paid: $13,952 (reported on 45.8% of returns)
95118:
$13,952
State:
$14,448
(% of AGI for various income ranges: 2.6% for AGIs below $25k, 3.1% for AGIs $25k-50k, 4.8% for AGIs $50k-75k, 6.4% for AGIs $75k-100k, 8.6% for AGIs $100k-200k, 9.5% for AGIs over 200k)
Earned income credit: $1,776 (reported on 9.4% of returns)
Here:
$1,776
State:
$2,286
(% of AGI for various income ranges: 3.6% for AGIs below $25k, 0.5% for AGIs $25k-50k)
Percentage of individuals using paid preparers for their 2012 taxes: 56.3%
Here:
56%
State:
64%
(% for various income ranges: 52.2% for AGIs below $25k, 59.6% for AGIs $25k-50k, 58.2% for AGIs $50k-75k, 60.0% for AGIs $75k-100k, 56.3% for AGIs $100k-200k, 56.3% for AGIs over 200k)
Averages for the 2004 tax year for zip code 95118, filed in 2005:
Average Adjusted Gross Income (AGI) in 2004: $64,018 (Individual Income Tax Returns)
Here:
$64,018
State:
$58,600
Salary/wage: $62,502 (reported on 84.6% of returns)
Here:
$62,502
State:
$49,455
(% of AGI for various income ranges: 119.1% for AGIs below $10k, 71.9% for AGIs $10k-25k, 78.5% for AGIs $25k-50k, 80.4% for AGIs $50k-75k, 82.9% for AGIs $75k-100k, 84.5% for AGIs over 100k)
Taxable interest for individuals: $1,098 (reported on 55.1% of returns)
This zip code:
$1,098
California:
$2,365
(% of AGI for various income ranges: 6.2% for AGIs below $10k, 2.6% for AGIs $10k-25k, 1.4% for AGIs $25k-50k, 1.1% for AGIs $50k-75k, 0.7% for AGIs $75k-100k, 0.6% for AGIs over 100k)
Taxable dividends: $1,776 (reported on 29.7% of returns)
Here:
$1,776
State:
$4,746
(% of AGI for various income ranges: 5.3% for AGIs below $10k, 1.5% for AGIs $10k-25k, 0.8% for AGIs $25k-50k, 1.0% for AGIs $50k-75k, 0.6% for AGIs $75k-100k, 0.7% for AGIs over 100k)
Net capital gain/loss: +$5,818 (reported on 26.9% of returns)
Here:
+$5,818
State:
+$23,418
(% of AGI for various income ranges: -0.4% for AGIs below $10k, -0.5% for AGIs $10k-25k, 0.4% for AGIs $25k-50k, 0.6% for AGIs $50k-75k, 1.0% for AGIs $75k-100k, 4.2% for AGIs over 100k)
Profit/loss from business: +$17,118 (reported on 16.1% of returns)
Here:
+$17,118
State:
+$16,826
(% of AGI for various income ranges: 10.3% for AGIs below $10k, 7.3% for AGIs $10k-25k, 6.1% for AGIs $25k-50k, 4.7% for AGIs $50k-75k, 3.8% for AGIs $75k-100k, 3.6% for AGIs over 100k)
IRA payment deduction: $3,208 (reported on 2.9% of returns)
95118:
$3,208
California:
$3,192
(% of AGI for various income ranges: 0.5% for AGIs below $10k, 0.3% for AGIs $10k-25k, 0.2% for AGIs $25k-50k, 0.2% for AGIs $50k-75k, 0.2% for AGIs $75k-100k, 0.1% for AGIs over 100k)
Self-employed pension: $11,693 (reported on 1.6% of returns)
Here:
$11,693
California:
$17,688
(% of AGI for various income ranges: 0.2% for AGIs $25k-50k, 0.1% for AGIs $50k-75k, 0.3% for AGIs $75k-100k, 0.4% for AGIs over 100k)
Total itemized deductions: $26,374 (26% of AGI, reported on 49.1% of returns)
Here:
$26,374
State:
$28,113
Here:
26.1% of AGI
State:
25.3% of AGI
(% of AGI for various income ranges: 36.0% for AGIs below $10k, 14.5% for AGIs $10k-25k, 17.0% for AGIs $25k-50k, 21.5% for AGIs $50k-75k, 22.9% for AGIs $75k-100k, 20.1% for AGIs over 100k)
Charity contributions deductions: $2,517 (2% of AGI, reported on 43.6% of returns)
Here:
$2,517
State:
$3,923
Here:
2.4% of AGI
State:
3.3% of AGI
(% of AGI for various income ranges: 1.3% for AGIs below $10k, 1.1% for AGIs $10k-25k, 1.3% for AGIs $25k-50k, 1.9% for AGIs $50k-75k, 1.9% for AGIs $75k-100k, 1.8% for AGIs over 100k)
Total tax: $9,820 (reported on 82.5% of returns)
95118:
$9,820
State:
$10,761
(% of AGI for various income ranges: 5.0% for AGIs below $10k, 4.7% for AGIs $10k-25k, 7.6% for AGIs $25k-50k, 9.6% for AGIs $50k-75k, 10.4% for AGIs $75k-100k, 16.1% for AGIs over 100k)
Earned income credit: $1,403 (reported on 7.5% of returns)
Here:
$1,403
State:
$1,763
Percentage of individuals using paid preparers for their 2004 taxes: 59.0%
Here:
59%
State:
66%
(% for various income ranges: 49.3% for AGIs below $10k, 60.1% for AGIs $10k-25k, 61.8% for AGIs $25k-50k, 63.0% for AGIs $50k-75k, 61.5% for AGIs $75k-100k, 57.6% for AGIs over 100k)
Likely homosexual households (counted as self-reported same-sex unmarried-partner households)
Lesbian couples: 0.2% of all households
Gay men: 0.0% of all households
Household received Food Stamps/SNAP in the past 12 months: 762 Household did not receive Food Stamps/SNAP in the past 12 months: 10,647
Women who had a birth in the past 12 months: 402 (299 now married, 102 unmarried) Women who did not have a birth in the past 12 months: 7,537 (3,576 now married, 3,936 unmarried)
Housing units in zip code 95118 with a mortgage: 5,067 (672 second mortgage, 53 home equity loan, 533 both second mortgage and home equity loan) Houses without a mortgage: 143
Median monthly owner costs for units with a mortgage: $3,797 Median monthly owner costs for units without a mortgage: $911
Residents with income below the poverty level in 2022:
This zip code:
5.6%
Whole state:
12.2%
Residents with income below 50% of the poverty level in 2022:
This zip code:
2.8%
Whole state:
6.2%
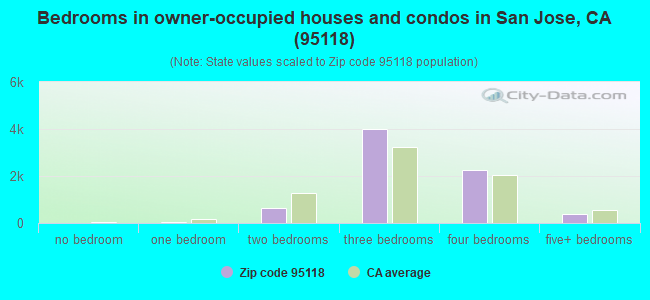
Median number of rooms in houses and condos:
Here:
6.0
State:
6.0
Median number of rooms in apartments:
Here:
4.1
State:
3.9
Notable locations in this zip code not listed on our city pages
Shopping Centers: Princeton Plaza Mall Shopping Center (1), Pioneers Shopping Center (2), Robertsville Shopping Center (3), Meridian Square Shopping Center (4), Foxworthy Shopping Center (5), Almaden Plaza Shopping Center (6). Display/hide their locations on the map
Churches in zip code 95118 include: Calvary Chapel of San Jose (A), Cambrian Park Seventh Day Adventist Church (B), Carter Avenue Church of Christ (C), Central Church of Christ (D), Church of the Chimes (E), Crown of Life Christian Church (F), Family Bible Church (G), Open Bible Church (H), Transfiguration Catholic Community (I). Display/hide their locations on the map
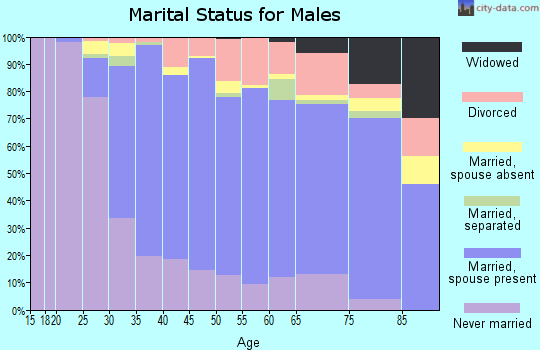
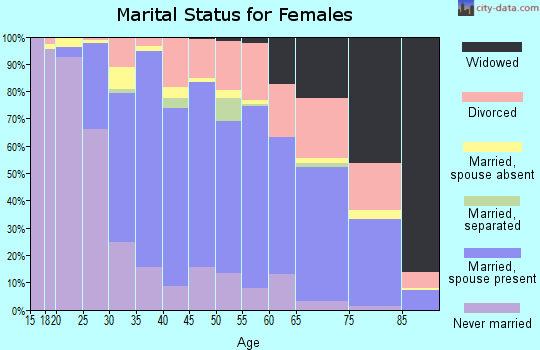
5,711 married couples with children.
1,357 single-parent households (368 men, 989 women).
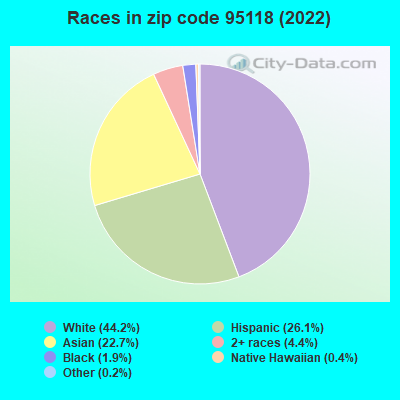
60.4% of residents of 95118 zip code speak English at home.
14.7% of residents speak Spanish at home (71% very well, 13% well, 8% not well, 8% not at all).
9.6% of residents speak other Indo-European language at home (73% very well, 17% well, 8% not well, 2% not at all).
13.3% of residents speak Asian or Pacific Island language at home (66% very well, 23% well, 10% not well, 1% not at all).
1.9% of residents speak other language at home (65% very well, 25% well, 6% not well, 4% not at all).
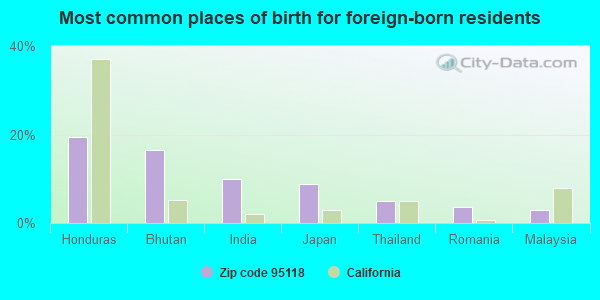
Foreign born population: 9,546 (29.3%) (50.5% of them are naturalized citizens)
Major facilities with environmental interests located in this zip code:
EXXON SERVICE STATION NO 7-2818 (4652 MERIDIAN AVE/BRANHAM in SAN JOSE, CA)
STATE MASTER (California - Hazardous Waste Tracking) - HAZARDOU WASTE PROGRAM Small Quantity Generators, between 100 kg and 1000 kg of hazardous waste/month (Resource Conservation and Recovery Act (tracking hazardous waste)) - notification Organizations: EXXON CO USA (CONTACT/OWNER)
Alternative names: EXXON MOBIL CORPORATION #728180
FOXWORTHY DRY CLEANERS INCORPORATED (1429 FOXWORTHY AVE in SAN JOSE, CA)
STATE MASTER (California - Hazardous Waste Tracking) - HAZARDOU WASTE PROGRAM CRITERIA AND HAZARDOUS AIR POLLUTANT INVENTORY (Inventory of air pollution sources) Small Quantity Generators, between 100 kg and 1000 kg of hazardous waste/month (Resource Conservation and Recovery Act (tracking hazardous waste)) Business SIC classification: DRYCLEANING PLANTS, EXCEPT RUG CLEANING
ALMADEN ELEMENTARY SCHOOL (1295 DENTWOOD DRIVE in SAN JOSE, CA)
(Geographic Names Information System) (National Center for Education Statistics) - STATE ID-6048425 Organizations: SAN JOSE UNIFIED (SCHOOL DISTRICT)
HACIENDA SCIENCE/ENVIRONMENTAL MAGNET (ELEM) (1290 KIMBERLY DR. in SAN JOSE, CA)
(National Center for Education Statistics) - STATE ID-6048722 Organizations: SAN JOSE UNIFIED (SCHOOL DISTRICT)
HAMMER ELEMENTARY (1325 BOURET DR. in SAN JOSE, CA)
(National Center for Education Statistics) - STATE ID-6048565 Organizations: SAN JOSE UNIFIED (SCHOOL DISTRICT)
LIETZ ELEMENTARY (5300 CARTER AVE. in SAN JOSE, CA)
(National Center for Education Statistics) - STATE ID-6049373 Organizations: UNION ELEMENTARY (SCHOOL DISTRICT)
MUIR (JOHN) MIDDLE (1260 BRANHAM LANE in SAN JOSE, CA)
(National Center for Education Statistics) - STATE ID-6060115 Organizations: SAN JOSE UNIFIED (SCHOOL DISTRICT)
EUROPA CLEANERS (1574 BRANHAM LANE in SAN JOSE, CA)
CRITERIA AND HAZARDOUS AIR POLLUTANT INVENTORY (Inventory of air pollution sources) Small Quantity Generators, between 100 kg and 1000 kg of hazardous waste/month (Resource Conservation and Recovery Act (tracking hazardous waste)) Business SIC classification: DRYCLEANING PLANTS, EXCEPT RUG CLEANING Organizations: EKKEHARD AUMANN (CONTACT/OWNER)
MOON'S BEST CLEANERS (1124 BRANHAM LANE in SAN JOSE, CA)
CRITERIA AND HAZARDOUS AIR POLLUTANT INVENTORY (Inventory of air pollution sources) Small Quantity Generators, between 100 kg and 1000 kg of hazardous waste/month (Resource Conservation and Recovery Act (tracking hazardous waste)) Business SIC classification: DRYCLEANING PLANTS, EXCEPT RUG CLEANING Organizations: ARVIND BHAKTA (CONTACT/OWNER)
Alternative names: BEGMANS ONE HOUR MRTINIZING
HOME DEPOT USA INC HD 1035 (5095 ALMADEN EXPRESSWAY in SAN JOSE, CA)
Small Quantity Generators, between 100 kg and 1000 kg of hazardous waste/month (Resource Conservation and Recovery Act (tracking hazardous waste)) Alternative names: HOME DEPOT USA HD 1035
L H HAUCK TRUCKING (1388 ANNAPOLIS WY in SAN JOSE, CA)
TRANSPORTER (Resource Conservation and Recovery Act (tracking hazardous waste)) Organizations: LARRY HAUCK (CONTACT/OWNER)
MARK CLEANERS THE (44 ALMADEN FASHION PLAZA in SAN JOSE, CA)
Small Quantity Generators, between 100 kg and 1000 kg of hazardous waste/month (Resource Conservation and Recovery Act (tracking hazardous waste)) Organizations: JOHN DUK KIM (CONTACT/OWNER)
ALL BRITE DRY CLEANING CENTER (4678 MERIDIAN AVENUE in SAN JOSE, CA)
Small Quantity Generators, between 100 kg and 1000 kg of hazardous waste/month (Resource Conservation and Recovery Act (tracking hazardous waste)) Alternative names: ALLBRITE CLEANERS
Housing units lacking complete plumbing facilities: 0.1% Housing units lacking complete kitchen facilities: 0.9%
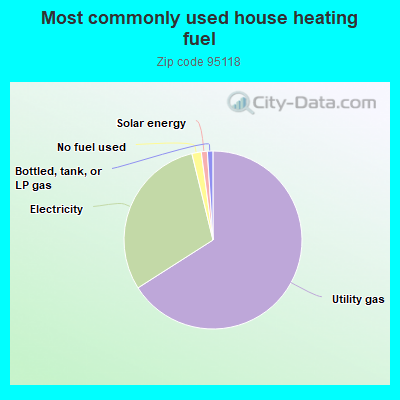
65.9%Utility gas
30.2%Electricity
1.7%No fuel used
1.1%Solar energy
1.0%Bottled, tank, or LP gas
Population in 1990: 30,591. Population change in the 1990s: +1,325 (+4.3%).
Place of birth for U.S.-born residents:
This state: 18,198
Northeast: 1,356
Midwest: 971
South: 841
West: 1,029
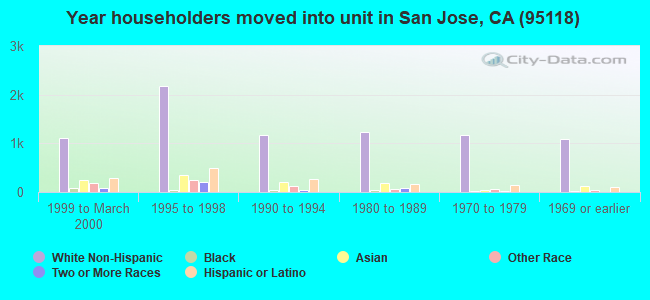
59% of the 95118 zip code residents lived in the same house 5 years ago. Out of people who lived in different houses, 76% lived in this county. Out of people who lived in different counties, 50% lived in California.
90% of the 95118 zip code residents lived in the same house 1 year ago. Out of people who lived in different houses, 65% moved from this county. Out of people who lived in different houses, 15% moved from different county within same state. Out of people who lived in different houses, 14% moved from different state. Out of people who lived in different houses, 5% moved from abroad.
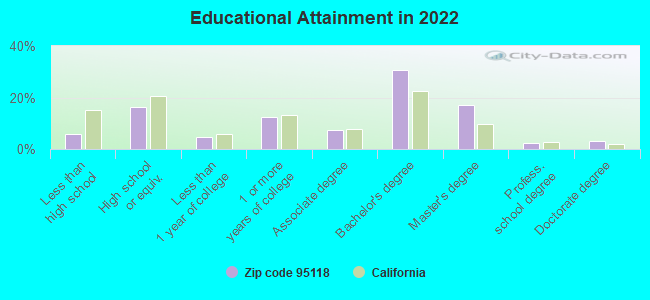
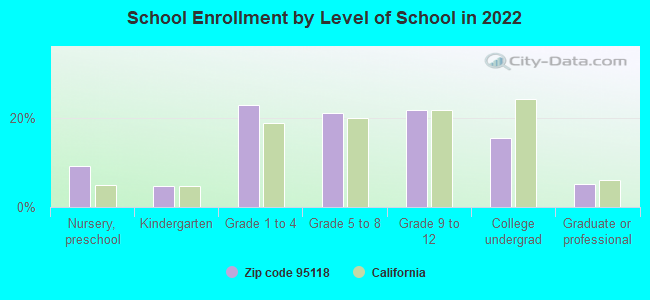
Private vs. public school enrollment:
Students in private schools in grades 1 to 8 (elementary and middle school): 709
Here:
20.6%
California:
10.5%
Students in private schools in grades 9 to 12 (high school): 404
Here:
23.9%
California:
8.5%
Students in private undergraduate colleges: 40
Here:
3.4%
California:
15.9%
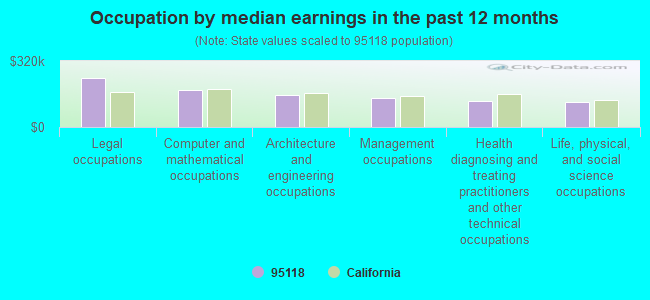
Occupation by median earnings in the past 12 months ($)
237,352Legal occupations
178,152Computer and mathematical occupations
155,782Architecture and engineering occupations
139,189Management occupations
124,560Health diagnosing and treating practitioners and other technical occupations
122,852Life, physical, and social science occupations
Companies with federal contracts located in this zip code:
TRIPLE HS, INC (3150 ALMADEN EXPRESSWAY in SAN JOSE, CA; small business) : $1,898,479 in 27 contractsfrom 1999 to 2006
Contracts for Architect - Engineer Services (including landscaping, interior layout, and designing), Environmental Studies and Assessments, Other Natural Resources -- Basic Research (R&D), Other Professional Services, and moreby Army, U.S. Army Corps of Engineers - civil program financing only, National Oceanic and Atmospheric Administration/Under Secretary for Oceans and Atmosphere, U.S. Fish and Wildlife Service, and others Signed by year:2000: $51,000; 2001: $167,645; 2002: $83,000; 2003: $324,812; 2004: $211,017; 2005: $898,452; 2006: $76,553.
Biggest contracts:
$345,000 with Army for Architect - Engineer Services (including landscaping, interior layout, and designing). Signed on 2005-03-16. Completion date: 2005-01-03.
$345,000 with U.S. Army Corps of Engineers - civil program financing only for Architect - Engineer Services (including landscaping, interior layout, and designing). Signed on 2005-03-16. Completion date: 2005-01-03.
$104,912, same as above.Signed on 2003-01-28. Completion date: 2003-03-28.
$99,204, same as above.Signed on 2005-07-05. Completion date: 2005-05-26.
J/D HAZARDOUS SUBSTANCE REMOVA (3150 ALMADEN EXPRESSWAY ST in SAN JOSE, CA; small business)
$14,600 with Army for Engineering and Technical Services. Taking place in MD. Signed on 2003-09-03. Completion date: 2003-12-31.
DAVE'S LOCK SERVICE (3321 GARDENDALE DRIVE in SAN JOSE, CA; small business)
$4,495 with Defense Finance and Accounting Service for Installation of Equipment -- Miscellaneous. Signed on 2004-07-20. Completion date: 2004-07-30.
Top industries in this zip code by the number of employees in 2005:
2006 - 2017 National Fire Incident Reporting System (NFIRS) incidents
Based on the data from the years 2006 - 2017 the average number of fire incidents per year is 13. The highest number of fire incidents - 39 took place in 2017, and the least - 0 in 2007. The data has a growing trend.
When looking into fire subcategories, the most incidents belonged to: Outside Fires (40.5%), and Structure Fires (29.4%).
Fire incident types reported to NFIRS in Zip Code 95118


 Nearest zip codes: 95124, 95125, 95136, 95032, 95123, 95008.
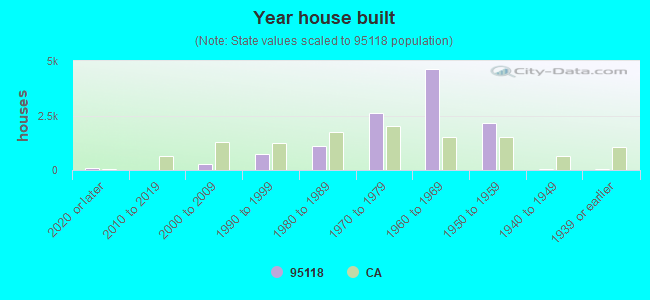


 Based on the data from the years 2006 - 2017 the average number of fire incidents per year is 13. The highest number of fire incidents - 39 took place in 2017, and the least - 0 in 2007. The data has a growing trend.
 When looking into fire subcategories, the most incidents belonged to: Outside Fires (40.5%), and Structure Fires (29.4%).