Estimated zip code population in 2022: 40,640 Zip code population in 2010: 40,299 Zip code population in 2000: 40,563
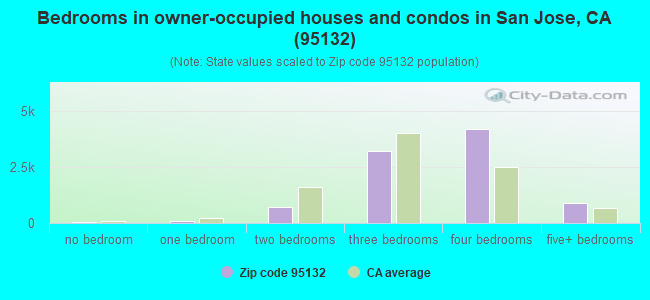
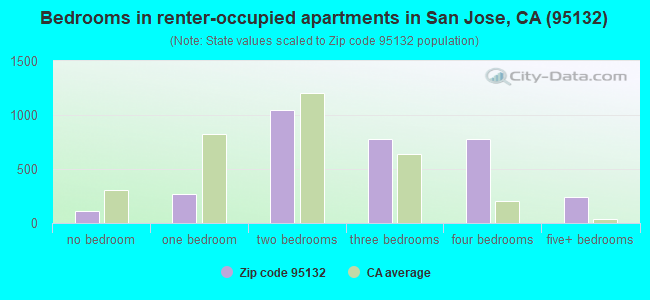
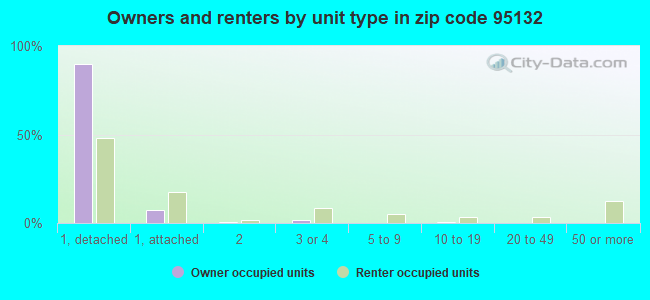
Houses and condos: 12,591 Renter-occupied apartments: 3,214
% of renters here:
26%
State:
44%
March 2022 cost of living index in zip code 95132: 123.2 (high, U.S. average is 100)
Land area: 51.0 sq. mi. Water area: 2.0 sq. mi.
Population density: 798 people per square mile
(low).
OSM Map
General Map
Google Map
MSN Map
OSM Map
General Map
Google Map
MSN Map
OSM Map
General Map
Google Map
MSN Map
OSM Map
General Map
Google Map
MSN Map
Please wait while loading the map...
Real estate property taxes paid for housing units in 2022:
This zip code:
0.7% ($9,144)
California:
0.7% ($4,831)
Median real estate property taxes paid for housing units with mortgages in 2022: $10,330 (0.8%) Median real estate property taxes paid for housing units with no mortgage in 2022: $6,886 (0.5%)
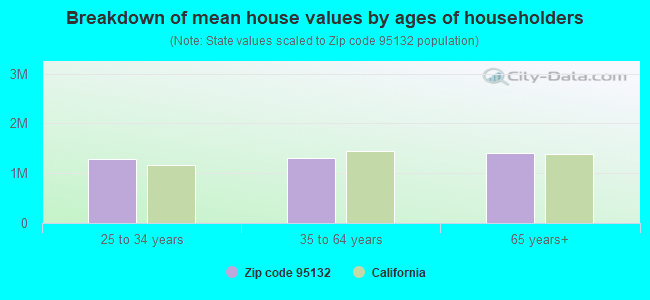
Estimated median house/condo value in 2022: $1,317,352
95132:
$1,317,352
California:
$715,900
According to our research of California and other state lists, there were 29 registered sex offenders living in 95132 zip code as of May 28, 2024. The ratio of all residents to sex offenders in zip code 95132 is 1,414 to 1. The ratio of registered sex offenders to all residents in this zip code is lower than the state average.
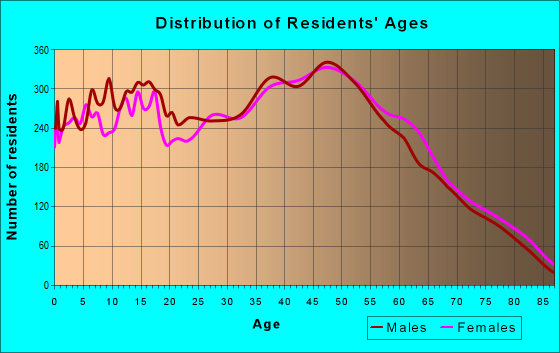
Median resident age:
This zip code:
43.2 years
California median age:
37.9 years
Average household size:
This zip code:
3.3 people
California:
2.8 people
Averages for the 2020 tax year for zip code 95132, filed in 2021:
Average Adjusted Gross Income (AGI) in 2020: $118,658 (Individual Income Tax Returns)
Here:
$118,658
State:
$95,910
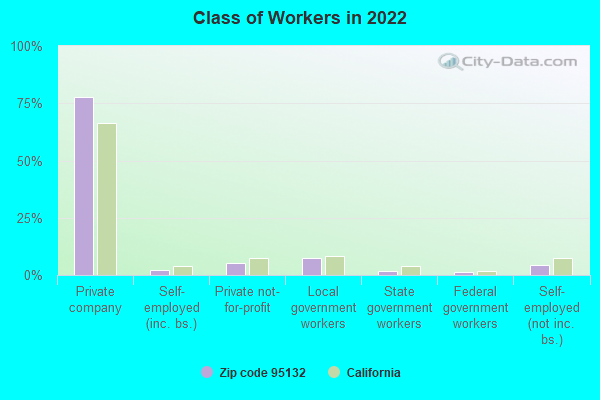
Salary/wage: $108,353 (reported on 84.1% of returns)
Here:
$108,353
State:
$77,331
(% of AGI for various income ranges: 1143.5% for AGIs below $25k, 3889.2% for AGIs $25k-50k, 7455.4% for AGIs $50k-75k, 10897.9% for AGIs $75k-100k, 22618.8% for AGIs $100k-200k, 118463.6% for AGIs over 200k)
Taxable interest for individuals: $1,550 (reported on 43.2% of returns)
This zip code:
$1,550
California:
$2,294
(% of AGI for various income ranges: 24.5% for AGIs below $25k, 40.3% for AGIs $25k-50k, 47.9% for AGIs $50k-75k, 90.9% for AGIs $75k-100k, 160.7% for AGIs $100k-200k, 791.3% for AGIs over 200k)
Ordinary dividends: $4,455 (reported on 32.2% of returns)
Here:
$4,455
State:
$10,949
(% of AGI for various income ranges: 32.1% for AGIs below $25k, 57.4% for AGIs $25k-50k, 84.2% for AGIs $50k-75k, 153.3% for AGIs $75k-100k, 313.1% for AGIs $100k-200k, 2026.2% for AGIs over 200k)
Net capital gain/loss in AGI: +$30,970 (reported on 33.9% of returns)
Here:
+$30,970
State:
+$49,306
(% of AGI for various income ranges: 23.9% for AGIs below $25k, 51.9% for AGIs $25k-50k, 116.2% for AGIs $50k-75k, 259.8% for AGIs $75k-100k, 794.8% for AGIs $100k-200k, 22392.6% for AGIs over 200k)
Profit/loss from business: +$13,982 (reported on 13.5% of returns)
Here:
+$13,982
State:
+$15,671
(% of AGI for various income ranges: 156.7% for AGIs below $25k, 167.4% for AGIs $25k-50k, 210.7% for AGIs $50k-75k, 241.3% for AGIs $75k-100k, 436.8% for AGIs $100k-200k, 1639.0% for AGIs over 200k)
Taxable individual retirement arrangement distribution: $21,225 (reported on 7.1% of returns)
95132:
$21,225
California:
$23,505
(% of AGI for various income ranges: 54.7% for AGIs below $25k, 105.6% for AGIs $25k-50k, 192.7% for AGIs $50k-75k, 326.3% for AGIs $75k-100k, 538.1% for AGIs $100k-200k, 976.5% for AGIs over 200k)
Self-employed (Keogh) retirement plans: $29,162 (reported on 0.6% of returns)
95132:
$29,162
California:
$30,163
(% of AGI for various income ranges: 7.1% for AGIs below $25k, 46.0% for AGIs $100k-200k, 311.7% for AGIs over 200k)
Total itemized deductions: $33,010 (reported on 16.7% of returns)
Here:
$33,010
State:
$39,517
(% of AGI for various income ranges: 81.3% for AGIs below $25k, 208.0% for AGIs $25k-50k, 413.2% for AGIs $50k-75k, 702.3% for AGIs $75k-100k, 1711.9% for AGIs $100k-200k, 6485.3% for AGIs over 200k)
Charity contributions: $6,125 (reported on 13.2% of returns)
Here:
$6,125
State:
$12,598
(% of AGI for various income ranges: 2.7% for AGIs below $25k, 16.4% for AGIs $25k-50k, 39.5% for AGIs $50k-75k, 81.5% for AGIs $75k-100k, 245.1% for AGIs $100k-200k, 1118.5% for AGIs over 200k)
Taxes paid: $9,326 (reported on 16.7% of returns)
95132:
$9,326
State:
$8,807
(% of AGI for various income ranges: 21.1% for AGIs below $25k, 56.4% for AGIs $25k-50k, 119.1% for AGIs $50k-75k, 227.0% for AGIs $75k-100k, 531.8% for AGIs $100k-200k, 1691.5% for AGIs over 200k)
Earned income credit: $1,672 (reported on 8.3% of returns)
Here:
$1,672
State:
$2,074
(% of AGI for various income ranges: 56.2% for AGIs below $25k, 43.3% for AGIs $25k-50k)
Percentage of individuals using paid preparers for their 2020 taxes: 90.5%
Here:
91%
State:
92%
(% for various income ranges: 88.6% for AGIs below $25k, 90.5% for AGIs $25k-50k, 91.3% for AGIs $50k-75k, 90.4% for AGIs $75k-100k, 90.9% for AGIs $100k-200k, 92.3% for AGIs over 200k)
Averages for the 2012 tax year for zip code 95132, filed in 2013:
Average Adjusted Gross Income (AGI) in 2012: $72,082 (Individual Income Tax Returns)
Here:
$72,082
State:
$72,726
Salary/wage: $69,178 (reported on 86.1% of returns)
Here:
$69,178
State:
$59,079
(% of AGI for various income ranges: 74.2% for AGIs below $25k, 83.4% for AGIs $25k-50k, 82.6% for AGIs $50k-75k, 81.5% for AGIs $75k-100k, 85.8% for AGIs $100k-200k, 79.8% for AGIs over 200k)
Taxable interest for individuals: $893 (reported on 42.7% of returns)
This zip code:
$893
California:
$2,146
(% of AGI for various income ranges: 1.0% for AGIs below $25k, 0.5% for AGIs $25k-50k, 0.5% for AGIs $50k-75k, 0.5% for AGIs $75k-100k, 0.4% for AGIs $100k-200k, 0.6% for AGIs over 200k)
Ordinary dividends: $3,237 (reported on 25.3% of returns)
Here:
$3,237
State:
$9,308
(% of AGI for various income ranges: 1.3% for AGIs below $25k, 0.8% for AGIs $25k-50k, 0.9% for AGIs $50k-75k, 1.0% for AGIs $75k-100k, 0.9% for AGIs $100k-200k, 1.7% for AGIs over 200k)
Net capital gain/loss in AGI: +$5,685 (reported on 25.1% of returns)
Here:
+$5,685
State:
+$30,460
(% of AGI for various income ranges: 0.2% for AGIs $75k-100k, 0.8% for AGIs $100k-200k, 6.9% for AGIs over 200k)
Profit/loss from business: +$16,560 (reported on 14.4% of returns)
Here:
+$16,560
State:
+$17,064
(% of AGI for various income ranges: 10.3% for AGIs below $25k, 4.0% for AGIs $25k-50k, 3.3% for AGIs $50k-75k, 2.9% for AGIs $75k-100k, 2.3% for AGIs $100k-200k, 3.3% for AGIs over 200k)
Taxable individual retirement arrangement distribution: $16,307 (reported on 7.8% of returns)
95132:
$16,307
California:
$19,557
(% of AGI for various income ranges: 3.1% for AGIs below $25k, 1.9% for AGIs $25k-50k, 2.4% for AGIs $50k-75k, 2.1% for AGIs $75k-100k, 1.6% for AGIs $100k-200k, 1.2% for AGIs over 200k)
Self-employment retirement plans: $19,479 (reported on 0.7% of returns)
95132:
$19,479
California:
$24,530
(% of AGI for various income ranges: 0.2% for AGIs $50k-75k, 0.2% for AGIs $100k-200k, 0.5% for AGIs over 200k)
Total itemized deductions: $28,440 (23% of AGI, reported on 40.9% of returns)
Here:
$28,440
State:
$34,004
Here:
22.7% of AGI
State:
22.7% of AGI
(% of AGI for various income ranges: 11.7% for AGIs below $25k, 10.7% for AGIs $25k-50k, 14.0% for AGIs $50k-75k, 16.6% for AGIs $75k-100k, 18.9% for AGIs $100k-200k, 16.2% for AGIs over 200k)
Charity contributions: $2,692 (reported on 32.9% of returns)
Here:
$2,692
State:
$4,659
(% of AGI for various income ranges: 0.6% for AGIs below $25k, 0.7% for AGIs $25k-50k, 1.1% for AGIs $50k-75k, 1.4% for AGIs $75k-100k, 1.5% for AGIs $100k-200k, 1.2% for AGIs over 200k)
Taxes paid: $12,666 (reported on 40.8% of returns)
95132:
$12,666
State:
$14,448
(% of AGI for various income ranges: 2.8% for AGIs below $25k, 3.1% for AGIs $25k-50k, 4.7% for AGIs $50k-75k, 6.3% for AGIs $75k-100k, 8.5% for AGIs $100k-200k, 9.5% for AGIs over 200k)
Earned income credit: $1,931 (reported on 13.2% of returns)
Here:
$1,931
State:
$2,286
(% of AGI for various income ranges: 5.1% for AGIs below $25k, 0.9% for AGIs $25k-50k)
Percentage of individuals using paid preparers for their 2012 taxes: 57.8%
Here:
58%
State:
64%
(% for various income ranges: 56.3% for AGIs below $25k, 60.8% for AGIs $25k-50k, 62.3% for AGIs $50k-75k, 59.4% for AGIs $75k-100k, 55.0% for AGIs $100k-200k, 49.1% for AGIs over 200k)
Averages for the 2004 tax year for zip code 95132, filed in 2005:
Average Adjusted Gross Income (AGI) in 2004: $57,641 (Individual Income Tax Returns)
Here:
$57,641
State:
$58,600
Salary/wage: $55,651 (reported on 87.3% of returns)
Here:
$55,651
State:
$49,455
(% of AGI for various income ranges: 187.6% for AGIs below $10k, 77.6% for AGIs $10k-25k, 86.6% for AGIs $25k-50k, 85.2% for AGIs $50k-75k, 86.5% for AGIs $75k-100k, 82.1% for AGIs over 100k)
Taxable interest for individuals: $1,092 (reported on 52.5% of returns)
This zip code:
$1,092
California:
$2,365
(% of AGI for various income ranges: 9.1% for AGIs below $10k, 1.7% for AGIs $10k-25k, 1.0% for AGIs $25k-50k, 0.9% for AGIs $50k-75k, 0.8% for AGIs $75k-100k, 0.9% for AGIs over 100k)
Taxable dividends: $1,891 (reported on 26.1% of returns)
Here:
$1,891
State:
$4,746
(% of AGI for various income ranges: 5.8% for AGIs below $10k, 1.0% for AGIs $10k-25k, 0.5% for AGIs $25k-50k, 0.6% for AGIs $50k-75k, 0.7% for AGIs $75k-100k, 1.0% for AGIs over 100k)
Net capital gain/loss: +$5,590 (reported on 28.6% of returns)
Here:
+$5,590
State:
+$23,418
(% of AGI for various income ranges: -1.5% for AGIs below $10k, -0.1% for AGIs $10k-25k, -0.4% for AGIs $25k-50k, 0.3% for AGIs $50k-75k, 0.7% for AGIs $75k-100k, 5.7% for AGIs over 100k)
Profit/loss from business: +$13,287 (reported on 15.4% of returns)
Here:
+$13,287
State:
+$16,826
(% of AGI for various income ranges: 0.0% for AGIs below $10k, 7.2% for AGIs $10k-25k, 4.0% for AGIs $25k-50k, 3.3% for AGIs $50k-75k, 2.5% for AGIs $75k-100k, 3.4% for AGIs over 100k)
IRA payment deduction: $3,275 (reported on 3.1% of returns)
95132:
$3,275
California:
$3,192
(% of AGI for various income ranges: 0.4% for AGIs below $10k, 0.3% for AGIs $10k-25k, 0.3% for AGIs $25k-50k, 0.2% for AGIs $50k-75k, 0.2% for AGIs $75k-100k, 0.1% for AGIs over 100k)
Self-employed pension: $13,022 (reported on 1.0% of returns)
Here:
$13,022
California:
$17,688
(% of AGI for various income ranges: 0.1% for AGIs $25k-50k, 0.2% for AGIs $50k-75k, 0.1% for AGIs $75k-100k, 0.3% for AGIs over 100k)
Total itemized deductions: $25,648 (27% of AGI, reported on 44.6% of returns)
Here:
$25,648
State:
$28,113
Here:
26.8% of AGI
State:
25.3% of AGI
(% of AGI for various income ranges: 46.7% for AGIs below $10k, 14.8% for AGIs $10k-25k, 16.9% for AGIs $25k-50k, 21.1% for AGIs $50k-75k, 23.3% for AGIs $75k-100k, 19.5% for AGIs over 100k)
Charity contributions deductions: $2,438 (2% of AGI, reported on 38.9% of returns)
Here:
$2,438
State:
$3,923
Here:
2.5% of AGI
State:
3.3% of AGI
(% of AGI for various income ranges: 1.2% for AGIs below $10k, 0.8% for AGIs $10k-25k, 1.3% for AGIs $25k-50k, 1.7% for AGIs $50k-75k, 1.9% for AGIs $75k-100k, 1.8% for AGIs over 100k)
Total tax: $8,545 (reported on 79.3% of returns)
95132:
$8,545
State:
$10,761
(% of AGI for various income ranges: 7.1% for AGIs below $10k, 4.5% for AGIs $10k-25k, 6.8% for AGIs $25k-50k, 8.9% for AGIs $50k-75k, 9.7% for AGIs $75k-100k, 15.8% for AGIs over 100k)
Earned income credit: $1,542 (reported on 11.2% of returns)
Here:
$1,542
State:
$1,763
Percentage of individuals using paid preparers for their 2004 taxes: 59.5%
Here:
60%
State:
66%
(% for various income ranges: 52.5% for AGIs below $10k, 62.5% for AGIs $10k-25k, 63.3% for AGIs $25k-50k, 63.8% for AGIs $50k-75k, 57.5% for AGIs $75k-100k, 55.0% for AGIs over 100k)
Likely homosexual households (counted as self-reported same-sex unmarried-partner households)
Lesbian couples: 0.0% of all households
Gay men: 0.1% of all households
Household received Food Stamps/SNAP in the past 12 months: 964 Household did not receive Food Stamps/SNAP in the past 12 months: 11,164
Women who had a birth in the past 12 months: 335 (235 now married, 99 unmarried) Women who did not have a birth in the past 12 months: 8,523 (3,852 now married, 4,651 unmarried)
Housing units in zip code 95132 with a mortgage: 6,041 (763 second mortgage, 36 home equity loan, 576 both second mortgage and home equity loan) Houses without a mortgage: 182
Median monthly owner costs for units with a mortgage: $3,806 Median monthly owner costs for units without a mortgage: $956
Residents with income below the poverty level in 2022:
This zip code:
8.5%
Whole state:
12.2%
Residents with income below 50% of the poverty level in 2022:
This zip code:
4.3%
Whole state:
6.2%
Median number of rooms in houses and condos:
Here:
6.4
State:
6.0
Median number of rooms in apartments:
Here:
4.9
State:
3.9
Notable locations in this zip code not listed on our city pages
Notable locations in zip code 95132: Calaveras Test Site (A), Spring Valley Volunteer Fire Department (B), Berryessa Branch San Jose Public Library (C), San Jose Fire Department Station 23 (D), San Jose Fire Department Station 19 (E). Display/hide their locations on the map
Shopping Centers: Piedmont Hills Shopping Center (1), Milpitas Mall Shopping Center (2), Berryessa Corners Shopping Center (3), Northwood Plaza Shopping Center (4). Display/hide their locations on the map
Churches in zip code 95132 include: Berryessa Baptist Fellowship Church (A), Berryessa Evangelical Free Church (B), Christ the Life Lutheran Church (C), The Church of Jesus Christ of Latter Day Saints (D), Kingdom Hall of Jehovahs Witnesses (E), Korean Presbyterian Church (F), Lewis Memorial Christian Church (G), Saint Victors Church (H). Display/hide their locations on the map
Streams, rivers, and creeks: Crosley Creek (A), Arroyo Hondo (B), Smith Creek (C), Isabel Creek (D), Sierra Creek (E), Sweigert Creek (F). Display/hide their locations on the map
Parks in zip code 95132 include: Alum Rock Park (1), Berryessa Creek Park (2), Cataldi Park (3), Noble Park (4), Penitencia Creek County Park (5). Display/hide their locations on the map
5,342 married couples with children.
675 single-parent households (296 men, 379 women).
32.8% of residents of 95132 zip code speak English at home.
10.1% of residents speak Spanish at home (62% very well, 21% well, 14% not well, 3% not at all).
6.1% of residents speak other Indo-European language at home (75% very well, 18% well, 6% not well, 1% not at all).
51.1% of residents speak Asian or Pacific Island language at home (52% very well, 28% well, 16% not well, 4% not at all).
0.1% of residents speak other language at home (88% very well, 12% well).
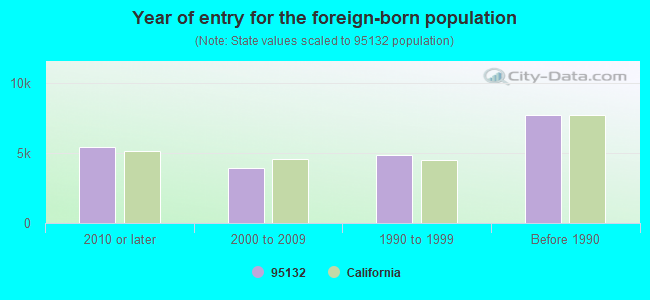
Foreign born population: 21,346 (52.5%) (69.0% of them are naturalized citizens)
Facilities with environmental interests located in this zip code:
JOSEPHS CLEANERS (2544 BERRYESSA ROAD in SAN JOSE, CA)
STATE MASTER (California - Hazardous Waste Tracking) - HAZARDOU WASTE PROGRAM CRITERIA AND HAZARDOUS AIR POLLUTANT INVENTORY (Inventory of air pollution sources) Small Quantity Generators, between 100 kg and 1000 kg of hazardous waste/month (Resource Conservation and Recovery Act (tracking hazardous waste)) - notification Business SIC classification: DRYCLEANING PLANTS, EXCEPT RUG CLEANING Organizations: LEE, BYUNG M (CONTACT/OWNER)
MILLAN TRUCKING (3396 LANDESS AVE #A in SAN JOSE, CA)
STATE MASTER (California - Hazardous Waste Tracking) - HAZARDOU WASTE PROGRAM TRANSPORTER (Resource Conservation and Recovery Act (tracking hazardous waste)) Business NAICS classification: HAZARDOUS WASTE COLLECTION. Organizations: JULIO MILLAN (CONTACT/OPERATOR)
EXXON S/S 7-3664 (1898 N CAPITAL in SAN JOSE, CA)
STATE MASTER (California - Hazardous Waste Tracking) - HAZARDOU WASTE PROGRAM Small Quantity Generators, between 100 kg and 1000 kg of hazardous waste/month (Resource Conservation and Recovery Act (tracking hazardous waste)) - notification Organizations: EXXON MOBIL (CONTACT/OWNER)
Alternative names: EXXON MOBIL CORPORATION #736640, EXXON RAS NO 73664
LANEVIEW ELEMENTARY (2095 WARMWOOD LANE in SAN JOSE, CA)
(National Center for Education Statistics) - STATE ID-6046361 Organizations: BERRYESSA UNION ELEMENTARY (SCHOOL DISTRICT)
MAJESTIC WAY ELEMENTARY (1855 MAJESTIC WAY in SAN JOSE, CA)
(National Center for Education Statistics) - STATE ID-6095343 Organizations: BERRYESSA UNION ELEMENTARY (SCHOOL DISTRICT)
CHERRYWOOD ELEMENTARY (2500 GREENGATE DR. in SAN JOSE, CA)
(National Center for Education Statistics) - STATE ID-6089288 Organizations: BERRYESSA UNION ELEMENTARY (SCHOOL DISTRICT)
MORRILL MIDDLE (1970 MORRILL AVE. in SAN JOSE, CA)
(National Center for Education Statistics) - STATE ID-6068928 Organizations: BERRYESSA UNION ELEMENTARY (SCHOOL DISTRICT)
NOBLE ELEMENTARY (3466 GROSSMONT DR. in SAN JOSE, CA)
(National Center for Education Statistics) - STATE ID-6046379 Organizations: BERRYESSA UNION ELEMENTARY (SCHOOL DISTRICT)
NORTHWOOD ELEMENTARY (2760 TRIMBLE ROAD in SAN JOSE, CA)
(National Center for Education Statistics) - STATE ID-6046387 Organizations: BERRYESSA UNION ELEMENTARY (SCHOOL DISTRICT)
GURJIT S CHAKAL (1265 N CAPITOL AVE in SAN JOSE, CA)
TRANSPORTER (Resource Conservation and Recovery Act (tracking hazardous waste)) Business NAICS classification: SOLID WASTE COLLECTION.; HAZARDOUS WASTE COLLECTION.
ALLEN WONG (2029 AGUA VISTA in SAN JOSE, CA)
COMPLIANCE ACTIVITY (Tracking inspections of insecticide, fungicide, and rodenticide, and toxic substances) Business SIC classification: OPERATORS OF APARTMENT BUILDINGS
HALO DATA DEVICES (1971 N CAPITOL AVE STE A in SAN JOSE, CA)
Small Quantity Generators, between 100 kg and 1000 kg of hazardous waste/month (Resource Conservation and Recovery Act (tracking hazardous waste)) - notification
MILPITAS CHRISTIAN SCHOOL (3435 BIRCHWOOD LN in SAN JOSE, CA)
COMPLIANCE ACTIVITY (Tracking inspections of insecticide, fungicide, and rodenticide, and toxic substances)
Housing units lacking complete plumbing facilities: 0.2% Housing units lacking complete kitchen facilities: 0.6%
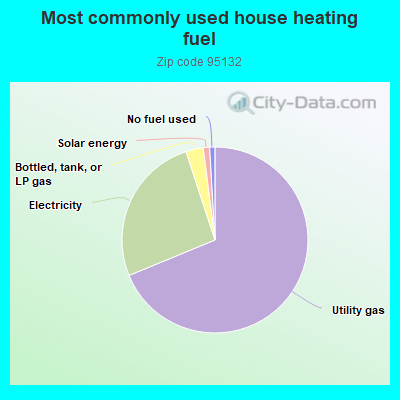
68.3%Utility gas
26.0%Electricity
3.0%Bottled, tank, or LP gas
1.1%Solar energy
0.9%No fuel used
Population in 1990: 37,995. Population change in the 1990s: +2,568 (+6.8%).
Place of birth for U.S.-born residents:
This state: 15,966
Northeast: 792
Midwest: 709
South: 793
West: 652
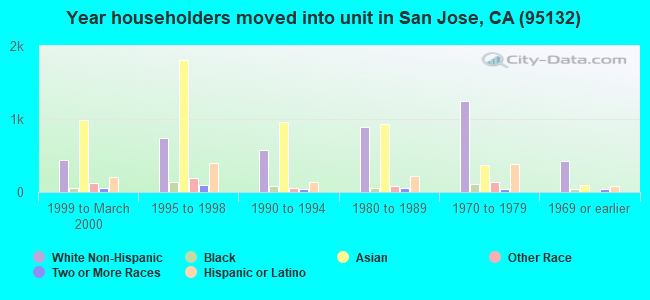
63% of the 95132 zip code residents lived in the same house 5 years ago. Out of people who lived in different houses, 75% lived in this county. Out of people who lived in different counties, 50% lived in California.
90% of the 95132 zip code residents lived in the same house 1 year ago. Out of people who lived in different houses, 70% moved from this county. Out of people who lived in different houses, 9% moved from different county within same state. Out of people who lived in different houses, 6% moved from different state. Out of people who lived in different houses, 16% moved from abroad.
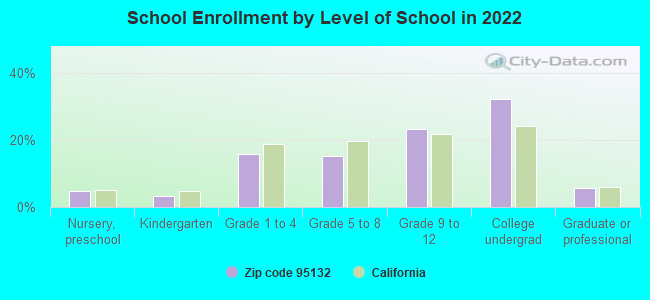
Private vs. public school enrollment:
Students in private schools in grades 1 to 8 (elementary and middle school): 785
Here:
27.4%
California:
10.5%
Students in private schools in grades 9 to 12 (high school): 245
Here:
11.6%
California:
8.5%
Students in private undergraduate colleges: 307
Here:
10.6%
California:
15.9%
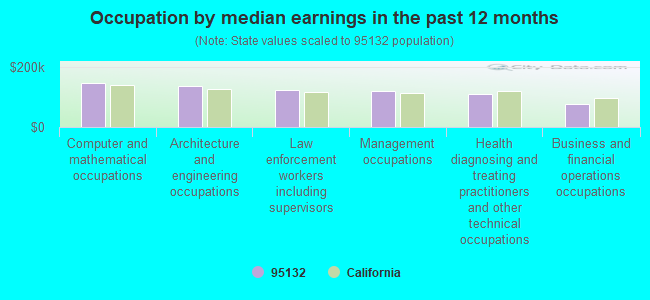
Occupation by median earnings in the past 12 months ($)
146,521Computer and mathematical occupations
137,476Architecture and engineering occupations
122,892Law enforcement workers including supervisors
118,514Management occupations
110,854Health diagnosing and treating practitioners and other technical occupations
76,558Business and financial operations occupations
Companies with federal contracts located in this zip code (SAN JOSE, CA):
LUTEN DATA SYSTEMS (5515 SIERRA RD; small business) : $198,000 in 2 contractsfrom 2000 to 2001
$99,000 with Army for Other Professional Services. Taking place in AL. Signed on 2001-02-08. Completion date: 2001-12-31.
$99,000 with Army for ADP Systems Development Services. Signed on 2000-03-29. Completion date: 2001-12-31.
MA LABORATORIES INC (2075 N CAPITOL AVE; small business) : $133,213 in 3 contractsfrom 2002 to 2003
$112,290 with Department of Defense for Electrical and Electronic assemblies, Boards, Cards, and Associated Hardware. Taking place in AL. Signed on 2002-07-02. Completion date: 2002-08-02.
$17,257 with Army for ADPE System Configuration. Signed on 2003-08-08. Completion date: 2004-08-12.
$3,666 with Army for ADP Support Equipment. Signed on 2003-09-28. Completion date: 2003-10-06.
ACTIVE TECHNOLOGIES, INC (1512 SCARAWAY DRIVE; small business)
$99,979 with Air Force for Miscellaneous Service and Trade Equipment. Signed on 2003-09-22. Completion date: 2003-11-30.
CGO (3260 CLOVEWOOD LN; small business)
$99,570 with Army for Other Defense -- Basic Research (R&D). Signed on 2006-06-26. Completion date: 2006-12-31.
Top industries in this zip code by the number of employees in 2005:
2010 - 2018 National Fire Incident Reporting System (NFIRS) incidents
According to the data from the years 2010 - 2018 the average number of fires per year is 55. The highest number of fire incidents - 165 took place in 2017, and the least - 1 in 2014. The data has a declining trend.
When looking into fire subcategories, the most reports belonged to: Outside Fires (57.4%), and Structure Fires (22.6%).
Fire incident types reported to NFIRS in Zip Code 95132
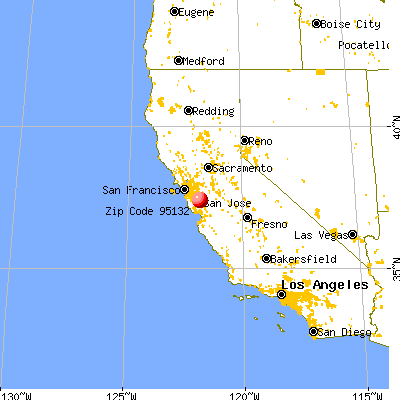


 Nearest zip codes: 95127, 95148, 95133, 95116, 95035, 95122.
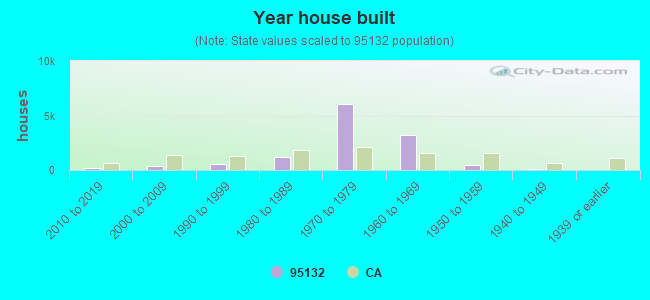


 According to the data from the years 2010 - 2018 the average number of fires per year is 55. The highest number of fire incidents - 165 took place in 2017, and the least - 1 in 2014. The data has a declining trend.
 When looking into fire subcategories, the most reports belonged to: Outside Fires (57.4%), and Structure Fires (22.6%).