Estimated zip code population in 2022: 8,175 Zip code population in 2010: 7,273 Zip code population in 2000: 6,310
Houses and condos: 2,935 Renter-occupied apartments: 941
% of renters here:
34%
State:
44%
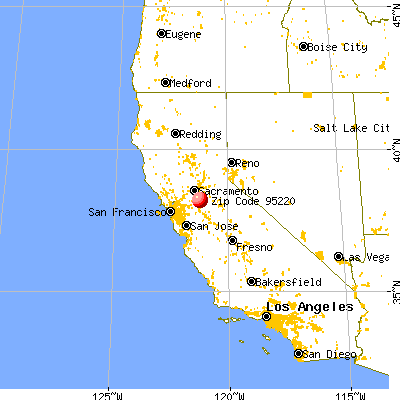
March 2022 cost of living index in zip code 95220: 98.4 (near average, U.S. average is 100)
Land area: 57.6 sq. mi. Water area: 0.8 sq. mi.
Population density: 142 people per square mile
(very low).
OSM Map
General Map
Google Map
MSN Map
OSM Map
General Map
Google Map
MSN Map
OSM Map
General Map
Google Map
MSN Map
OSM Map
General Map
Google Map
MSN Map
Please wait while loading the map...
Real estate property taxes paid for housing units in 2022:
This zip code:
0.7% ($5,329)
California:
0.7% ($4,831)
Median real estate property taxes paid for housing units with mortgages in 2022: $5,785 (0.7%) Median real estate property taxes paid for housing units with no mortgage in 2022: $4,145 (0.6%)
Business Search- 14 Million verified businesses
Males: 4,283
(52.4%)
Females: 3,892
(47.6%)
For population 25 years and over in 95220:
High school or higher: 83.0%
Bachelor's degree or higher: 24.9%
Graduate or professional degree: 9.5%
Unemployed: 6.0%
Mean travel time to work (commute): 26.9 minutes
For population 15 years and over in 95220:
Never married: 30.0%
Now married: 53.6%
Separated: 2.9%
Widowed: 6.2%
Divorced: 7.2%
Zip code 95220 compared to state average:
Black race population percentage significantly below state average.
Foreign-born population percentage below state average.
Length of stay since moving in significantly above state average.
Number of rooms per house above state average.
Number of college students below state average.
Percentage of population with a bachelor's degree or higher below state average.
Estimated median house/condo value in 2022: $782,571
95220:
$782,571
California:
$715,900
According to our research of California and other state lists, there were 12 registered sex offenders living in 95220 zip code as of May 28, 2024. The ratio of all residents to sex offenders in zip code 95220 is 623 to 1. The ratio of registered sex offenders to all residents in this zip code is near the state average.
Median resident age:
This zip code:
40.5 years
California median age:
37.9 years
Average household size:
This zip code:
3.0 people
California:
2.8 people
Averages for the 2020 tax year for zip code 95220, filed in 2021:
Average Adjusted Gross Income (AGI) in 2020: $88,513 (Individual Income Tax Returns)
Here:
$88,513
State:
$95,910
Salary/wage: $65,167 (reported on 77.8% of returns)
Here:
$65,167
State:
$77,331
(% of AGI for various income ranges: 1432.7% for AGIs below $25k, 4084.2% for AGIs $25k-50k, 7597.5% for AGIs $50k-75k, 10306.7% for AGIs $75k-100k, 19093.3% for AGIs $100k-200k, 104388.0% for AGIs over 200k)
Taxable interest for individuals: $1,876 (reported on 36.6% of returns)
This zip code:
$1,876
California:
$2,294
(% of AGI for various income ranges: 15.6% for AGIs below $25k, 34.4% for AGIs $25k-50k, 88.6% for AGIs $50k-75k, 71.3% for AGIs $75k-100k, 166.7% for AGIs $100k-200k, 2404.0% for AGIs over 200k)
Ordinary dividends: $10,706 (reported on 16.3% of returns)
Here:
$10,706
State:
$10,949
(% of AGI for various income ranges: 32.9% for AGIs below $25k, 35.4% for AGIs $25k-50k, 159.6% for AGIs $50k-75k, 147.3% for AGIs $75k-100k, 319.6% for AGIs $100k-200k, 7702.0% for AGIs over 200k)
Net capital gain/loss in AGI: +$41,255 (reported on 16.9% of returns)
Here:
+$41,255
State:
+$49,306
(% of AGI for various income ranges: 1.6% for AGIs below $25k, 31.3% for AGIs $25k-50k, 112.1% for AGIs $50k-75k, 189.3% for AGIs $75k-100k, 692.9% for AGIs $100k-200k, 40512.0% for AGIs over 200k)
Profit/loss from business: +$28,373 (reported on 15.7% of returns)
Here:
+$28,373
State:
+$15,671
(% of AGI for various income ranges: 194.4% for AGIs below $25k, 237.1% for AGIs $25k-50k, 392.9% for AGIs $50k-75k, 151.3% for AGIs $75k-100k, 865.4% for AGIs $100k-200k, 17256.0% for AGIs over 200k)
Taxable individual retirement arrangement distribution: $17,292 (reported on 7.7% of returns)
95220:
$17,292
California:
$23,505
(% of AGI for various income ranges: 48.9% for AGIs below $25k, 59.4% for AGIs $25k-50k, 233.2% for AGIs $50k-75k, 397.3% for AGIs $75k-100k, 650.4% for AGIs $100k-200k, 1802.0% for AGIs over 200k)
Self-employed (Keogh) retirement plans: $29,033 (reported on 0.9% of returns)
95220:
$29,033
California:
$30,163
(% of AGI for various income ranges: 362.9% for AGIs $100k-200k)
Total itemized deductions: $41,719 (reported on 14.5% of returns)
Here:
$41,719
State:
$39,517
(% of AGI for various income ranges: 113.9% for AGIs below $25k, 130.0% for AGIs $25k-50k, 521.4% for AGIs $50k-75k, 1088.7% for AGIs $75k-100k, 2391.7% for AGIs $100k-200k, 18786.0% for AGIs over 200k)
Charity contributions: $16,086 (reported on 10.8% of returns)
Here:
$16,086
State:
$12,598
(% of AGI for various income ranges: 26.9% for AGIs $25k-50k, 63.2% for AGIs $50k-75k, 160.0% for AGIs $75k-100k, 430.0% for AGIs $100k-200k, 8082.0% for AGIs over 200k)
Taxes paid: $8,362 (reported on 14.5% of returns)
95220:
$8,362
State:
$8,807
(% of AGI for various income ranges: 20.5% for AGIs below $25k, 26.5% for AGIs $25k-50k, 133.2% for AGIs $50k-75k, 299.3% for AGIs $75k-100k, 663.3% for AGIs $100k-200k, 2502.0% for AGIs over 200k)
Earned income credit: $2,169 (reported on 13.8% of returns)
Here:
$2,169
State:
$2,074
(% of AGI for various income ranges: 92.7% for AGIs below $25k, 77.1% for AGIs $25k-50k)
Percentage of individuals using paid preparers for their 2020 taxes: 92.6%
Here:
93%
State:
92%
(% for various income ranges: 91.9% for AGIs below $25k, 91.2% for AGIs $25k-50k, 93.8% for AGIs $50k-75k, 92.3% for AGIs $75k-100k, 93.9% for AGIs $100k-200k, 95.7% for AGIs over 200k)
Averages for the 2012 tax year for zip code 95220, filed in 2013:
Average Adjusted Gross Income (AGI) in 2012: $74,002 (Individual Income Tax Returns)
Here:
$74,002
State:
$72,726
Salary/wage: $52,704 (reported on 78.5% of returns)
Here:
$52,704
State:
$59,079
(% of AGI for various income ranges: 68.7% for AGIs below $25k, 73.6% for AGIs $25k-50k, 66.5% for AGIs $50k-75k, 65.7% for AGIs $75k-100k, 68.3% for AGIs $100k-200k, 33.9% for AGIs over 200k)
Taxable interest for individuals: $1,661 (reported on 38.1% of returns)
This zip code:
$1,661
California:
$2,146
(% of AGI for various income ranges: 1.4% for AGIs below $25k, 0.6% for AGIs $25k-50k, 0.8% for AGIs $50k-75k, 0.6% for AGIs $75k-100k, 0.5% for AGIs $100k-200k, 1.1% for AGIs over 200k)
Ordinary dividends: $8,025 (reported on 18.0% of returns)
Here:
$8,025
State:
$9,308
(% of AGI for various income ranges: 1.3% for AGIs below $25k, 1.1% for AGIs $25k-50k, 1.0% for AGIs $50k-75k, 1.6% for AGIs $75k-100k, 1.2% for AGIs $100k-200k, 3.2% for AGIs over 200k)
Net capital gain/loss in AGI: +$23,796 (reported on 16.3% of returns)
Here:
+$23,796
State:
+$30,460
(% of AGI for various income ranges: 0.3% for AGIs $25k-50k, 0.4% for AGIs $50k-75k, 0.4% for AGIs $75k-100k, 1.9% for AGIs $100k-200k, 12.8% for AGIs over 200k)
Profit/loss from business: +$23,298 (reported on 17.3% of returns)
Here:
+$23,298
State:
+$17,064
(% of AGI for various income ranges: 10.5% for AGIs below $25k, 6.1% for AGIs $25k-50k, 7.3% for AGIs $50k-75k, 2.5% for AGIs $75k-100k, 3.3% for AGIs $100k-200k, 6.3% for AGIs over 200k)
Taxable individual retirement arrangement distribution: $19,511 (reported on 9.7% of returns)
95220:
$19,511
California:
$19,557
(% of AGI for various income ranges: 2.7% for AGIs below $25k, 1.5% for AGIs $25k-50k, 2.9% for AGIs $50k-75k, 3.5% for AGIs $75k-100k, 2.4% for AGIs $100k-200k, 2.6% for AGIs over 200k)
Self-employment retirement plans: $22,967 (reported on 1.0% of returns)
95220:
$22,967
California:
$24,530
Total itemized deductions: $33,623 (22% of AGI, reported on 36.3% of returns)
Here:
$33,623
State:
$34,004
Here:
22.4% of AGI
State:
22.7% of AGI
(% of AGI for various income ranges: 10.5% for AGIs below $25k, 11.0% for AGIs $25k-50k, 16.4% for AGIs $50k-75k, 17.8% for AGIs $75k-100k, 19.8% for AGIs $100k-200k, 16.5% for AGIs over 200k)
Charity contributions: $4,618 (reported on 29.4% of returns)
Here:
$4,618
State:
$4,659
(% of AGI for various income ranges: 0.4% for AGIs below $25k, 1.0% for AGIs $25k-50k, 1.5% for AGIs $50k-75k, 2.1% for AGIs $75k-100k, 2.1% for AGIs $100k-200k, 2.2% for AGIs over 200k)
Taxes paid: $13,179 (reported on 36.0% of returns)
95220:
$13,179
State:
$14,448
(% of AGI for various income ranges: 2.4% for AGIs below $25k, 2.5% for AGIs $25k-50k, 4.2% for AGIs $50k-75k, 5.4% for AGIs $75k-100k, 7.2% for AGIs $100k-200k, 8.6% for AGIs over 200k)
Earned income credit: $2,382 (reported on 17.0% of returns)
Here:
$2,382
State:
$2,286
(% of AGI for various income ranges: 6.3% for AGIs below $25k, 1.3% for AGIs $25k-50k)
Percentage of individuals using paid preparers for their 2012 taxes: 65.4%
Here:
65%
State:
64%
(% for various income ranges: 58.2% for AGIs below $25k, 62.1% for AGIs $25k-50k, 72.7% for AGIs $50k-75k, 70.4% for AGIs $75k-100k, 75.6% for AGIs $100k-200k, 83.3% for AGIs over 200k)
Averages for the 2004 tax year for zip code 95220, filed in 2005:
Average Adjusted Gross Income (AGI) in 2004: $59,886 (Individual Income Tax Returns)
Here:
$59,886
State:
$58,600
Salary/wage: $45,490 (reported on 78.9% of returns)
Here:
$45,490
State:
$49,455
(% of AGI for various income ranges: 70.2% for AGIs $10k-25k, 74.4% for AGIs $25k-50k, 72.5% for AGIs $50k-75k, 75.8% for AGIs $75k-100k, 44.3% for AGIs over 100k)
Taxable interest for individuals: $2,079 (reported on 50.8% of returns)
This zip code:
$2,079
California:
$2,365
(% of AGI for various income ranges: 2.2% for AGIs $10k-25k, 1.2% for AGIs $25k-50k, 1.5% for AGIs $50k-75k, 1.0% for AGIs $75k-100k, 1.8% for AGIs over 100k)
Taxable dividends: $3,672 (reported on 23.6% of returns)
Here:
$3,672
State:
$4,746
(% of AGI for various income ranges: 1.3% for AGIs $10k-25k, 1.1% for AGIs $25k-50k, 1.5% for AGIs $50k-75k, 0.5% for AGIs $75k-100k, 1.6% for AGIs over 100k)
Net capital gain/loss: +$25,559 (reported on 20.8% of returns)
Here:
+$25,559
State:
+$23,418
(% of AGI for various income ranges: 0.6% for AGIs $10k-25k, 0.8% for AGIs $25k-50k, 0.1% for AGIs $50k-75k, 1.9% for AGIs $75k-100k, 15.4% for AGIs over 100k)
Profit/loss from business: +$20,525 (reported on 16.9% of returns)
Here:
+$20,525
State:
+$16,826
(% of AGI for various income ranges: 7.4% for AGIs $10k-25k, 6.2% for AGIs $25k-50k, 5.8% for AGIs $50k-75k, 7.6% for AGIs $75k-100k, 4.6% for AGIs over 100k)
IRA payment deduction: $3,658 (reported on 2.8% of returns)
95220:
$3,658
California:
$3,192
(% of AGI for various income ranges: 0.4% for AGIs $25k-50k, 0.3% for AGIs $50k-75k, 0.2% for AGIs $75k-100k, 0.1% for AGIs over 100k)
Self-employed pension: $13,765 (reported on 1.2% of returns)
Here:
$13,765
California:
$17,688
Total itemized deductions: $26,497 (23% of AGI, reported on 38.4% of returns)
Here:
$26,497
State:
$28,113
Here:
22.6% of AGI
State:
25.3% of AGI
(% of AGI for various income ranges: 12.5% for AGIs $10k-25k, 15.0% for AGIs $25k-50k, 20.1% for AGIs $50k-75k, 21.1% for AGIs $75k-100k, 15.5% for AGIs over 100k)
Charity contributions deductions: $3,521 (3% of AGI, reported on 33.2% of returns)
Here:
$3,521
State:
$3,923
Here:
2.8% of AGI
State:
3.3% of AGI
(% of AGI for various income ranges: 1.1% for AGIs $10k-25k, 1.2% for AGIs $25k-50k, 1.8% for AGIs $50k-75k, 2.4% for AGIs $75k-100k, 2.1% for AGIs over 100k)
Total tax: $10,588 (reported on 74.0% of returns)
95220:
$10,588
State:
$10,761
(% of AGI for various income ranges: 4.2% for AGIs $10k-25k, 6.6% for AGIs $25k-50k, 8.7% for AGIs $50k-75k, 10.3% for AGIs $75k-100k, 17.2% for AGIs over 100k)
Earned income credit: $1,771 (reported on 12.8% of returns)
Here:
$1,771
State:
$1,763
Percentage of individuals using paid preparers for their 2004 taxes: 70.4%
Here:
70%
State:
66%
(% for various income ranges: 60.7% for AGIs below $10k, 65.7% for AGIs $10k-25k, 70.4% for AGIs $25k-50k, 75.4% for AGIs $50k-75k, 77.0% for AGIs $75k-100k, 82.5% for AGIs over 100k)
Likely homosexual households (counted as self-reported same-sex unmarried-partner households)
Lesbian couples: 0.0% of all households
Gay men: 0.8% of all households
Household received Food Stamps/SNAP in the past 12 months: 407 Household did not receive Food Stamps/SNAP in the past 12 months: 2,335
Women who had a birth in the past 12 months: 124 (118 now married, 5 unmarried) Women who did not have a birth in the past 12 months: 1,837 (852 now married, 979 unmarried)
Housing units in zip code 95220 with a mortgage: 1,187 (132 second mortgage, 97 both second mortgage and home equity loan) Houses without a mortgage: 12
Median monthly owner costs for units with a mortgage: $3,034 Median monthly owner costs for units without a mortgage: $963
Residents with income below the poverty level in 2022:
This zip code:
6.2%
Whole state:
12.2%
Residents with income below 50% of the poverty level in 2022:
This zip code:
3.2%
Whole state:
6.2%
Median number of rooms in houses and condos:
Here:
7.4
State:
6.0
Median number of rooms in apartments:
Here:
5.2
State:
3.9
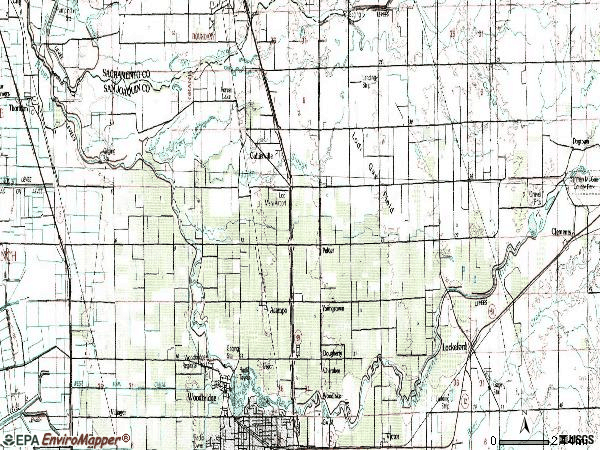
Notable locations in this zip code not listed on our city pages
Notable locations in zip code 95220: Colony Substation (A), S and R Egg Ranch (B), Palmer Farms (C), De Wit Dairy (D), Silva Brothers Dairy (E), Forest Lake Golf Course (F), Dry Creek Ranch Golf Course (G), Mediplane - Reach II (H), Liberty Rural Fire Protection District (I), Woodbridge Fire Protection District Station 3 (J). Display/hide their locations on the map
Size of family households: 750 2-persons, 452 3-persons, 357 4-persons, 376 5-persons, 60 6-persons, 58 7-or-more-persons
Size of nonfamily households: 450 1-person, 144 2-persons, 71 3-persons
1,309 married couples with children.
377 single-parent households (98 men, 279 women).
70.5% of residents of 95220 zip code speak English at home.
26.5% of residents speak Spanish at home (52% very well, 17% well, 17% not well, 14% not at all).
0.9% of residents speak other Indo-European language at home (100% very well).
1.9% of residents speak Asian or Pacific Island language at home (68% very well, 23% well, 4% not well, 5% not at all).
0.1% of residents speak other language at home (100% very well).
Foreign born population: 1,301 (15.9%) (32.6% of them are naturalized citizens)
This zip code:
15.9%
Whole state:
26.7%
66%Honduras
13%Uruguay
4%Malaysia
3%Micronesia
2%Mexico
2%Italy
2%Taiwan
9%German
8%American
5%Belgian
4%Italian
4%English
4%Portuguese
2%European
Year of entry for the foreign-born population
1572010 or later
4082000 to 2009
4681990 to 1999
314Before 1990
Facilities with environmental interests located in this zip code:
CHEVRON STATION NO 92396 (25651 N HWY 99 in ACAMPO, CA)
STATE MASTER (California - Hazardous Waste Tracking) - HAZARDOU WASTE PROGRAM CRITERIA AND HAZARDOUS AIR POLLUTANT INVENTORY (Inventory of air pollution sources) Small Quantity Generators, between 100 kg and 1000 kg of hazardous waste/month (Resource Conservation and Recovery Act (tracking hazardous waste)) - notification Business SIC classification: GASOLINE SERVICE STATIONS Organizations: CHEVRON PRODUCTS CO (CONTACT/OWNER)
Alternative names: CHEVRON USA PRODUCTS COMPANY
BAEZ AND SONS TRUCKING DBA C AND R TRUCK (3910 E CALIMYRNA RD in ACAMPO, CA)
STATE MASTER (California - Hazardous Waste Tracking) - HAZARDOU WASTE PROGRAM TRANSPORTER (Resource Conservation and Recovery Act (tracking hazardous waste)) - notification Business NAICS classification: HAZARDOUS WASTE COLLECTION. Organizations: RAFAEL BAEZ (CONTACT/OPERATOR)
Alternative names: BAEZ & SONS, RAFAEL BAEZ
HOUSTON ELEMENTARY (4600 E. ACAMPO ROAD in ACAMPO, CA)
(National Center for Education Statistics) - STATE ID-6042121 Organizations: LODI UNIFIED (SCHOOL DISTRICT)
CALIFORNIA CONCENTRATES (18678 N HWY 99 in ACAMPO, CA)
National Pollutant Discharge Elimination System NON-MAJOR (Tracking pollutant discharge elimination systems) - permit
MARGARET AND JERYL R FRY JR (2720 E ACAMPO RD in ACAMPO, CA)
Small Quantity Generators, between 100 kg and 1000 kg of hazardous waste/month (Resource Conservation and Recovery Act (tracking hazardous waste))
Housing units lacking complete plumbing facilities: 0.6% Housing units lacking complete kitchen facilities: 3.4%
30.4%Electricity
28.5%Utility gas
26.3%Bottled, tank, or LP gas
9.5%Wood
2.7%Solar energy
1.3%Fuel oil, kerosene, etc.
1.1%Other fuel
Population in 1990: 7,734.
Place of birth for U.S.-born residents:
This state: 6,158
Northeast: 114
Midwest: 209
South: 202
West: 135
63% of the 95220 zip code residents lived in the same house 5 years ago. Out of people who lived in different houses, 58% lived in this county. Out of people who lived in different counties, 50% lived in California.
91% of the 95220 zip code residents lived in the same house 1 year ago. Out of people who lived in different houses, 66% moved from this county. Out of people who lived in different houses, 4% moved from different county within same state. Out of people who lived in different houses, 26% moved from different state. Out of people who lived in different houses, 4% moved from abroad.
Private vs. public school enrollment:
Students in private schools in grades 1 to 8 (elementary and middle school): 120
Here:
12.7%
California:
10.5%
Students in private schools in grades 9 to 12 (high school): 34
Here:
4.8%
California:
8.5%
Students in private undergraduate colleges: 99
Here:
36.3%
California:
15.9%
Occupation by median earnings in the past 12 months ($)
143,371Health diagnosing and treating practitioners and other technical occupations
108,617Management occupations
68,828Business and financial operations occupations
67,451Production occupations
57,765Installation, maintenance, and repair occupations
56,533Health technologists and technicians
Companies with federal contracts located in this zip code:
JOHNSON'S DRIVE IN (24335 N HIGHWAY 99 in ACAMPO, CA; small business)
$4,388 with Army for Other Professional Services. Signed on 2004-08-31. Completion date: 2004-09-09.
Top industries in this zip code by the number of employees in 2005:
Administrative and Support and Waste Management and Remediation Services: Security Guards and Patrol Services (50-99 employees: 1 establishment)
Construction: Poured Concrete Foundation and Structure Contractors (20-49: 1, 10-19: 1, 1-4: 2)
Detailed PMIC statistics for the following Tracts:0046.00
2006 - 2018 National Fire Incident Reporting System (NFIRS) incidents
According to the data from the years 2006 - 2018 the average number of fire incidents per year is 9. The highest number of reported fires - 49 took place in 2013, and the least - 0 in 2009. The data has a rising trend.
When looking into fire subcategories, the most reports belonged to: Outside Fires (59.1%), and Structure Fires (24.3%).
Fire incident types reported to NFIRS in Zip Code 95220


 Nearest zip codes: 95632, 95258, 95237, 95240, 95212, 95638.


 According to the data from the years 2006 - 2018 the average number of fire incidents per year is 9. The highest number of reported fires - 49 took place in 2013, and the least - 0 in 2009. The data has a rising trend.
 When looking into fire subcategories, the most reports belonged to: Outside Fires (59.1%), and Structure Fires (24.3%).