Estimated zip code population in 2022: 4,609 Zip code population in 2010: 3,976 Zip code population in 2000: 2,624
Houses and condos: 2,540 Renter-occupied apartments: 302
% of renters here:
17%
State:
44%
March 2022 cost of living index in zip code 95228: 96.3 (near average, U.S. average is 100)
Land area: 106.8 sq. mi. Water area: 1.3 sq. mi.
Population density: 43 people per square mile
(very low).
OSM Map
General Map
Google Map
MSN Map
OSM Map
General Map
Google Map
MSN Map
OSM Map
General Map
Google Map
MSN Map
OSM Map
General Map
Google Map
MSN Map
Please wait while loading the map...
Real estate property taxes paid for housing units in 2022:
This zip code:
0.8% ($3,451)
California:
0.7% ($4,831)
Median real estate property taxes paid for housing units with mortgages in 2022: $3,384 (0.8%) Median real estate property taxes paid for housing units with no mortgage in 2022: $3,881 (0.9%)
Business Search- 14 Million verified businesses
Males: 2,190
(47.5%)
Females: 2,418
(52.5%)
For population 25 years and over in 95228:
High school or higher: 89.5%
Bachelor's degree or higher: 20.8%
Graduate or professional degree: 5.8%
Unemployed: 7.3%
Mean travel time to work (commute): 42.5 minutes
For population 15 years and over in 95228:
Never married: 21.6%
Now married: 64.4%
Separated: 0.8%
Widowed: 2.8%
Divorced: 10.3%
Zip code 95228 compared to state average:
Median house value below state average.
Black race population percentage below state average.
Hispanic race population percentage below state average.
Median age significantly above state average.
Foreign-born population percentage significantly below state average.
Renting percentage significantly below state average.
House age significantly below state average.
Percentage of population with a bachelor's degree or higher below state average.
Averages for the 2020 tax year for zip code 95228, filed in 2021:
Average Adjusted Gross Income (AGI) in 2020: $89,781 (Individual Income Tax Returns)
Here:
$89,781
State:
$95,910
Salary/wage: $73,075 (reported on 70.8% of returns)
Here:
$73,075
State:
$77,331
(% of AGI for various income ranges: 1018.2% for AGIs below $25k, 3537.3% for AGIs $25k-50k, 5903.7% for AGIs $50k-75k, 9703.8% for AGIs $75k-100k, 19322.7% for AGIs $100k-200k, 82965.0% for AGIs over 200k)
Taxable interest for individuals: $1,229 (reported on 46.5% of returns)
This zip code:
$1,229
California:
$2,294
(% of AGI for various income ranges: 27.4% for AGIs below $25k, 19.7% for AGIs $25k-50k, 48.4% for AGIs $50k-75k, 101.9% for AGIs $75k-100k, 254.5% for AGIs $100k-200k, 780.0% for AGIs over 200k)
Ordinary dividends: $4,630 (reported on 20.4% of returns)
Here:
$4,630
State:
$10,949
(% of AGI for various income ranges: 35.5% for AGIs below $25k, 73.0% for AGIs $25k-50k, 116.3% for AGIs $50k-75k, 137.5% for AGIs $75k-100k, 371.8% for AGIs $100k-200k, 1292.5% for AGIs over 200k)
Net capital gain/loss in AGI: +$22,420 (reported on 20.4% of returns)
Here:
+$22,420
State:
+$49,306
(% of AGI for various income ranges: 17.1% for AGIs below $25k, 22.3% for AGIs $25k-50k, 93.2% for AGIs $50k-75k, 275.0% for AGIs $75k-100k, 856.4% for AGIs $100k-200k, 19200.0% for AGIs over 200k)
Profit/loss from business: +$19,755 (reported on 16.8% of returns)
Here:
+$19,755
State:
+$15,671
(% of AGI for various income ranges: 137.6% for AGIs below $25k, 326.7% for AGIs $25k-50k, 266.3% for AGIs $50k-75k, 368.8% for AGIs $75k-100k, 953.2% for AGIs $100k-200k, 7027.5% for AGIs over 200k)
Taxable individual retirement arrangement distribution: $26,100 (reported on 13.3% of returns)
95228:
$26,100
California:
$23,505
(% of AGI for various income ranges: 85.8% for AGIs below $25k, 173.7% for AGIs $25k-50k, 410.0% for AGIs $50k-75k, 698.1% for AGIs $75k-100k, 1354.5% for AGIs $100k-200k, 5267.5% for AGIs over 200k)
Total itemized deductions: $34,727 (reported on 18.1% of returns)
Here:
$34,727
State:
$39,517
(% of AGI for various income ranges: 140.8% for AGIs below $25k, 372.0% for AGIs $25k-50k, 532.6% for AGIs $50k-75k, 1076.2% for AGIs $75k-100k, 2030.0% for AGIs $100k-200k, 13467.5% for AGIs over 200k)
Charity contributions: $5,367 (reported on 13.3% of returns)
Here:
$5,367
State:
$12,598
(% of AGI for various income ranges: 21.3% for AGIs $25k-50k, 42.1% for AGIs $50k-75k, 100.0% for AGIs $75k-100k, 260.0% for AGIs $100k-200k, 1835.0% for AGIs over 200k)
Taxes paid: $8,585 (reported on 18.1% of returns)
95228:
$8,585
State:
$8,807
(% of AGI for various income ranges: 23.7% for AGIs below $25k, 87.0% for AGIs $25k-50k, 163.2% for AGIs $50k-75k, 354.4% for AGIs $75k-100k, 631.8% for AGIs $100k-200k, 2255.0% for AGIs over 200k)
Earned income credit: $2,138 (reported on 10.6% of returns)
Here:
$2,138
State:
$2,074
(% of AGI for various income ranges: 90.8% for AGIs below $25k, 56.0% for AGIs $25k-50k)
Percentage of individuals using paid preparers for their 2020 taxes: 93.4%
Here:
93%
State:
92%
(% for various income ranges: 91.4% for AGIs below $25k, 93.5% for AGIs $25k-50k, 96.6% for AGIs $50k-75k, 92.9% for AGIs $75k-100k, 93.8% for AGIs $100k-200k, 94.1% for AGIs over 200k)
Averages for the 2012 tax year for zip code 95228, filed in 2013:
Average Adjusted Gross Income (AGI) in 2012: $60,689 (Individual Income Tax Returns)
Here:
$60,689
State:
$72,726
Salary/wage: $50,998 (reported on 72.3% of returns)
Here:
$50,998
State:
$59,079
(% of AGI for various income ranges: 62.3% for AGIs below $25k, 61.3% for AGIs $25k-50k, 60.4% for AGIs $50k-75k, 64.7% for AGIs $75k-100k, 60.3% for AGIs $100k-200k, 56.8% for AGIs over 200k)
Taxable interest for individuals: $1,506 (reported on 44.1% of returns)
This zip code:
$1,506
California:
$2,146
(% of AGI for various income ranges: 1.9% for AGIs below $25k, 0.7% for AGIs $25k-50k, 1.5% for AGIs $50k-75k, 1.2% for AGIs $75k-100k, 0.8% for AGIs $100k-200k, 1.1% for AGIs over 200k)
Ordinary dividends: $4,429 (reported on 21.5% of returns)
Here:
$4,429
State:
$9,308
(% of AGI for various income ranges: 1.3% for AGIs below $25k, 1.5% for AGIs $25k-50k, 2.0% for AGIs $50k-75k, 2.3% for AGIs $75k-100k, 1.1% for AGIs $100k-200k, 1.5% for AGIs over 200k)
Net capital gain/loss in AGI: +$2,847 (reported on 19.2% of returns)
Here:
+$2,847
State:
+$30,460
(% of AGI for various income ranges: 1.2% for AGIs $50k-75k, 0.7% for AGIs $75k-100k, 3.7% for AGIs over 200k)
Profit/loss from business: +$13,949 (reported on 19.8% of returns)
Here:
+$13,949
State:
+$17,064
(% of AGI for various income ranges: 11.7% for AGIs below $25k, 5.5% for AGIs $25k-50k, 1.7% for AGIs $50k-75k, 2.4% for AGIs $75k-100k, 7.6% for AGIs $100k-200k)
Taxable individual retirement arrangement distribution: $22,932 (reported on 15.8% of returns)
95228:
$22,932
California:
$19,557
(% of AGI for various income ranges: 4.5% for AGIs below $25k, 5.1% for AGIs $25k-50k, 5.1% for AGIs $50k-75k, 5.0% for AGIs $75k-100k, 10.6% for AGIs $100k-200k)
Total itemized deductions: $27,498 (30% of AGI, reported on 46.9% of returns)
Here:
$27,498
State:
$34,004
Here:
29.5% of AGI
State:
22.7% of AGI
(% of AGI for various income ranges: 24.1% for AGIs below $25k, 18.5% for AGIs $25k-50k, 17.6% for AGIs $50k-75k, 30.3% for AGIs $75k-100k, 20.5% for AGIs $100k-200k, 18.4% for AGIs over 200k)
Charity contributions: $2,568 (reported on 37.3% of returns)
Here:
$2,568
State:
$4,659
(% of AGI for various income ranges: 1.5% for AGIs below $25k, 1.5% for AGIs $25k-50k, 1.3% for AGIs $50k-75k, 1.6% for AGIs $75k-100k, 1.8% for AGIs $100k-200k, 1.5% for AGIs over 200k)
Taxes paid: $8,770 (reported on 46.9% of returns)
95228:
$8,770
State:
$14,448
(% of AGI for various income ranges: 4.5% for AGIs below $25k, 4.3% for AGIs $25k-50k, 4.4% for AGIs $50k-75k, 6.5% for AGIs $75k-100k, 7.9% for AGIs $100k-200k, 10.7% for AGIs over 200k)
Earned income credit: $2,062 (reported on 13.6% of returns)
Here:
$2,062
State:
$2,286
(% of AGI for various income ranges: 5.2% for AGIs below $25k, 0.8% for AGIs $25k-50k)
Percentage of individuals using paid preparers for their 2012 taxes: 57.1%
Here:
57%
State:
64%
(% for various income ranges: 45.8% for AGIs below $25k, 50.0% for AGIs $25k-50k, 62.5% for AGIs $50k-75k, 70.0% for AGIs $75k-100k, 72.0% for AGIs $100k-200k, 80.0% for AGIs over 200k)
Averages for the 2004 tax year for zip code 95228, filed in 2005:
Average Adjusted Gross Income (AGI) in 2004: $55,907 (Individual Income Tax Returns)
Here:
$55,907
State:
$58,600
Salary/wage: $47,370 (reported on 73.9% of returns)
Here:
$47,370
State:
$49,455
(% of AGI for various income ranges: 159.2% for AGIs below $10k, 58.6% for AGIs $10k-25k, 65.8% for AGIs $25k-50k, 69.5% for AGIs $50k-75k, 67.6% for AGIs $75k-100k, 55.7% for AGIs over 100k)
Taxable interest for individuals: $1,684 (reported on 57.2% of returns)
This zip code:
$1,684
California:
$2,365
(% of AGI for various income ranges: 16.5% for AGIs below $10k, 2.5% for AGIs $10k-25k, 1.5% for AGIs $25k-50k, 2.1% for AGIs $50k-75k, 1.7% for AGIs $75k-100k, 1.4% for AGIs over 100k)
Taxable dividends: $3,610 (reported on 26.3% of returns)
Here:
$3,610
State:
$4,746
(% of AGI for various income ranges: 13.0% for AGIs below $10k, 1.6% for AGIs $10k-25k, 1.5% for AGIs $25k-50k, 0.8% for AGIs $50k-75k, 1.0% for AGIs $75k-100k, 2.4% for AGIs over 100k)
Net capital gain/loss: +$17,694 (reported on 25.4% of returns)
Here:
+$17,694
State:
+$23,418
(% of AGI for various income ranges: 8.7% for AGIs below $10k, -1.2% for AGIs $10k-25k, 1.1% for AGIs $25k-50k, 2.0% for AGIs $50k-75k, 4.5% for AGIs $75k-100k, 15.8% for AGIs over 100k)
Profit/loss from business: +$17,906 (reported on 20.4% of returns)
Here:
+$17,906
State:
+$16,826
(% of AGI for various income ranges: -9.7% for AGIs below $10k, 11.8% for AGIs $10k-25k, 5.3% for AGIs $25k-50k, 5.2% for AGIs $50k-75k, 6.0% for AGIs $75k-100k, 7.1% for AGIs over 100k)
IRA payment deduction: $2,837 (reported on 2.9% of returns)
95228:
$2,837
California:
$3,192
Self-employed pension: $16,429 (reported on 1.0% of returns)
Here:
$16,429
California:
$17,688
Total itemized deductions: $22,982 (28% of AGI, reported on 56.1% of returns)
Here:
$22,982
State:
$28,113
Here:
28.1% of AGI
State:
25.3% of AGI
(% of AGI for various income ranges: 135.1% for AGIs below $10k, 33.2% for AGIs $10k-25k, 23.6% for AGIs $25k-50k, 25.0% for AGIs $50k-75k, 22.6% for AGIs $75k-100k, 19.4% for AGIs over 100k)
Charity contributions deductions: $2,157 (2% of AGI, reported on 46.4% of returns)
Here:
$2,157
State:
$3,923
Here:
2.5% of AGI
State:
3.3% of AGI
(% of AGI for various income ranges: 4.0% for AGIs below $10k, 2.1% for AGIs $10k-25k, 1.7% for AGIs $25k-50k, 1.8% for AGIs $50k-75k, 1.6% for AGIs $75k-100k, 1.8% for AGIs over 100k)
Total tax: $8,610 (reported on 77.2% of returns)
95228:
$8,610
State:
$10,761
(% of AGI for various income ranges: 6.8% for AGIs below $10k, 4.7% for AGIs $10k-25k, 6.4% for AGIs $25k-50k, 8.5% for AGIs $50k-75k, 10.0% for AGIs $75k-100k, 17.1% for AGIs over 100k)
Earned income credit: $1,725 (reported on 10.4% of returns)
Here:
$1,725
State:
$1,763
Percentage of individuals using paid preparers for their 2004 taxes: 63.9%
Here:
64%
State:
66%
(% for various income ranges: 45.3% for AGIs below $10k, 60.3% for AGIs $10k-25k, 63.8% for AGIs $25k-50k, 66.1% for AGIs $50k-75k, 79.9% for AGIs $75k-100k, 75.5% for AGIs over 100k)
Likely homosexual households (counted as self-reported same-sex unmarried-partner households)
Lesbian couples: 0.0% of all households
Gay men: 0.3% of all households
Household received Food Stamps/SNAP in the past 12 months: 298 Household did not receive Food Stamps/SNAP in the past 12 months: 1,496
Women who had a birth in the past 12 months: 156 (77 now married, 80 unmarried) Women who did not have a birth in the past 12 months: 874 (360 now married, 513 unmarried)
Housing units in zip code 95228 with a mortgage: 1,117 (66 second mortgage, 37 both second mortgage and home equity loan) Houses without a mortgage: 23
Median monthly owner costs for units with a mortgage: $2,039 Median monthly owner costs for units without a mortgage: $868
Residents with income below the poverty level in 2022:
This zip code:
8.7%
Whole state:
12.2%
Residents with income below 50% of the poverty level in 2022:
This zip code:
3.8%
Whole state:
6.2%
Median number of rooms in houses and condos:
Here:
5.8
State:
6.0
Median number of rooms in apartments:
Here:
4.4
State:
3.9
Notable locations in this zip code not listed on our city pages
Notable locations in zip code 95228: Rancheria Del Rio Estanislao (A), McCarty Ranch (B), Kuhn Ranch (C), Copperopolis Fire Protection District Station 2 (D), Department of Forestry and Fire Protection Copperopolis (E), Copperopolis Fire Protection District Station 1 Headquarters (F). Display/hide their locations on the map
Creeks: Black Creek (A), Campbell Creek (B), Clover Creek (C), Copper Creek (D), Loucks Creek (E), McCarty Creek (F), Underwood Creek (G), Empire Creek (H), Smith Creek (I). Display/hide their locations on the map
In group quarters: 9 (-1 institutionalized population)
Size of family households: 703 2-persons, 257 3-persons, 271 4-persons, 110 5-persons
Size of nonfamily households: 358 1-person, 79 2-persons
424 married couples with children.
316 single-parent households (53 men, 263 women).
86.7% of residents of 95228 zip code speak English at home.
10.2% of residents speak Spanish at home (87% very well, 7% well, 6% not well).
2.4% of residents speak other Indo-European language at home (100% very well).
0.8% of residents speak Asian or Pacific Island language at home (100% very well).
Foreign born population: 254 (5.5%) (74.0% of them are naturalized citizens)
This zip code:
5.5%
Whole state:
26.7%
35%Italy
30%Honduras
13%Malaysia
9%Sweden
7%United Kingdom, excluding England and Scotland
3%India
13%Irish
8%German
7%English
5%Italian
5%Portuguese
2%American
2%Dutch
Year of entry for the foreign-born population
02010 or later
1422000 to 2009
91990 to 1999
135Before 1990
Facilities with environmental interests located in this zip code:
CALAVERAS ASBESTOS LIMITED (OBYRNES FERRY RD 7 5 MI SE OF in COPPEROPOLIS, CA)
(Integrated Compliance Information System) - ICIS-09-1988-0015, FORMAL ENFORCEMENT ACTION, ICIS-09-1984-0013, Business SIC classification: MISCELLANEOUS NONMETALLIC MINERALS, EXCEPT FUELS; GENERAL CONTRACTORS-SINGLE-FAMILY HOUSES
MERIDIAN GOLD CO (2 MILES SW OF CITY in COPPEROPOLIS, CA)
National Pollutant Discharge Elimination System NON-MAJOR (Tracking pollutant discharge elimination systems) - permit Business SIC classification: GOLD ORES
MERIDIAN MINERALS CO RMK MINE (2944 HODSON ROAD in COPPEROPOLIS, CA)
Small Quantity Generators, between 100 kg and 1000 kg of hazardous waste/month (Resource Conservation and Recovery Act (tracking hazardous waste))
ALTO MINE (SEC 29 T6NR13E; LITTLE JOHN RO in COPPEROPOLIS, CA)
CRITERIA AND HAZARDOUS AIR POLLUTANT INVENTORY (Inventory of air pollution sources) Business SIC classification: REFUSE SYSTEMS Business NAICS classification: SOLID WASTE LANDFILL.
Housing units lacking complete plumbing facilities: 2.0% Housing units lacking complete kitchen facilities: 1.9%
47.0%Bottled, tank, or LP gas
21.1%Electricity
17.4%Utility gas
7.8%Wood
5.2%Solar energy
1.7%Other fuel
Population in 1990: 1,336. Population change in the 1990s: +1,288 (+96.4%).
Place of birth for U.S.-born residents:
This state: 3,321
Northeast: 135
Midwest: 371
South: 255
West: 206
48% of the 95228 zip code residents lived in the same house 5 years ago. Out of people who lived in different houses, 18% lived in this county. Out of people who lived in different counties, 50% lived in California.
94% of the 95228 zip code residents lived in the same house 1 year ago. Out of people who lived in different houses, 18% moved from this county. Out of people who lived in different houses, 78% moved from different county within same state. Out of people who lived in different houses, 8% moved from different state. Out of people who lived in different houses, 1% moved from abroad.
Private vs. public school enrollment:
Students in private schools in grades 1 to 8 (elementary and middle school): 103
Here:
33.6%
California:
10.5%
Students in private schools in grades 9 to 12 (high school): 42
Here:
29.5%
California:
8.5%
Students in private undergraduate colleges: 72
Here:
31.2%
California:
15.9%
Occupation by median earnings in the past 12 months ($)
113,785Management occupations
109,052Architecture and engineering occupations
105,976Business and financial operations occupations
102,170Fire fighting and prevention, and other protective service workers including supervisors
93,182Construction and extraction occupations
77,759Health diagnosing and treating practitioners and other technical occupations
Top industries in this zip code by the number of employees in 2005:
Arts, Entertainment, and Recreation: Golf Courses and Country Clubs (100-249 employees: 1 establishment)
Other Services (except Public Administration): Other Similar Organizations (except Business, Professional, Labor, and Political Organizations) (5-9: 2, 1-4: 1)
Construction: Plumbing, Heating, and Air-Conditioning Contractors (10-19: 1)
Construction: Drywall and Insulation Contractors (10-19: 1)
Construction: New Single-Family Housing Construction (except Operative Builders) (5-9: 1, 1-4: 2)
Fatal accident statistics in 2010:
Fatal accident count: 2
Vehicles involved in fatal accidents: 4
Fatal accidents caused by drunken drivers: 0
Fatalities: 2
Persons involved in fatal accidents: 6
Pedestrians involved in fatal accidents: 0
2006 - 2018 National Fire Incident Reporting System (NFIRS) incidents
According to the data from the years 2006 - 2018 the average number of fire incidents per year is 37. The highest number of reported fires - 59 took place in 2017, and the least - 2 in 2006. The data has a rising trend.
When looking into fire subcategories, the most reports belonged to: Outside Fires (68.3%), and Structure Fires (20.2%).
Fire incident types reported to NFIRS in Zip Code 95228

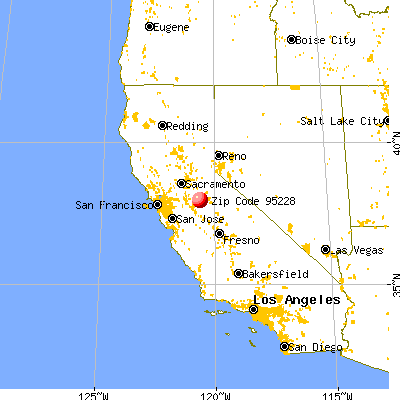


 Nearest zip codes: 95361, 95222, 95230, 95327, 95252, 95249.


 According to the data from the years 2006 - 2018 the average number of fire incidents per year is 37. The highest number of reported fires - 59 took place in 2017, and the least - 2 in 2006. The data has a rising trend.
 When looking into fire subcategories, the most reports belonged to: Outside Fires (68.3%), and Structure Fires (20.2%).