Estimated zip code population in 2022: 771 Zip code population in 2010: 1,099 Zip code population in 2000: 1,153
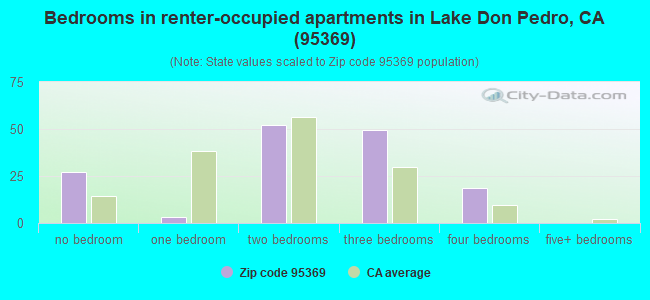
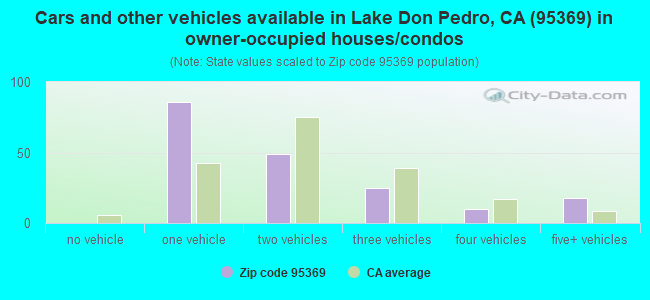
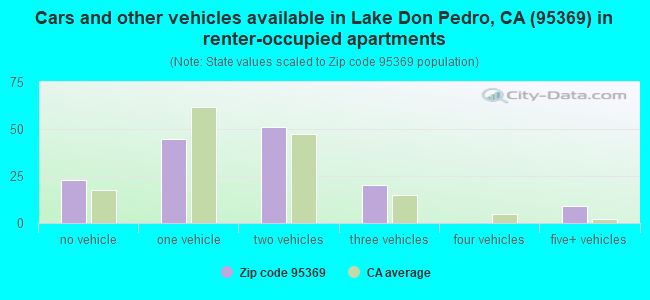
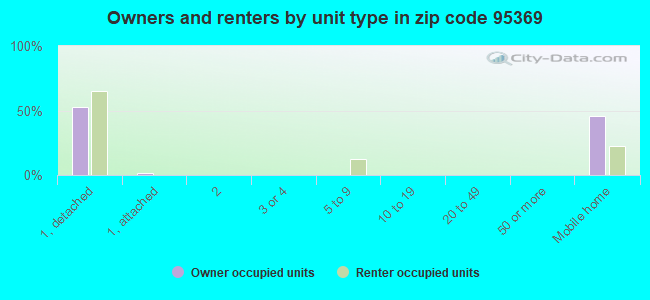
Houses and condos: 421 Renter-occupied apartments: 148
% of renters here:
44%
State:
44%
March 2022 cost of living index in zip code 95369: 94.2 (less than average, U.S. average is 100)
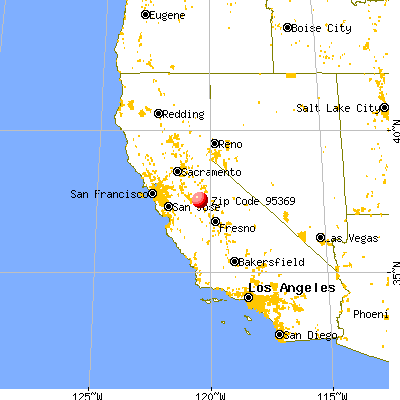
Land area: 159.3 sq. mi. Water area: 3.1 sq. mi.
Population density: 5 people per square mile
(very low).
OSM Map
General Map
Google Map
MSN Map
OSM Map
General Map
Google Map
MSN Map
OSM Map
General Map
Google Map
MSN Map
OSM Map
General Map
Google Map
MSN Map
Please wait while loading the map...
Real estate property taxes paid for housing units in 2022:
This zip code:
0.9% ($3,344)
California:
0.7% ($4,831)
Median real estate property taxes paid for housing units with mortgages in 2022: $3,539 (1.1%) Median real estate property taxes paid for housing units with no mortgage in 2022: $1,744 (0.5%)
Business Search- 14 Million verified businesses
Males: 482
(62.6%)
Females: 288
(37.4%)
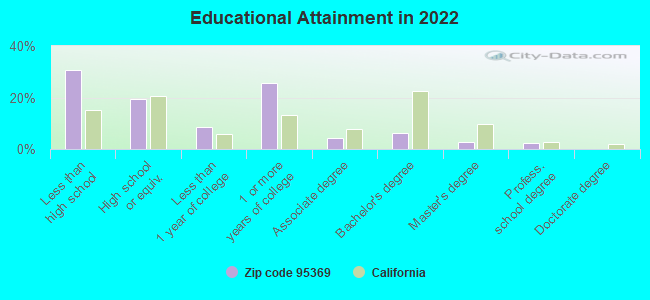
For population 25 years and over in 95369:
High school or higher: 66.9%
Bachelor's degree or higher: 11.3%
Graduate or professional degree: 5.2%
Unemployed: 4.8%
Mean travel time to work (commute): 23.4 minutes
For population 15 years and over in 95369:
Never married: 29.7%
Now married: 53.1%
Separated: 9.7%
Widowed: 3.8%
Divorced: 3.6%
Zip code 95369 compared to state average:
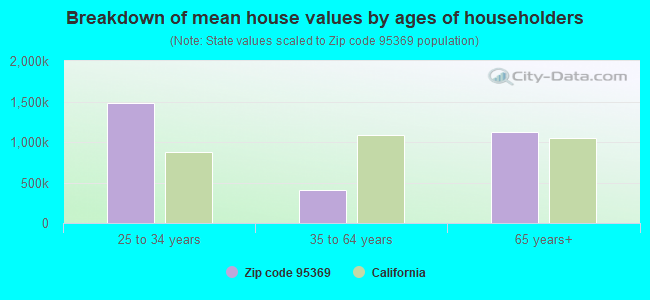
Median house value below state average.
Black race population percentage significantly below state average.
Median age significantly above state average.
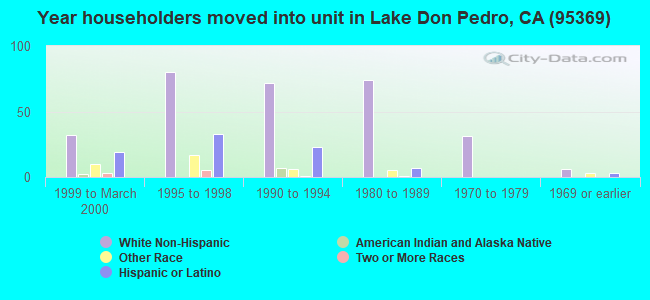
Length of stay since moving in significantly below state average.
Percentage of population with a bachelor's degree or higher significantly below state average.
Estimated median house/condo value in 2022: $383,630
95369:
$383,630
California:
$715,900
According to our research of California and other state lists, there was 1 registered sex offender living in 95369 zip code as of June 09, 2024. The ratio of all residents to sex offenders in zip code 95369 is 1,025 to 1. The ratio of registered sex offenders to all residents in this zip code is lower than the state average.
Median resident age:
This zip code:
48.0 years
California median age:
37.9 years
Average household size:
This zip code:
2.3 people
California:
2.8 people
Averages for the 2020 tax year for zip code 95369, filed in 2021:
Average Adjusted Gross Income (AGI) in 2020: $58,900 (Individual Income Tax Returns)
Here:
$58,900
State:
$95,910
Salary/wage: $51,358 (reported on 76.5% of returns)
Here:
$51,358
State:
$77,331
(% of AGI for various income ranges: 1281.4% for AGIs below $25k, 4386.7% for AGIs $25k-50k, 5628.0% for AGIs $50k-75k, 23650.0% for AGIs $100k-200k)
Taxable interest for individuals: $380 (reported on 29.4% of returns)
This zip code:
$380
California:
$2,294
(% of AGI for various income ranges: 4.3% for AGIs below $25k, 5.0% for AGIs $25k-50k, 8.0% for AGIs $50k-75k, 140.0% for AGIs $100k-200k)
Ordinary dividends: $4,333 (reported on 8.8% of returns)
Here:
$4,333
State:
$10,949
(% of AGI for various income ranges: 216.7% for AGIs $25k-50k)
Net capital gain/loss in AGI: +$8,050 (reported on 11.8% of returns)
Here:
+$8,050
State:
+$49,306
(% of AGI for various income ranges: 1610.0% for AGIs $100k-200k)
Profit/loss from business: +$1,600 (reported on 8.8% of returns)
Here:
+$1,600
State:
+$15,671
(% of AGI for various income ranges: 68.6% for AGIs below $25k)
Taxable individual retirement arrangement distribution: $9,350 (reported on 5.9% of returns)
95369:
$9,350
California:
$23,505
(% of AGI for various income ranges: 267.1% for AGIs below $25k)
Earned income credit: $2,460 (reported on 14.7% of returns)
Here:
$2,460
State:
$2,074
(% of AGI for various income ranges: 175.7% for AGIs below $25k)
Percentage of individuals using paid preparers for their 2020 taxes: 100.0%
Here:
100%
State:
92%
(% for various income ranges: 100.0% for AGIs below $25k, 100.0% for AGIs $25k-50k, 100.0% for AGIs $50k-75k, 100.0% for AGIs $75k-100k, 100.0% for AGIs $100k-200k)
Averages for the 2012 tax year for zip code 95369, filed in 2013:
Average Adjusted Gross Income (AGI) in 2012: $47,605 (Individual Income Tax Returns)
Here:
$47,605
State:
$72,726
Salary/wage: $38,757 (reported on 75.7% of returns)
Here:
$38,757
State:
$59,079
(% of AGI for various income ranges: 66.4% for AGIs below $25k, 75.7% for AGIs $25k-50k, 76.6% for AGIs $50k-75k, 65.2% for AGIs $75k-100k, 44.2% for AGIs $100k-200k)
Taxable interest for individuals: $583 (reported on 32.4% of returns)
This zip code:
$583
California:
$2,146
(% of AGI for various income ranges: 0.3% for AGIs below $25k, 0.2% for AGIs $50k-75k, 0.8% for AGIs $100k-200k)
Ordinary dividends: $3,080 (reported on 13.5% of returns)
Here:
$3,080
State:
$9,308
Net capital gain/loss in AGI: +$1,475 (reported on 10.8% of returns)
Here:
+$1,475
State:
+$30,460
Profit/loss from business: +$1,780 (reported on 13.5% of returns)
Here:
+$1,780
State:
+$17,064
Taxable individual retirement arrangement distribution: $13,300 (reported on 5.4% of returns)
95369:
$13,300
California:
$19,557
Total itemized deductions: $20,982 (28% of AGI, reported on 29.7% of returns)
Here:
$20,982
State:
$34,004
Here:
28.0% of AGI
State:
22.7% of AGI
(% of AGI for various income ranges: 17.1% for AGIs $25k-50k, 23.9% for AGIs $50k-75k, 14.9% for AGIs $100k-200k)
Charity contributions: $3,286 (reported on 18.9% of returns)
Here:
$3,286
State:
$4,659
(% of AGI for various income ranges: 1.0% for AGIs below $25k, 3.6% for AGIs $50k-75k, 1.5% for AGIs $100k-200k)
Taxes paid: $5,309 (reported on 29.7% of returns)
95369:
$5,309
State:
$14,448
(% of AGI for various income ranges: 2.6% for AGIs $25k-50k, 5.9% for AGIs $50k-75k, 4.8% for AGIs $100k-200k)
Earned income credit: $2,217 (reported on 16.2% of returns)
Here:
$2,217
State:
$2,286
(% of AGI for various income ranges: 6.3% for AGIs below $25k)
Percentage of individuals using paid preparers for their 2012 taxes: 70.3%
Here:
70%
State:
64%
(% for various income ranges: 62.5% for AGIs below $25k, 80.0% for AGIs $25k-50k, 100.0% for AGIs $50k-75k, 100.0% for AGIs $100k-200k)
Averages for the 2004 tax year for zip code 95369, filed in 2005:
Average Adjusted Gross Income (AGI) in 2004: $36,918 (Individual Income Tax Returns)
Here:
$36,918
State:
$58,600
Salary/wage: $35,060 (reported on 84.1% of returns)
Here:
$35,060
State:
$49,455
(% of AGI for various income ranges: 319.2% for AGIs below $10k, 82.2% for AGIs $10k-25k, 83.2% for AGIs $25k-50k, 81.9% for AGIs $50k-75k, 91.5% for AGIs $75k-100k, 61.5% for AGIs over 100k)
Taxable interest for individuals: $741 (reported on 41.9% of returns)
This zip code:
$741
California:
$2,365
(% of AGI for various income ranges: 28.8% for AGIs below $10k, 2.3% for AGIs $10k-25k, 0.6% for AGIs $25k-50k, 0.6% for AGIs $50k-75k, 0.1% for AGIs $75k-100k, 0.3% for AGIs over 100k)
Taxable dividends: $1,885 (reported on 16.2% of returns)
Here:
$1,885
State:
$4,746
(% of AGI for various income ranges: 4.0% for AGIs $10k-25k, 0.6% for AGIs $25k-50k, 0.4% for AGIs $50k-75k, 0.6% for AGIs $75k-100k)
Net capital gain/loss: +$9,413 (reported on 12.2% of returns)
Here:
+$9,413
State:
+$23,418
Total itemized deductions: $17,012 (26% of AGI, reported on 22.0% of returns)
Here:
$17,012
State:
$28,113
Here:
25.6% of AGI
State:
25.3% of AGI
(% of AGI for various income ranges: 226.0% for AGIs below $10k, 8.5% for AGIs $25k-50k, 11.4% for AGIs $50k-75k, 11.7% for AGIs $75k-100k, 10.6% for AGIs over 100k)
Charity contributions deductions: $933 (1% of AGI, reported on 15.9% of returns)
Here:
$933
State:
$3,923
Here:
1.4% of AGI
State:
3.3% of AGI
Total tax: $4,772 (reported on 71.1% of returns)
95369:
$4,772
State:
$10,761
(% of AGI for various income ranges: 15.1% for AGIs below $10k, 2.8% for AGIs $10k-25k, 6.8% for AGIs $25k-50k, 8.1% for AGIs $50k-75k, 9.6% for AGIs $75k-100k, 16.4% for AGIs over 100k)
Earned income credit: $1,701 (reported on 17.8% of returns)
Here:
$1,701
State:
$1,763
Percentage of individuals using paid preparers for their 2004 taxes: 66.0%
Here:
66%
State:
66%
(% for various income ranges: 56.9% for AGIs below $10k, 61.2% for AGIs $10k-25k, 68.3% for AGIs $25k-50k, 74.6% for AGIs $50k-75k, 72.2% for AGIs $75k-100k, 81.0% for AGIs over 100k)
Household received Food Stamps/SNAP in the past 12 months: 51 Household did not receive Food Stamps/SNAP in the past 12 months: 286
Women who had a birth in the past 12 months: 8 (2 now married, 6 unmarried) Women who did not have a birth in the past 12 months: 120 (49 now married, 71 unmarried)
Housing units in zip code 95369 with a mortgage: 138 Houses without a mortgage: 6
Median monthly owner costs for units with a mortgage: $1,831 Median monthly owner costs for units without a mortgage: $522
Residents with income below the poverty level in 2022:
This zip code:
11.5%
Whole state:
12.2%
Residents with income below 50% of the poverty level in 2022:
This zip code:
6.4%
Whole state:
6.2%
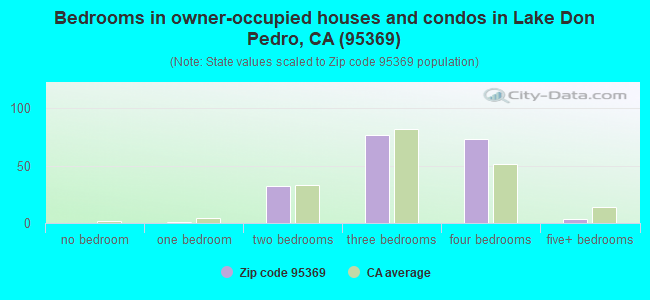
Median number of rooms in houses and condos:
Here:
7.5
State:
6.0
Median number of rooms in apartments:
Here:
4.9
State:
3.9
Notable locations in this zip code not listed on our city pages
Notable locations in zip code 95369: Webb Station (A), Milk Made Dairy (B), Sierra Vista Dairy (C), Negro Hill (D), Four Corners (E), Merced County Fire Department Station 65 Snelling (F). Display/hide their locations on the map
Streams, rivers, and creeks: Ingalsbe Slough (A), South Fork Dry Creek (B), Myers Creek (C), Hayward Creek (D), Browns Creek (E), Stony Creek (F), Stoney Creek (G). Display/hide their locations on the map
Parks in zip code 95369 include: Henderson Park (1), Barrett Cove Recreation Area (2), McClure Point Recreation Area (3). Display/hide their locations on the map
Size of family households: 102 2-persons, 22 3-persons, 29 4-persons, 9 5-persons, 23 6-persons, 1 7-or-more-persons
Size of nonfamily households: 142 1-person, 3 2-persons, 3 3-persons
70 married couples with children.
49 single-parent households (45 men, 4 women).
48.3% of residents of 95369 zip code speak English at home.
51.3% of residents speak Spanish at home (60% very well, 1% well, 9% not well, 29% not at all).
0.4% of residents speak Asian or Pacific Island language at home (100% very well).
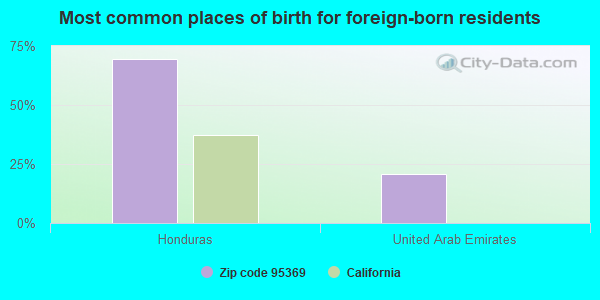
Foreign born population: 229 (29.8%) (32.0% of them are naturalized citizens)
This zip code:
29.8%
Whole state:
26.7%
70%Honduras
21%United Arab Emirates
0%Italy
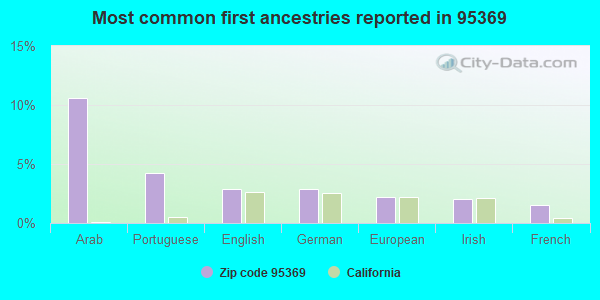
11%Arab
4%Portuguese
3%English
3%German
2%European
2%Irish
2%French
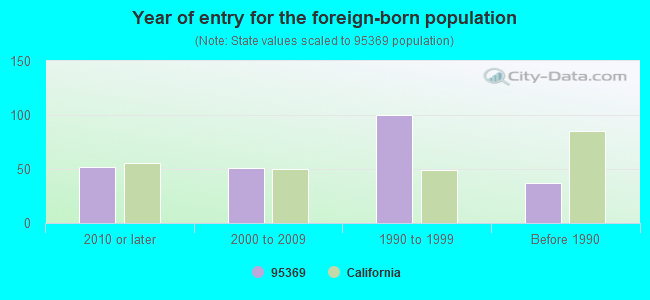
Year of entry for the foreign-born population
522010 or later
512000 to 2009
1001990 to 1999
37Before 1990
Facilities with environmental interests located in this zip code:
HOPETON ELEMENTARY (2241 W. TURLOCK ROAD in SNELLING, CA)
(National Center for Education Statistics) - STATE ID-6025480 Organizations: MERCED RIVER UNION ELEMENTARY (SCHOOL DISTRICT)
MERCED RIVER FISH HATCHERY (PO BOX 94 in SNELLING, CA)
National Pollutant Discharge Elimination System NON-MAJOR (Tracking pollutant discharge elimination systems) - permit Business SIC classification: FISH HATCHERIES AND PRESERVES Organizations: CA DEPT OF FISH & GAME (CONTACT/OWNER)
Alternative names: CA DEPT OF FISH & GAME, CA FISH & GAME
HOMEN FAMILY TRUST (2510 W TURLOCK RD in SNELLING, CA)
National Pollutant Discharge Elimination System NON-MAJOR (Tracking pollutant discharge elimination systems) - permit Business SIC classification: DAIRY FARMS
Housing units lacking complete plumbing facilities: 0.5% Housing units lacking complete kitchen facilities: 0.4%
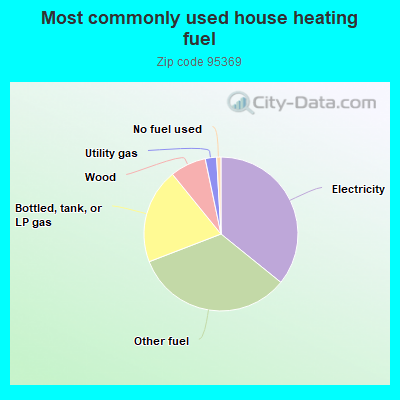
36.0%Electricity
33.5%Other fuel
20.1%Bottled, tank, or LP gas
7.6%Wood
2.4%Utility gas
0.9%No fuel used
Population in 1990: 1,335.
Place of birth for U.S.-born residents:
This state: 473
Northeast: 1
Midwest: 17
South: 17
West: 19
62% of the 95369 zip code residents lived in the same house 5 years ago. Out of people who lived in different houses, 68% lived in this county. Out of people who lived in different counties, 50% lived in California.
88% of the 95369 zip code residents lived in the same house 1 year ago. Out of people who lived in different houses, 16% moved from this county. Out of people who lived in different houses, 34% moved from different county within same state. Out of people who lived in different houses, 4% moved from different state. Out of people who lived in different houses, 51% moved from abroad.
Private vs. public school enrollment:
Students in private schools in grades 1 to 8 (elementary and middle school): 2
Here:
3.1%
California:
10.5%
Students in private schools in grades 9 to 12 (high school):
Here:
0.0%
California:
8.5%
Students in private undergraduate colleges: 7
Here:
16.0%
California:
15.9%
Occupation by median earnings in the past 12 months ($)
90,856Sales and related occupations
53,917Office and administrative support occupations
48,605Management occupations
44,296Building and grounds cleaning and maintenance occupations
41,822Farming, fishing, and forestry occupations
Top industries in this zip code by the number of employees in 2005:
Health Care and Social Assistance: Other Residential Care Facilities (20-49 employees: 1 establishment)
Arts, Entertainment, and Recreation: Fitness and Recreational Sports Centers (5-9: 1)
Accommodation and Food Services: Full-Service Restaurants (5-9: 1)
Accommodation and Food Services: Drinking Places (Alcoholic Beverages) (1-4: 1)
Administrative and Support and Waste Management and Remediation Services: Landscaping Services (1-4: 1)
Construction: Land Subdivision (1-4: 1)
Other Services (except Public Administration): Civic and Social Organizations (1-4: 1)
Arts, Entertainment, and Recreation: Marinas (1-4: 1)
Fatal accident statistics in 2013:
Fatal accident count: 2
Vehicles involved in fatal accidents: 2
Fatal accidents caused by drunken drivers: 0
Fatalities: 2
Persons involved in fatal accidents: 3
Pedestrians involved in fatal accidents: 0
Fatal accident statistics in 2011:
Fatal accident count: 1
Vehicles involved in fatal accidents: 1
Fatal accidents caused by drunken drivers: 0
Fatalities: 1
Persons involved in fatal accidents: 3
Pedestrians involved in fatal accidents: 0
Home Mortgage Disclosure Act Aggregated Statistics For Year 2009 (Based on 2 partial tracts)
A) FHA, FSA/RHS & VA Home Purchase Loans
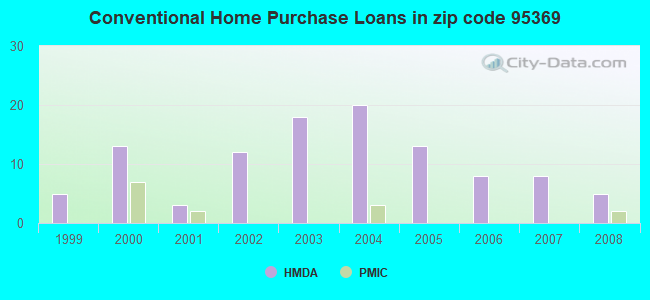
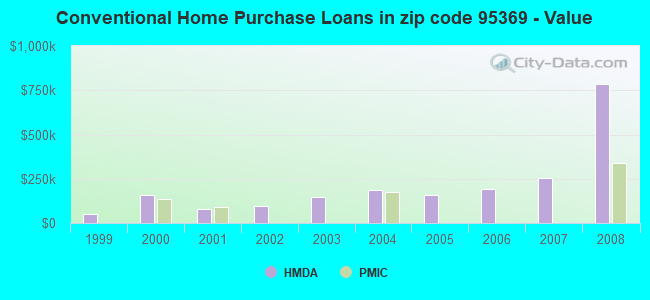
B) Conventional Home Purchase Loans
C) Refinancings
D) Home Improvement Loans
F) Non-occupant Loans on < 5 Family Dwellings (A B C & D)
G) Loans On Manufactured Home Dwelling (A B C & D)
Number
Average Value
Number
Average Value
Number
Average Value
Number
Average Value
Number
Average Value
Number
Average Value
LOANS ORIGINATED
0
$0
0
$0
5
$137,630
0
$0
0
$0
0
$0
APPLICATIONS APPROVED, NOT ACCEPTED
0
$0
0
$0
0
$0
0
$0
0
$0
0
$0
APPLICATIONS DENIED
2
$142,260
5
$89,326
7
$147,460
2
$41,355
5
$136,968
5
$120,426
APPLICATIONS WITHDRAWN
0
$0
0
$0
5
$196,188
0
$0
3
$174,243
0
$0
FILES CLOSED FOR INCOMPLETENESS
0
$0
0
$0
2
$38,045
0
$0
0
$0
0
$0
Aggregated Statistics For Year 2008 (Based on 2 partial tracts)
B) Conventional Home Purchase Loans
C) Refinancings
D) Home Improvement Loans
G) Loans On Manufactured Home Dwelling (A B C & D)
Number
Average Value
Number
Average Value
Number
Average Value
Number
Average Value
LOANS ORIGINATED
5
$785,744
3
$258,607
2
$4,135
0
$0
APPLICATIONS APPROVED, NOT ACCEPTED
5
$123,072
3
$345,727
0
$0
2
$70,305
APPLICATIONS DENIED
5
$236,550
5
$228,280
0
$0
2
$316,780
APPLICATIONS WITHDRAWN
3
$162,110
2
$302,720
0
$0
0
$0
FILES CLOSED FOR INCOMPLETENESS
0
$0
0
$0
0
$0
0
$0
Aggregated Statistics For Year 2007 (Based on 2 partial tracts)
B) Conventional Home Purchase Loans
C) Refinancings
F) Non-occupant Loans on < 5 Family Dwellings (A B C & D)
G) Loans On Manufactured Home Dwelling (A B C & D)
Number
Average Value
Number
Average Value
Number
Average Value
Number
Average Value
LOANS ORIGINATED
8
$253,092
15
$188,689
3
$210,083
5
$232,250
APPLICATIONS APPROVED, NOT ACCEPTED
0
$0
5
$325,878
0
$0
0
$0
APPLICATIONS DENIED
3
$211,737
17
$345,728
5
$148,878
0
$0
APPLICATIONS WITHDRAWN
0
$0
7
$491,534
2
$99,250
0
$0
FILES CLOSED FOR INCOMPLETENESS
0
$0
2
$184,445
0
$0
0
$0
Aggregated Statistics For Year 2006 (Based on 2 partial tracts)
B) Conventional Home Purchase Loans
C) Refinancings
D) Home Improvement Loans
F) Non-occupant Loans on < 5 Family Dwellings (A B C & D)
G) Loans On Manufactured Home Dwelling (A B C & D)
Number
Average Value
Number
Average Value
Number
Average Value
Number
Average Value
Number
Average Value
LOANS ORIGINATED
8
$189,820
26
$689,928
12
$112,623
8
$1,826,236
7
$932,260
APPLICATIONS APPROVED, NOT ACCEPTED
3
$279,010
5
$258,386
15
$264,893
2
$661,680
0
$0
APPLICATIONS DENIED
7
$270,580
10
$327,532
7
$74,439
3
$273,493
3
$339,663
APPLICATIONS WITHDRAWN
5
$135,976
22
$151,284
3
$271,840
3
$151,633
0
$0
FILES CLOSED FOR INCOMPLETENESS
0
$0
3
$284,523
0
$0
0
$0
2
$228,280
Aggregated Statistics For Year 2005 (Based on 2 partial tracts)
B) Conventional Home Purchase Loans
C) Refinancings
D) Home Improvement Loans
F) Non-occupant Loans on < 5 Family Dwellings (A B C & D)
G) Loans On Manufactured Home Dwelling (A B C & D)
Number
Average Value
Number
Average Value
Number
Average Value
Number
Average Value
Number
Average Value
LOANS ORIGINATED
13
$158,676
25
$195,659
8
$220,836
3
$127,923
3
$137,300
APPLICATIONS APPROVED, NOT ACCEPTED
3
$164,317
7
$218,354
0
$0
0
$0
3
$137,850
APPLICATIONS DENIED
0
$0
20
$178,323
7
$43,719
0
$0
2
$84,365
APPLICATIONS WITHDRAWN
7
$269,634
20
$160,788
5
$171,376
3
$106,420
2
$132,335
FILES CLOSED FOR INCOMPLETENESS
0
$0
7
$219,063
0
$0
0
$0
0
$0
Aggregated Statistics For Year 2004 (Based on 2 partial tracts)
B) Conventional Home Purchase Loans
C) Refinancings
D) Home Improvement Loans
F) Non-occupant Loans on < 5 Family Dwellings (A B C & D)
G) Loans On Manufactured Home Dwelling (A B C & D)
Number
Average Value
Number
Average Value
Number
Average Value
Number
Average Value
Number
Average Value
LOANS ORIGINATED
20
$183,699
35
$120,946
5
$115,132
5
$118,110
7
$162,111
APPLICATIONS APPROVED, NOT ACCEPTED
7
$155,494
7
$156,913
3
$19,300
0
$0
2
$124,065
APPLICATIONS DENIED
13
$241,386
45
$153,583
3
$211,737
3
$50,177
7
$139,426
APPLICATIONS WITHDRAWN
5
$129,358
22
$132,862
0
$0
0
$0
3
$153,290
FILES CLOSED FOR INCOMPLETENESS
0
$0
2
$188,580
0
$0
0
$0
0
$0
Aggregated Statistics For Year 2003 (Based on 2 partial tracts)
A) FHA, FSA/RHS & VA Home Purchase Loans
B) Conventional Home Purchase Loans
C) Refinancings
D) Home Improvement Loans
F) Non-occupant Loans on < 5 Family Dwellings (A B C & D)
Number
Average Value
Number
Average Value
Number
Average Value
Number
Average Value
Number
Average Value
LOANS ORIGINATED
2
$132,335
18
$145,018
89
$139,957
3
$33,637
7
$116,030
APPLICATIONS APPROVED, NOT ACCEPTED
0
$0
2
$153,015
7
$127,610
0
$0
0
$0
APPLICATIONS DENIED
0
$0
10
$156,156
46
$181,854
0
$0
3
$122,963
APPLICATIONS WITHDRAWN
0
$0
0
$0
17
$166,296
2
$182,790
5
$61,536
FILES CLOSED FOR INCOMPLETENESS
0
$0
0
$0
17
$161,625
0
$0
2
$51,280
Aggregated Statistics For Year 2002 (Based on 2 partial tracts)
A) FHA, FSA/RHS & VA Home Purchase Loans
B) Conventional Home Purchase Loans
C) Refinancings
D) Home Improvement Loans
F) Non-occupant Loans on < 5 Family Dwellings (A B C & D)
Number
Average Value
Number
Average Value
Number
Average Value
Number
Average Value
Number
Average Value
LOANS ORIGINATED
7
$88,617
12
$94,565
22
$114,140
3
$18,747
3
$93,737
APPLICATIONS APPROVED, NOT ACCEPTED
0
$0
0
$0
2
$46,320
0
$0
0
$0
APPLICATIONS DENIED
0
$0
0
$0
17
$162,112
7
$28,357
0
$0
APPLICATIONS WITHDRAWN
2
$70,305
2
$148,880
13
$100,779
2
$24,815
0
$0
FILES CLOSED FOR INCOMPLETENESS
0
$0
0
$0
10
$153,510
0
$0
0
$0
Aggregated Statistics For Year 2001 (Based on 2 partial tracts)
A) FHA, FSA/RHS & VA Home Purchase Loans
B) Conventional Home Purchase Loans
C) Refinancings
D) Home Improvement Loans
Number
Average Value
Number
Average Value
Number
Average Value
Number
Average Value
LOANS ORIGINATED
2
$90,980
3
$79,400
20
$108,350
0
$0
APPLICATIONS APPROVED, NOT ACCEPTED
0
$0
3
$137,850
0
$0
0
$0
APPLICATIONS DENIED
0
$0
3
$52,933
12
$75,404
2
$165,420
APPLICATIONS WITHDRAWN
2
$62,035
3
$114,690
8
$107,730
0
$0
FILES CLOSED FOR INCOMPLETENESS
0
$0
0
$0
2
$165,420
0
$0
Aggregated Statistics For Year 2000 (Based on 2 partial tracts)
A) FHA, FSA/RHS & VA Home Purchase Loans
B) Conventional Home Purchase Loans
C) Refinancings
D) Home Improvement Loans
Number
Average Value
Number
Average Value
Number
Average Value
Number
Average Value
LOANS ORIGINATED
0
$0
13
$160,330
10
$89,327
2
$5,790
APPLICATIONS APPROVED, NOT ACCEPTED
2
$93,460
12
$45,904
0
$0
0
$0
APPLICATIONS DENIED
0
$0
10
$25,309
5
$56,574
2
$23,160
APPLICATIONS WITHDRAWN
0
$0
2
$91,810
2
$41,355
0
$0
FILES CLOSED FOR INCOMPLETENESS
0
$0
0
$0
2
$112,485
0
$0
Aggregated Statistics For Year 1999 (Based on 1 partial tract)
A) FHA, FSA/RHS & VA Home Purchase Loans
B) Conventional Home Purchase Loans
C) Refinancings
D) Home Improvement Loans
F) Non-occupant Loans on < 5 Family Dwellings (A B C & D)
Detailed PMIC statistics for the following Tracts:0001.00
2005 - 2018 National Fire Incident Reporting System (NFIRS) incidents
Based on the data from the years 2005 - 2018 the average number of fires per year is 14. The highest number of reported fire incidents - 25 took place in 2017, and the least - 1 in 2005. The data has a growing trend.
When looking into fire subcategories, the most incidents belonged to: Outside Fires (69.3%), and Mobile Property/Vehicle Fires (18.0%).
Fire incident types reported to NFIRS in Zip Code 95369


 Nearest zip codes: 95329, 95348, 95340, 95388, 95325, 95386.


 Based on the data from the years 2005 - 2018 the average number of fires per year is 14. The highest number of reported fire incidents - 25 took place in 2017, and the least - 1 in 2005. The data has a growing trend.
 When looking into fire subcategories, the most incidents belonged to: Outside Fires (69.3%), and Mobile Property/Vehicle Fires (18.0%).