Estimated zip code population in 2022: 1,371 Zip code population in 2010: 1,592 Zip code population in 2000: 1,370
Houses and condos: 668 Renter-occupied apartments: 205
% of renters here:
47%
State:
44%
March 2022 cost of living index in zip code 95415: 103.9 (near average, U.S. average is 100)
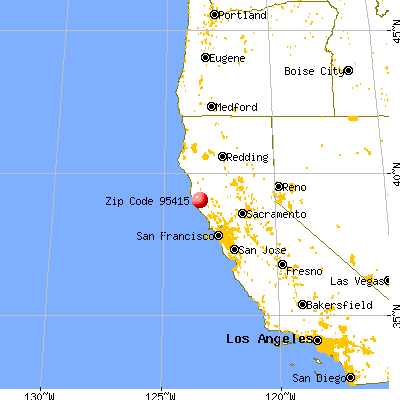
Land area: 55.3 sq. mi. Water area: 0.0 sq. mi.
Population density: 25 people per square mile
(very low).
OSM Map
General Map
Google Map
MSN Map
OSM Map
General Map
Google Map
MSN Map
OSM Map
General Map
Google Map
MSN Map
OSM Map
General Map
Google Map
MSN Map
Please wait while loading the map...
Real estate property taxes paid for housing units in 2022:
This zip code:
0.5% ($3,148)
California:
0.7% ($4,831)
Median real estate property taxes paid for housing units with mortgages in 2022: $4,117 (0.9%) Median real estate property taxes paid for housing units with no mortgage in 2022: $2,307 (0.3%)
Business Search- 14 Million verified businesses
Males: 615
(44.9%)
Females: 756
(55.1%)
For population 25 years and over in 95415:
High school or higher: 85.7%
Bachelor's degree or higher: 29.3%
Graduate or professional degree: 13.7%
Unemployed: 10.8%
Mean travel time to work (commute): 15.4 minutes
For population 15 years and over in 95415:
Never married: 26.0%
Now married: 46.2%
Separated: 1.5%
Widowed: 11.9%
Divorced: 14.3%
Zip code 95415 compared to state average:
Median household income below state average.
Unemployed percentage above state average.
Length of stay since moving in significantly above state average.
Estimated median house/condo value in 2022: $649,012
95415:
$649,012
California:
$715,900
According to our research of California and other state lists, there was 1 registered sex offender living in 95415 zip code as of May 28, 2024. The ratio of all residents to sex offenders in zip code 95415 is 1,330 to 1. The ratio of registered sex offenders to all residents in this zip code is lower than the state average.
Median resident age:
This zip code:
40.6 years
California median age:
37.9 years
Average household size:
This zip code:
3.1 people
California:
2.8 people
Averages for the 2020 tax year for zip code 95415, filed in 2021:
Average Adjusted Gross Income (AGI) in 2020: $54,680 (Individual Income Tax Returns)
Here:
$54,680
State:
$95,910
Salary/wage: $41,394 (reported on 75.7% of returns)
Here:
$41,394
State:
$77,331
(% of AGI for various income ranges: 1936.4% for AGIs below $25k, 5011.7% for AGIs $25k-50k, 9004.0% for AGIs $50k-75k, 13980.0% for AGIs $75k-100k, 32485.0% for AGIs $100k-200k)
Taxable interest for individuals: $2,035 (reported on 32.9% of returns)
This zip code:
$2,035
California:
$2,294
(% of AGI for various income ranges: 38.2% for AGIs below $25k, 113.3% for AGIs $25k-50k, 94.0% for AGIs $50k-75k, 110.0% for AGIs $75k-100k, 1105.0% for AGIs $100k-200k)
Ordinary dividends: $15,018 (reported on 15.7% of returns)
Here:
$15,018
State:
$10,949
(% of AGI for various income ranges: 51.8% for AGIs below $25k, 60.0% for AGIs $25k-50k, 388.0% for AGIs $50k-75k, 6645.0% for AGIs $100k-200k)
Net capital gain/loss in AGI: +$17,970 (reported on 14.3% of returns)
Here:
+$17,970
State:
+$49,306
(% of AGI for various income ranges: 91.7% for AGIs $25k-50k, 500.0% for AGIs $50k-75k, 7185.0% for AGIs $100k-200k)
Profit/loss from business: +$17,880 (reported on 21.4% of returns)
Here:
+$17,880
State:
+$15,671
(% of AGI for various income ranges: 213.6% for AGIs below $25k, 480.8% for AGIs $25k-50k, 590.0% for AGIs $50k-75k, 7875.0% for AGIs $100k-200k)
Taxable individual retirement arrangement distribution: $22,150 (reported on 5.7% of returns)
95415:
$22,150
California:
$23,505
(% of AGI for various income ranges: 142.7% for AGIs below $25k, 3645.0% for AGIs $75k-100k)
Total itemized deductions: $35,525 (reported on 5.7% of returns)
Here:
$35,525
State:
$39,517
(% of AGI for various income ranges: 423.3% for AGIs $25k-50k, 4565.0% for AGIs $100k-200k)
Charity contributions: $11,533 (reported on 4.3% of returns)
Here:
$11,533
State:
$12,598
(% of AGI for various income ranges: 692.0% for AGIs $50k-75k)
Taxes paid: $7,320 (reported on 7.1% of returns)
95415:
$7,320
State:
$8,807
(% of AGI for various income ranges: 110.8% for AGIs $25k-50k, 1165.0% for AGIs $100k-200k)
Earned income credit: $2,000 (reported on 20.0% of returns)
Here:
$2,000
State:
$2,074
(% of AGI for various income ranges: 136.4% for AGIs below $25k, 108.3% for AGIs $25k-50k)
Percentage of individuals using paid preparers for their 2020 taxes: 91.4%
Here:
91%
State:
92%
(% for various income ranges: 88.0% for AGIs below $25k, 95.5% for AGIs $25k-50k, 90.0% for AGIs $50k-75k, 100.0% for AGIs $75k-100k, 83.3% for AGIs $100k-200k, 100.0% for AGIs over 200k)
Averages for the 2012 tax year for zip code 95415, filed in 2013:
Average Adjusted Gross Income (AGI) in 2012: $39,872 (Individual Income Tax Returns)
Here:
$39,872
State:
$72,726
Salary/wage: $31,575 (reported on 79.1% of returns)
Here:
$31,575
State:
$59,079
(% of AGI for various income ranges: 73.7% for AGIs below $25k, 77.2% for AGIs $25k-50k, 61.0% for AGIs $50k-75k, 62.0% for AGIs $75k-100k, 45.9% for AGIs $100k-200k)
Taxable interest for individuals: $2,062 (reported on 35.8% of returns)
This zip code:
$2,062
California:
$2,146
(% of AGI for various income ranges: 1.7% for AGIs below $25k, 1.5% for AGIs $25k-50k, 2.3% for AGIs $50k-75k, 0.4% for AGIs $75k-100k, 2.4% for AGIs $100k-200k)
Ordinary dividends: $7,515 (reported on 19.4% of returns)
Here:
$7,515
State:
$9,308
(% of AGI for various income ranges: 3.5% for AGIs below $25k, 1.1% for AGIs $25k-50k, 6.9% for AGIs $50k-75k, 5.3% for AGIs $100k-200k)
Net capital gain/loss in AGI: +$4,770 (reported on 14.9% of returns)
Here:
+$4,770
State:
+$30,460
(% of AGI for various income ranges: 1.8% for AGIs $50k-75k, 4.7% for AGIs $100k-200k)
Profit/loss from business: +$11,053 (reported on 22.4% of returns)
Here:
+$11,053
State:
+$17,064
(% of AGI for various income ranges: 12.1% for AGIs below $25k, 7.3% for AGIs $25k-50k, 24.3% for AGIs $75k-100k)
Taxable individual retirement arrangement distribution: $11,000 (reported on 10.4% of returns)
95415:
$11,000
California:
$19,557
Total itemized deductions: $25,200 (33% of AGI, reported on 20.9% of returns)
Here:
$25,200
State:
$34,004
Here:
32.5% of AGI
State:
22.7% of AGI
(% of AGI for various income ranges: 14.8% for AGIs $25k-50k, 16.5% for AGIs $50k-75k, 20.7% for AGIs $100k-200k)
Charity contributions: $2,133 (reported on 13.4% of returns)
Here:
$2,133
State:
$4,659
(% of AGI for various income ranges: 0.7% for AGIs $25k-50k, 0.7% for AGIs $50k-75k, 1.4% for AGIs $100k-200k)
Taxes paid: $7,286 (reported on 20.9% of returns)
95415:
$7,286
State:
$14,448
(% of AGI for various income ranges: 3.2% for AGIs $25k-50k, 5.4% for AGIs $50k-75k, 6.5% for AGIs $100k-200k)
Earned income credit: $2,287 (reported on 22.4% of returns)
Here:
$2,287
State:
$2,286
(% of AGI for various income ranges: 6.5% for AGIs below $25k, 1.1% for AGIs $25k-50k)
Percentage of individuals using paid preparers for their 2012 taxes: 71.6%
Here:
72%
State:
64%
(% for various income ranges: 67.7% for AGIs below $25k, 75.0% for AGIs $25k-50k, 100.0% for AGIs $50k-75k, 80.0% for AGIs $100k-200k)
Averages for the 2004 tax year for zip code 95415, filed in 2005:
Average Adjusted Gross Income (AGI) in 2004: $36,582 (Individual Income Tax Returns)
Here:
$36,582
State:
$58,600
Salary/wage: $29,306 (reported on 78.8% of returns)
Here:
$29,306
State:
$49,455
(% of AGI for various income ranges: 82.6% for AGIs below $10k, 75.5% for AGIs $10k-25k, 72.5% for AGIs $25k-50k, 63.0% for AGIs $50k-75k, 66.6% for AGIs $75k-100k, 43.8% for AGIs over 100k)
Taxable interest for individuals: $2,593 (reported on 43.3% of returns)
This zip code:
$2,593
California:
$2,365
(% of AGI for various income ranges: 3.7% for AGIs below $10k, 4.2% for AGIs $10k-25k, 4.0% for AGIs $25k-50k, 2.3% for AGIs $50k-75k, 0.9% for AGIs $75k-100k, 2.9% for AGIs over 100k)
Taxable dividends: $4,584 (reported on 25.5% of returns)
Here:
$4,584
State:
$4,746
(% of AGI for various income ranges: 4.2% for AGIs below $10k, 3.1% for AGIs $10k-25k, 3.4% for AGIs $25k-50k, 4.6% for AGIs $50k-75k, 1.3% for AGIs $75k-100k, 2.8% for AGIs over 100k)
Net capital gain/loss: +$14,315 (reported on 22.7% of returns)
Here:
+$14,315
State:
+$23,418
(% of AGI for various income ranges: -3.8% for AGIs below $10k, -0.8% for AGIs $10k-25k, -0.4% for AGIs $25k-50k, 3.1% for AGIs $50k-75k, 7.4% for AGIs $75k-100k, 28.9% for AGIs over 100k)
Profit/loss from business: +$14,085 (reported on 20.4% of returns)
Here:
+$14,085
State:
+$16,826
(% of AGI for various income ranges: 18.9% for AGIs below $10k, 11.4% for AGIs $10k-25k, 7.3% for AGIs $25k-50k, 3.9% for AGIs $50k-75k, 11.2% for AGIs over 100k)
IRA payment deduction: $3,312 (reported on 5.1% of returns)
95415:
$3,312
California:
$3,192
Total itemized deductions: $21,638 (28% of AGI, reported on 21.9% of returns)
Here:
$21,638
State:
$28,113
Here:
27.6% of AGI
State:
25.3% of AGI
(% of AGI for various income ranges: 10.2% for AGIs $10k-25k, 9.3% for AGIs $25k-50k, 13.2% for AGIs $50k-75k, 20.8% for AGIs $75k-100k, 15.9% for AGIs over 100k)
Charity contributions deductions: $2,073 (2% of AGI, reported on 17.4% of returns)
Here:
$2,073
State:
$3,923
Here:
2.4% of AGI
State:
3.3% of AGI
(% of AGI for various income ranges: 1.0% for AGIs $10k-25k, 0.9% for AGIs $25k-50k, 0.7% for AGIs $50k-75k, 1.5% for AGIs $75k-100k, 1.2% for AGIs over 100k)
Total tax: $5,452 (reported on 66.2% of returns)
95415:
$5,452
State:
$10,761
(% of AGI for various income ranges: 4.4% for AGIs below $10k, 3.9% for AGIs $10k-25k, 6.5% for AGIs $25k-50k, 8.7% for AGIs $50k-75k, 9.3% for AGIs $75k-100k, 18.1% for AGIs over 100k)
Earned income credit: $1,694 (reported on 19.2% of returns)
Here:
$1,694
State:
$1,763
Percentage of individuals using paid preparers for their 2004 taxes: 70.5%
Here:
71%
State:
66%
(% for various income ranges: 61.1% for AGIs below $10k, 70.4% for AGIs $10k-25k, 70.8% for AGIs $25k-50k, 77.1% for AGIs $50k-75k, 79.3% for AGIs $75k-100k, 84.4% for AGIs over 100k)
Household received Food Stamps/SNAP in the past 12 months: 56 Household did not receive Food Stamps/SNAP in the past 12 months: 381
Women who did not have a birth in the past 12 months: 238 (105 now married, 132 unmarried)
Housing units in zip code 95415 with a mortgage: 73 (8 second mortgage, 9 both second mortgage and home equity loan) Median monthly owner costs for units with a mortgage: $2,641 Median monthly owner costs for units without a mortgage: $560
Residents with income below the poverty level in 2022:
This zip code:
9.0%
Whole state:
12.2%
Residents with income below 50% of the poverty level in 2022:
This zip code:
7.0%
Whole state:
6.2%
Median number of rooms in houses and condos:
Here:
5.9
State:
6.0
Median number of rooms in apartments:
Here:
4.2
State:
3.9
Notable locations in this zip code not listed on our city pages
Notable locations in zip code 95415: Van Zandts Resort (A), Milk Ranch (B), Burgess Ranch (C), Bell Valley Ranch (D), Anderson Valley Historical Museum (E), Anderson Valley Volunteer Fire Department Station 741 (F). Display/hide their locations on the map
Creeks: Donelly Creek (A), Graveyard Creek (B), Honey Creek (C), Mill Creek (D), Minnie Creek (E), Witherell Creek (F), Con Creek (G), Soda Creek (H), Robinson Creek (I). Display/hide their locations on the map
In group quarters: 1 (-1 institutionalized population)
Size of family households: 79 2-persons, 67 3-persons, 107 4-persons, 13 5-persons, 19 7-or-more-persons
Size of nonfamily households: 90 1-person, 52 2-persons, 5 3-persons
256 married couples with children.
65 single-parent households (50 men, 15 women).
54.9% of residents of 95415 zip code speak English at home.
38.5% of residents speak Spanish at home (63% very well, 16% well, 14% not well, 7% not at all).
6.6% of residents speak other Indo-European language at home (88% very well, 12% well).
Foreign born population: 304 (22.2%) (35.4% of them are naturalized citizens)
This zip code:
22.2%
Whole state:
26.7%
85%Honduras
9%Nepal
1%Malaysia
10%German
4%English
2%European
1%Irish
1%Italian
1%French Canadian
1%American
Year of entry for the foreign-born population
452010 or later
1402000 to 2009
691990 to 1999
104Before 1990
Facilities with environmental interests located in this zip code:
CAL TRANS BOONVILLE MS (HIGHWAY 128 in BOONVILLE, CA)
STATE MASTER (California - Hazardous Waste Tracking) - HAZARDOU WASTE PROGRAM Small Quantity Generators, between 100 kg and 1000 kg of hazardous waste/month (Resource Conservation and Recovery Act (tracking hazardous waste)) Organizations: CA DEPT OF TRANSPORATION (CONTACT/OPERATOR)
Alternative names: CALTRANS DISTRICT 1
ANDERSON VALLEY ELEMENTARY SCHOOL (12300 ANDERSON VALLEY WAY in BOONVILLE, CA)
(Geographic Names Information System) (National Center for Education Statistics) - STATE ID-6025084 Organizations: ANDERSON VALLEY UNIFIED (SCHOOL DISTRICT)
ANDERSON VALLEY JUNIOR-SENIOR HIGH SCHOOL (18200 MOUNTAIN VIEW ROAD in BOONVILLE, CA)
(Geographic Names Information System) (National Center for Education Statistics) - STATE ID-2330900 Organizations: ANDERSON VALLEY UNIFIED (SCHOOL DISTRICT)
Alternative names: ANDERSON VALLEY JR./SR. HIGH
ANDERSON VALLEY CHARTER NETWORK (12300 ANDERSON VALLEY WAY in BOONVILLE, CA)
(National Center for Education Statistics) - STATE ID-2330405 Organizations: ANDERSON VALLEY UNIFIED (SCHOOL DISTRICT)
ANDERSON VALLEY HIGH SCHOOL (13630 MT VIEW RD in BOONVILLE, CA)
COMPLIANCE ACTIVITY (Tracking inspections of insecticide, fungicide, and rodenticide, and toxic substances)
ANDERSON VALLEY UNIFIED SCHOOL DISTRICT (12300 ANDERSON VALLEY WAY in BOONVILLE, CA)
COMPLIANCE ACTIVITY (Tracking inspections of insecticide, fungicide, and rodenticide, and toxic substances)
Housing units lacking complete kitchen facilities: 1.4%
33.9%Electricity
30.2%Bottled, tank, or LP gas
17.1%Wood
9.4%Fuel oil, kerosene, etc.
7.0%Utility gas
3.0%No fuel used
Population in 1990: 1,744.
Place of birth for U.S.-born residents:
This state: 657
Northeast: 41
Midwest: 138
South: 101
West: 58
71% of the 95415 zip code residents lived in the same house 5 years ago. Out of people who lived in different houses, 77% lived in this county. Out of people who lived in different counties, 50% lived in California.
96% of the 95415 zip code residents lived in the same house 1 year ago. Out of people who lived in different houses, 49% moved from this county. Out of people who lived in different houses, 60% moved from different county within same state.
Private vs. public school enrollment:
Students in private schools in grades 1 to 8 (elementary and middle school):
Here:
0.0%
California:
10.5%
Students in private schools in grades 9 to 12 (high school):
Here:
0.0%
California:
8.5%
Students in private undergraduate colleges:
Here:
0.0%
California:
15.9%
Occupation by median earnings in the past 12 months ($)
77,939Management occupations
36,207Building and grounds cleaning and maintenance occupations
25,807Production occupations
21,558Office and administrative support occupations
14,123Farming, fishing, and forestry occupations
Top industries in this zip code by the number of employees in 2005:
Health Care and Social Assistance: All Other Outpatient Care Centers (20-49 employees: 1 establishment)
Accommodation and Food Services: Full-Service Restaurants (10-19: 1, 5-9: 2)
Health Care and Social Assistance: Child and Youth Services (5-9: 1)
People in group quarters in 2010:
5 people in group homes for juveniles (non-correctional)
People in group quarters in 2000:
12 people in homes or halfway houses for drug/alcohol abuse
Most common first names in zip code 95415 among deceased individuals
Name
Count
Lived (average)
John
9
84.5 years
James
8
69.6 years
William
6
73.7 years
Evelyn
4
82.5 years
Edith
4
88.7 years
Margaret
4
74.5 years
Mary
4
77.0 years
Robert
4
67.7 years
Walter
4
82.2 years
Ruth
3
83.3 years
Most common last names in zip code 95415 among deceased individuals
Last name
Count
Lived (average)
Clark
6
82.5 years
Knivila
3
75.6 years
Adams
3
86.6 years
Davis
3
74.6 years
Farrer
3
86.4 years
Hanes
3
89.4 years
Johnson
3
72.0 years
June
3
74.3 years
Burger
3
73.7 years
Combs
3
85.3 years
Discuss Boonville, California (CA) on our hugely popular California forum.


 Nearest zip codes: 95494, 95466, 95482, 95445, 95459, 95463.


