Estimated zip code population in 2022: 1,774 Zip code population in 2010: 1,739 Zip code population in 2000: 1,437
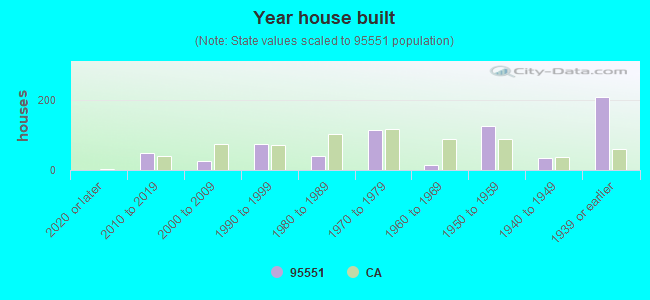
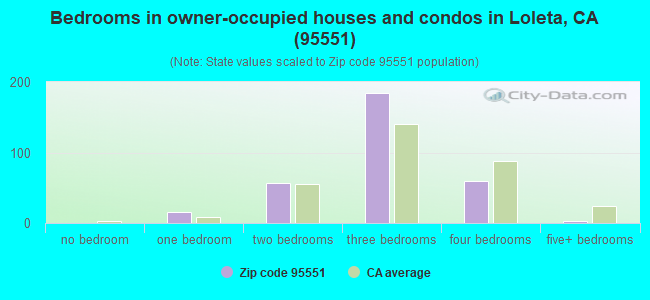
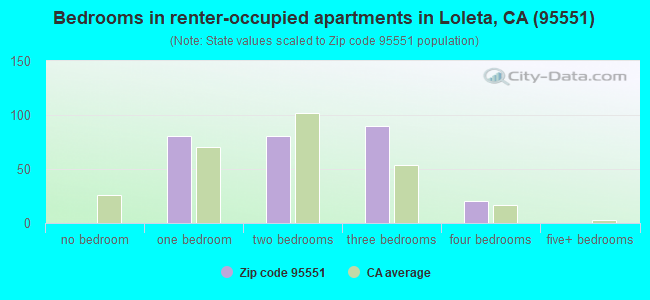
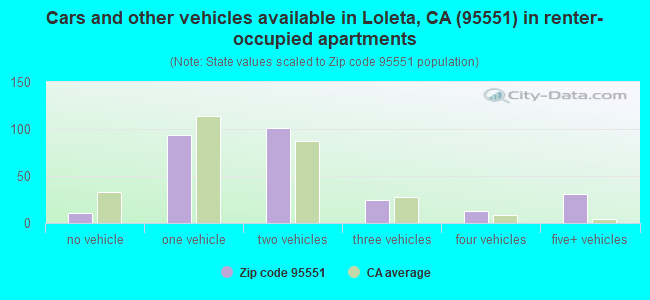
Houses and condos: 693 Renter-occupied apartments: 274
% of renters here:
46%
State:
44%
March 2022 cost of living index in zip code 95551: 96.8 (near average, U.S. average is 100)
Land area: 42.6 sq. mi. Water area: 10.3 sq. mi.
Population density: 42 people per square mile
(very low).
OSM Map
General Map
Google Map
MSN Map
OSM Map
General Map
Google Map
MSN Map
OSM Map
General Map
Google Map
MSN Map
OSM Map
General Map
Google Map
MSN Map
Please wait while loading the map...
Real estate property taxes paid for housing units in 2022:
This zip code:
0.7% ($3,388)
California:
0.7% ($4,831)
Median real estate property taxes paid for housing units with mortgages in 2022: $2,993 (0.6%) Median real estate property taxes paid for housing units with no mortgage in 2022: $5,306 (0.9%)
Business Search- 14 Million verified businesses
Males: 969
(54.6%)
Females: 804
(45.4%)
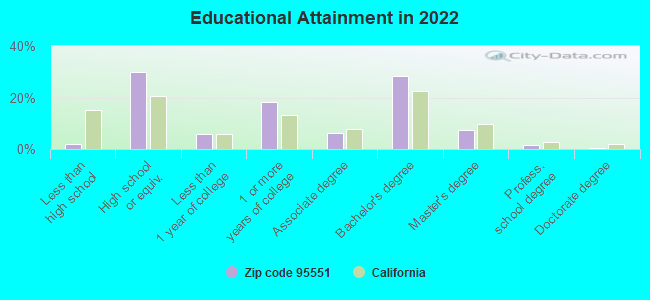
For population 25 years and over in 95551:
High school or higher: 97.5%
Bachelor's degree or higher: 37.3%
Graduate or professional degree: 9.3%
Unemployed: 10.3%
Mean travel time to work (commute): 18.3 minutes
For population 15 years and over in 95551:
Never married: 49.8%
Now married: 40.7%
Separated: 0.9%
Widowed: 2.7%
Divorced: 6.0%
Zip code 95551 compared to state average:
Unemployed percentage above state average.
Black race population percentage below state average.
Hispanic race population percentage below state average.
Foreign-born population percentage significantly below state average.
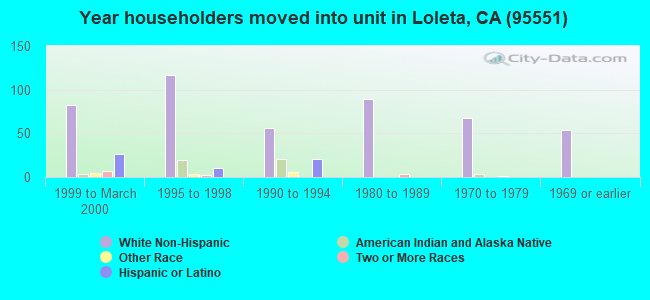
Length of stay since moving in significantly above state average.
Averages for the 2020 tax year for zip code 95551, filed in 2021:
Average Adjusted Gross Income (AGI) in 2020: $58,883 (Individual Income Tax Returns)
Here:
$58,883
State:
$95,910
Salary/wage: $47,527 (reported on 77.5% of returns)
Here:
$47,527
State:
$77,331
(% of AGI for various income ranges: 1285.0% for AGIs below $25k, 3653.8% for AGIs $25k-50k, 6425.7% for AGIs $50k-75k, 9866.7% for AGIs $75k-100k, 22074.0% for AGIs $100k-200k)
Taxable interest for individuals: $2,200 (reported on 35.2% of returns)
This zip code:
$2,200
California:
$2,294
(% of AGI for various income ranges: 25.0% for AGIs below $25k, 11.9% for AGIs $25k-50k, 7.1% for AGIs $50k-75k, 116.7% for AGIs $75k-100k, 912.0% for AGIs $100k-200k)
Ordinary dividends: $4,145 (reported on 15.5% of returns)
Here:
$4,145
State:
$10,949
(% of AGI for various income ranges: 92.1% for AGIs below $25k, 22.5% for AGIs $25k-50k, 131.4% for AGIs $50k-75k, 398.0% for AGIs $100k-200k)
Net capital gain/loss in AGI: +$5,709 (reported on 15.5% of returns)
Here:
+$5,709
State:
+$49,306
(% of AGI for various income ranges: 20.0% for AGIs below $25k, 72.5% for AGIs $25k-50k, 194.3% for AGIs $50k-75k, 696.0% for AGIs $100k-200k)
Profit/loss from business: +$16,227 (reported on 15.5% of returns)
Here:
+$16,227
State:
+$15,671
(% of AGI for various income ranges: 140.7% for AGIs below $25k, 323.1% for AGIs $25k-50k, 2142.0% for AGIs $100k-200k)
Taxable individual retirement arrangement distribution: $7,950 (reported on 5.6% of returns)
95551:
$7,950
California:
$23,505
(% of AGI for various income ranges: 454.3% for AGIs $50k-75k)
Total itemized deductions: $26,700 (reported on 7.0% of returns)
Here:
$26,700
State:
$39,517
(% of AGI for various income ranges: 240.7% for AGIs below $25k, 1996.0% for AGIs $100k-200k)
Charity contributions: $2,033 (reported on 4.2% of returns)
Here:
$2,033
State:
$12,598
(% of AGI for various income ranges: 122.0% for AGIs $100k-200k)
Taxes paid: $8,200 (reported on 7.0% of returns)
95551:
$8,200
State:
$8,807
(% of AGI for various income ranges: 820.0% for AGIs $100k-200k)
Earned income credit: $2,242 (reported on 16.9% of returns)
Here:
$2,242
State:
$2,074
(% of AGI for various income ranges: 100.7% for AGIs below $25k, 80.0% for AGIs $25k-50k)
Percentage of individuals using paid preparers for their 2020 taxes: 95.8%
Here:
96%
State:
92%
(% for various income ranges: 90.9% for AGIs below $25k, 95.5% for AGIs $25k-50k, 100.0% for AGIs $50k-75k, 100.0% for AGIs $75k-100k, 100.0% for AGIs $100k-200k, 100.0% for AGIs over 200k)
Averages for the 2012 tax year for zip code 95551, filed in 2013:
Average Adjusted Gross Income (AGI) in 2012: $58,800 (Individual Income Tax Returns)
Here:
$58,800
State:
$72,726
Salary/wage: $40,747 (reported on 82.5% of returns)
Here:
$40,747
State:
$59,079
(% of AGI for various income ranges: 70.5% for AGIs below $25k, 71.0% for AGIs $25k-50k, 73.3% for AGIs $50k-75k, 70.7% for AGIs $75k-100k, 41.1% for AGIs $100k-200k)
Taxable interest for individuals: $1,604 (reported on 40.4% of returns)
This zip code:
$1,604
California:
$2,146
(% of AGI for various income ranges: 0.5% for AGIs below $25k, 0.2% for AGIs $25k-50k, 0.3% for AGIs $50k-75k, 0.2% for AGIs $75k-100k, 2.0% for AGIs $100k-200k)
Ordinary dividends: $2,790 (reported on 17.5% of returns)
Here:
$2,790
State:
$9,308
(% of AGI for various income ranges: 1.6% for AGIs $25k-50k, 1.3% for AGIs $50k-75k, 0.7% for AGIs $100k-200k)
Net capital gain/loss in AGI: +$17,578 (reported on 15.8% of returns)
Here:
+$17,578
State:
+$30,460
(% of AGI for various income ranges: 2.0% for AGIs below $25k, 2.3% for AGIs $50k-75k, 8.8% for AGIs $100k-200k)
Profit/loss from business: +$12,233 (reported on 21.1% of returns)
Here:
+$12,233
State:
+$17,064
(% of AGI for various income ranges: 14.1% for AGIs below $25k, 5.7% for AGIs $25k-50k, 9.2% for AGIs $50k-75k, 7.3% for AGIs $75k-100k)
Taxable individual retirement arrangement distribution: $7,125 (reported on 7.0% of returns)
95551:
$7,125
California:
$19,557
Total itemized deductions: $24,271 (20% of AGI, reported on 29.8% of returns)
Here:
$24,271
State:
$34,004
Here:
20.4% of AGI
State:
22.7% of AGI
(% of AGI for various income ranges: 12.7% for AGIs $25k-50k, 13.2% for AGIs $50k-75k, 16.4% for AGIs $75k-100k, 12.8% for AGIs $100k-200k)
Charity contributions: $3,570 (reported on 17.5% of returns)
Here:
$3,570
State:
$4,659
(% of AGI for various income ranges: 2.4% for AGIs below $25k, 1.0% for AGIs $50k-75k, 2.0% for AGIs $75k-100k, 1.0% for AGIs $100k-200k)
Taxes paid: $10,247 (reported on 29.8% of returns)
95551:
$10,247
State:
$14,448
(% of AGI for various income ranges: 2.2% for AGIs $25k-50k, 4.0% for AGIs $50k-75k, 4.7% for AGIs $75k-100k, 7.7% for AGIs $100k-200k)
Earned income credit: $1,845 (reported on 19.3% of returns)
Here:
$1,845
State:
$2,286
(% of AGI for various income ranges: 5.0% for AGIs below $25k, 1.4% for AGIs $25k-50k)
Percentage of individuals using paid preparers for their 2012 taxes: 61.4%
Here:
61%
State:
64%
(% for various income ranges: 52.4% for AGIs below $25k, 56.2% for AGIs $25k-50k, 66.7% for AGIs $50k-75k, 75.0% for AGIs $75k-100k, 85.7% for AGIs $100k-200k)
Averages for the 2004 tax year for zip code 95551, filed in 2005:
Average Adjusted Gross Income (AGI) in 2004: $36,155 (Individual Income Tax Returns)
Here:
$36,155
State:
$58,600
Salary/wage: $31,294 (reported on 81.6% of returns)
Here:
$31,294
State:
$49,455
(% of AGI for various income ranges: 106.2% for AGIs below $10k, 75.3% for AGIs $10k-25k, 73.2% for AGIs $25k-50k, 80.1% for AGIs $50k-75k, 67.4% for AGIs $75k-100k, 49.9% for AGIs over 100k)
Taxable interest for individuals: $1,670 (reported on 48.2% of returns)
This zip code:
$1,670
California:
$2,365
(% of AGI for various income ranges: 6.4% for AGIs below $10k, 3.2% for AGIs $10k-25k, 1.9% for AGIs $25k-50k, 1.4% for AGIs $50k-75k, 0.5% for AGIs $75k-100k, 3.9% for AGIs over 100k)
Taxable dividends: $2,444 (reported on 21.1% of returns)
Here:
$2,444
State:
$4,746
(% of AGI for various income ranges: 2.0% for AGIs below $10k, 0.9% for AGIs $10k-25k, 1.8% for AGIs $25k-50k, 1.4% for AGIs $50k-75k, 0.6% for AGIs $75k-100k, 1.8% for AGIs over 100k)
Net capital gain/loss: +$4,748 (reported on 18.6% of returns)
Here:
+$4,748
State:
+$23,418
(% of AGI for various income ranges: -4.9% for AGIs below $10k, -0.3% for AGIs $10k-25k, 0.0% for AGIs $25k-50k, 1.3% for AGIs $50k-75k, 2.6% for AGIs $75k-100k, 9.8% for AGIs over 100k)
Profit/loss from business: +$10,095 (reported on 17.1% of returns)
Here:
+$10,095
State:
+$16,826
(% of AGI for various income ranges: 13.7% for AGIs below $10k, 7.0% for AGIs $10k-25k, 6.0% for AGIs $25k-50k, 1.9% for AGIs $50k-75k, 11.3% for AGIs $75k-100k)
IRA payment deduction: $3,143 (reported on 3.8% of returns)
95551:
$3,143
California:
$3,192
Total itemized deductions: $16,494 (26% of AGI, reported on 28.2% of returns)
Here:
$16,494
State:
$28,113
Here:
25.8% of AGI
State:
25.3% of AGI
(% of AGI for various income ranges: 14.0% for AGIs $10k-25k, 9.0% for AGIs $25k-50k, 15.9% for AGIs $50k-75k, 14.8% for AGIs $75k-100k, 13.8% for AGIs over 100k)
Charity contributions deductions: $2,272 (3% of AGI, reported on 22.6% of returns)
Here:
$2,272
State:
$3,923
Here:
3.4% of AGI
State:
3.3% of AGI
(% of AGI for various income ranges: 3.3% for AGIs below $10k, 1.1% for AGIs $25k-50k, 1.6% for AGIs $50k-75k, 2.3% for AGIs $75k-100k, 1.7% for AGIs over 100k)
Total tax: $4,808 (reported on 70.6% of returns)
95551:
$4,808
State:
$10,761
(% of AGI for various income ranges: 2.7% for AGIs below $10k, 4.0% for AGIs $10k-25k, 6.9% for AGIs $25k-50k, 8.3% for AGIs $50k-75k, 9.0% for AGIs $75k-100k, 18.7% for AGIs over 100k)
Earned income credit: $1,413 (reported on 18.8% of returns)
Here:
$1,413
State:
$1,763
Percentage of individuals using paid preparers for their 2004 taxes: 61.7%
Here:
62%
State:
66%
(% for various income ranges: 62.1% for AGIs below $10k, 51.8% for AGIs $10k-25k, 61.5% for AGIs $25k-50k, 65.9% for AGIs $50k-75k, 67.7% for AGIs $75k-100k, 92.9% for AGIs over 100k)
Household received Food Stamps/SNAP in the past 12 months: 45 Household did not receive Food Stamps/SNAP in the past 12 months: 543
Women who had a birth in the past 12 months: 1 (0 now married, 2 unmarried) Women who did not have a birth in the past 12 months: 398 (140 now married, 258 unmarried)
Housing units in zip code 95551 with a mortgage: 120 (3 second mortgage, 3 both second mortgage and home equity loan) Median monthly owner costs for units with a mortgage: $1,937 Median monthly owner costs for units without a mortgage: $715
Residents with income below the poverty level in 2022:
This zip code:
7.0%
Whole state:
12.2%
Residents with income below 50% of the poverty level in 2022:
This zip code:
1.1%
Whole state:
6.2%
Median number of rooms in houses and condos:
Here:
6.1
State:
6.0
Median number of rooms in apartments:
Here:
4.7
State:
3.9
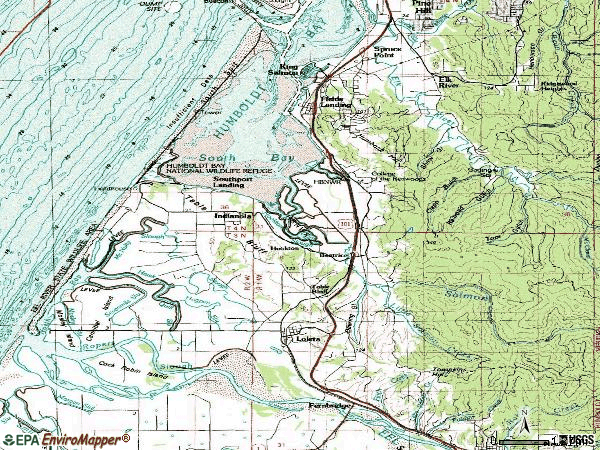
Notable locations in this zip code not listed on our city pages
Notable locations in zip code 95551: Table Bluff Lighthouse (A), Ocean Ranch (B), Loleta Volunteer Fire Department Station 2 Storage (C), Loleta Volunteer Fire Department (D). Display/hide their locations on the map
Churches in zip code 95551 include: Loleta Community Evangelical Free Church (A), Saint Patricks Catholic Church (B). Display/hide their locations on the map
Parks in zip code 95551 include: Humboldt Bay National Wildlife Refuge (1), Crab Park (2), Table Bluff County Park (3). Display/hide their locations on the map
175 married couples with children.
39 single-parent households (7 men, 32 women).
88.0% of residents of 95551 zip code speak English at home.
8.9% of residents speak Spanish at home (94% very well, 6% not well).
0.9% of residents speak other Indo-European language at home (73% very well, 27% well).
1.0% of residents speak other language at home (100% very well).
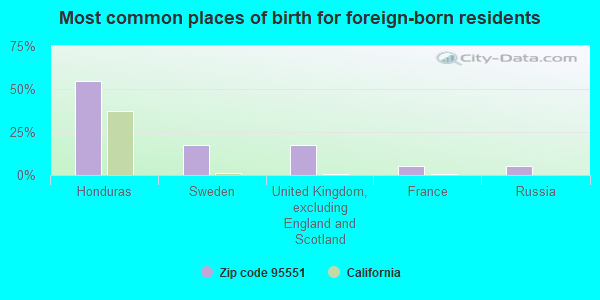
Foreign born population: 58 (3.3%) (67.6% of them are naturalized citizens)
This zip code:
3.3%
Whole state:
26.7%
54%Honduras
18%Sweden
18%United Kingdom, excluding England and Scotland
5%France
5%Russia
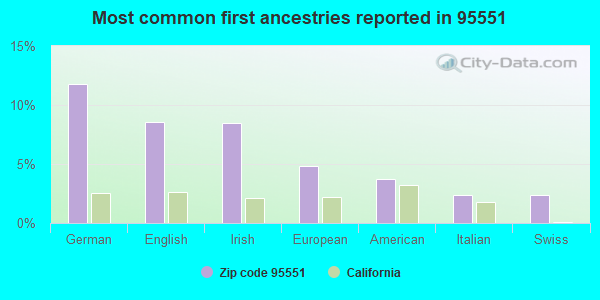
12%German
9%English
8%Irish
5%European
4%American
2%Italian
2%Swiss
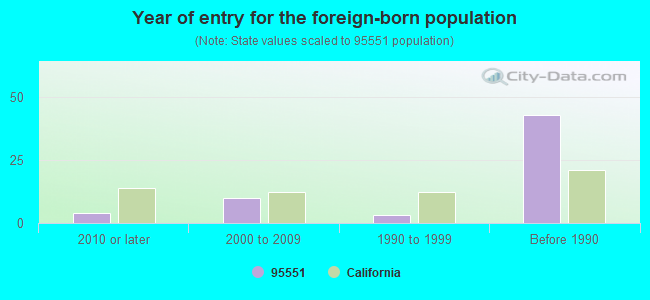
Year of entry for the foreign-born population
42010 or later
102000 to 2009
31990 to 1999
43Before 1990
Facilities with environmental interests located in this zip code:
LOLETA ELEMENTARY (700 LOLETA DR. in LOLETA, CA)
(National Center for Education Statistics) - STATE ID-6008023 Organizations: LOLETA UNION ELEMENTARY (SCHOOL DISTRICT)
LOLETA POTW (EEL RIVER DR in LOLETA, CA)
National Pollutant Discharge Elimination System NON-MAJOR (Tracking pollutant discharge elimination systems) - permit Business SIC classification: SEWERAGE SYSTEMS Organizations: LOLETA CSD (CONTACT/OWNER)
Alternative names: LOLETA CSD, LOLETA SANITARY DISTRICT
HUMBOLDT CREAMERY LOLETA DIV (281 LOLETA DR in LOLETA, CA)
TRI REPORTER (Tracking of toxic chemicals releasing facilities) Business SIC classification: DRY, CONDENSED, AND EVAPORATED DAIRY PRODUCTS
Housing units lacking complete plumbing facilities: 3.4% Housing units lacking complete kitchen facilities: 3.1%
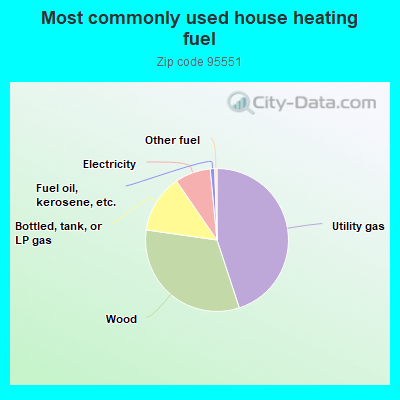
45.1%Utility gas
32.4%Wood
13.2%Bottled, tank, or LP gas
8.1%Electricity
1.0%Fuel oil, kerosene, etc.
0.5%Other fuel
Population in 1990: 1,244. Population change in the 1990s: +193 (+15.5%).
Place of birth for U.S.-born residents:
This state: 1,391
Northeast: 70
Midwest: 77
South: 39
West: 125
56% of the 95551 zip code residents lived in the same house 5 years ago. Out of people who lived in different houses, 72% lived in this county. Out of people who lived in different counties, 50% lived in California.
88% of the 95551 zip code residents lived in the same house 1 year ago. Out of people who lived in different houses, 90% moved from this county. Out of people who lived in different houses, 4% moved from different state.
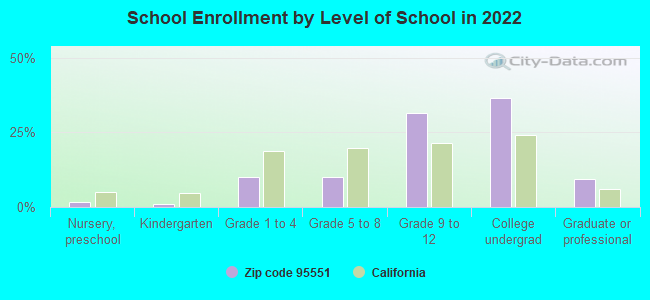
Private vs. public school enrollment:
Students in private schools in grades 1 to 8 (elementary and middle school): 5
Here:
5.1%
California:
10.5%
Students in private schools in grades 9 to 12 (high school): 19
Here:
11.7%
California:
8.5%
Students in private undergraduate colleges: 21
Here:
11.1%
California:
15.9%
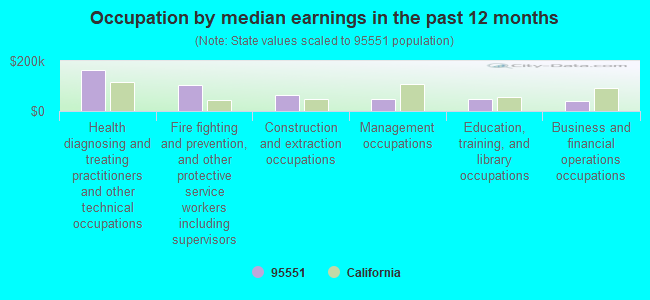
Occupation by median earnings in the past 12 months ($)
164,551Health diagnosing and treating practitioners and other technical occupations
104,763Fire fighting and prevention, and other protective service workers including supervisors
63,580Construction and extraction occupations
46,685Management occupations
46,160Education, training, and library occupations
40,165Business and financial operations occupations
Top industries in this zip code by the number of employees in 2005:
Construction: Highway, Street, and Bridge Construction (10-19 employees: 1 establishment, 1-4 employees: 1 establishment)
Construction: Commercial and Institutional Building Construction (5-9: 1, 1-4: 1)
Accommodation and Food Services: Full-Service Restaurants (5-9: 1)
Real Estate and Rental and Leasing: Residential Property Managers (5-9: 1)
Wholesale Trade: Other Grocery and Related Products Merchant Wholesalers (5-9: 1)
Fatal accident statistics in 2012:
Fatal accident count: 1
Vehicles involved in fatal accidents: 2
Fatal accidents caused by drunken drivers: 1
Fatalities: 1
Persons involved in fatal accidents: 2
Pedestrians involved in fatal accidents: 0
Fatal accident statistics in 2011:
Fatal accident count: 2
Vehicles involved in fatal accidents: 2
Fatal accidents caused by drunken drivers: 1
Fatalities: 3
Persons involved in fatal accidents: 3
Pedestrians involved in fatal accidents: 0
Most common first names in zip code 95551 among deceased individuals
Name
Count
Lived (average)
John
9
76.0 years
Robert
7
67.9 years
William
7
71.1 years
Henry
6
74.8 years
Charles
6
83.5 years
James
6
77.1 years
Frances
5
81.2 years
Clarence
5
73.2 years
Mary
5
79.4 years
Rose
4
79.5 years
Most common last names in zip code 95551 among deceased individuals
Last name
Count
Lived (average)
James
6
76.7 years
Johnson
6
74.5 years
Belli
5
79.2 years
Pedrazzini
5
90.2 years
Thomsen
5
81.4 years
Toroni
5
69.8 years
Biondini
4
82.7 years
Anderson
4
91.5 years
Davy
4
80.7 years
Hansen
4
69.0 years
Discuss Loleta, California (CA) on our hugely popular California forum.

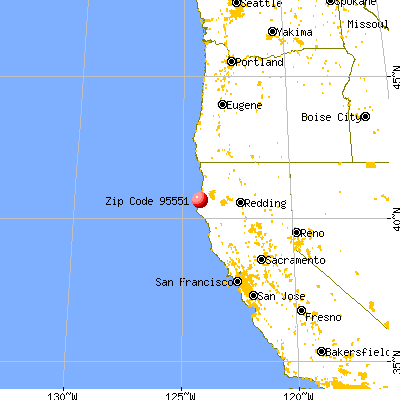


 Nearest zip codes: 95537, 95564, 95540, 95503, 95501, 95536.