Estimated zip code population in 2022: 1,449 Zip code population in 2010: 1,239 Zip code population in 2000: 1,401
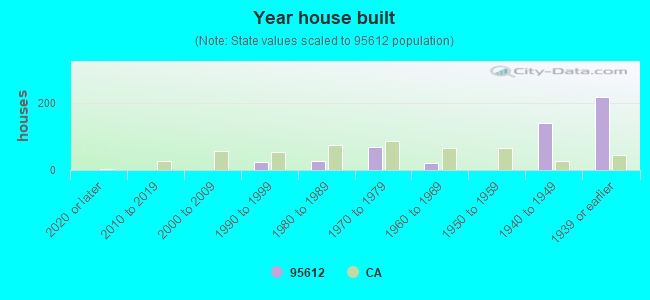
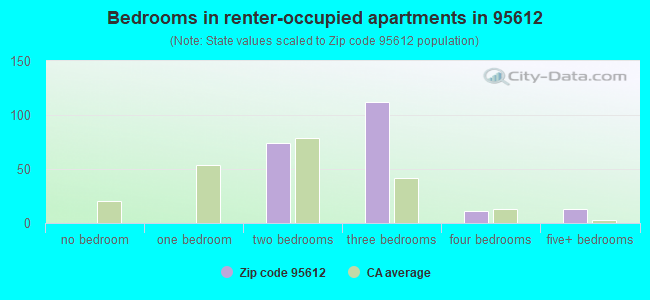
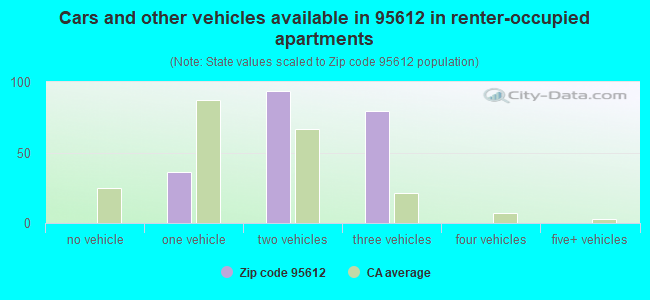
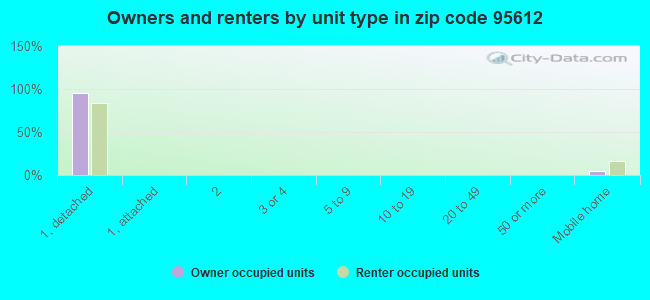
Houses and condos: 506 Renter-occupied apartments: 210
% of renters here:
45%
State:
44%
March 2022 cost of living index in zip code 95612: 100.5 (near average, U.S. average is 100)
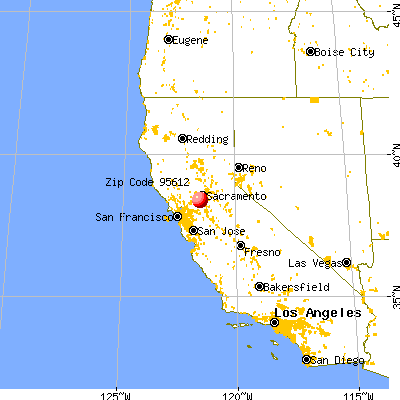
Land area: 55.5 sq. mi. Water area: 2.8 sq. mi.
Population density: 26 people per square mile
(very low).
OSM Map
General Map
Google Map
MSN Map
OSM Map
General Map
Google Map
MSN Map
OSM Map
General Map
Google Map
MSN Map
OSM Map
General Map
Google Map
MSN Map
Please wait while loading the map...
Real estate property taxes paid for housing units in 2022:
This zip code:
0.9% ($8,433)
California:
0.7% ($4,831)
Median real estate property taxes paid for housing units with mortgages in 2022: $10,034 (0.9%) Median real estate property taxes paid for housing units with no mortgage in 2022: $3,584 (0.5%)
Business Search- 14 Million verified businesses
Males: 714
(49.3%)
Females: 735
(50.7%)
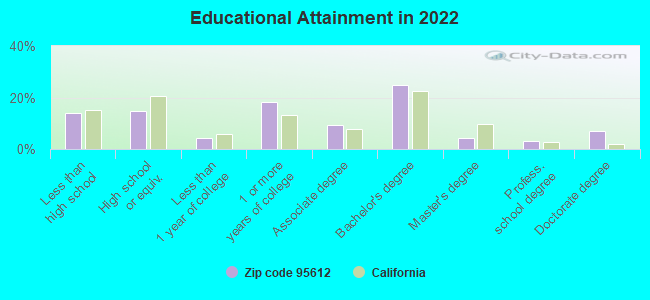
For population 25 years and over in 95612:
High school or higher: 86.2%
Bachelor's degree or higher: 39.2%
Graduate or professional degree: 14.5%
Unemployed: 4.9%
Mean travel time to work (commute): 38.5 minutes
For population 15 years and over in 95612:
Never married: 29.8%
Now married: 56.9%
Separated: 4.8%
Widowed: 3.4%
Divorced: 5.1%
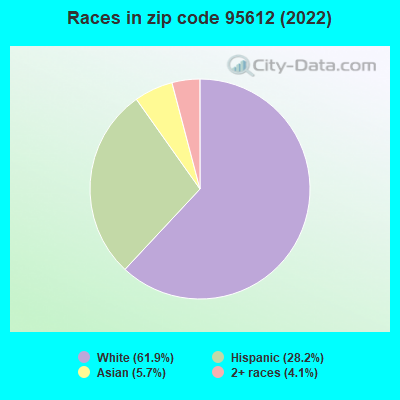
Zip code 95612 compared to state average:
Black race population percentage significantly below state average.
Median age above state average.
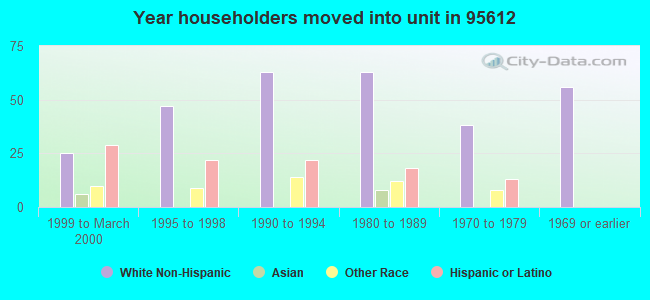
Length of stay since moving in significantly above state average.
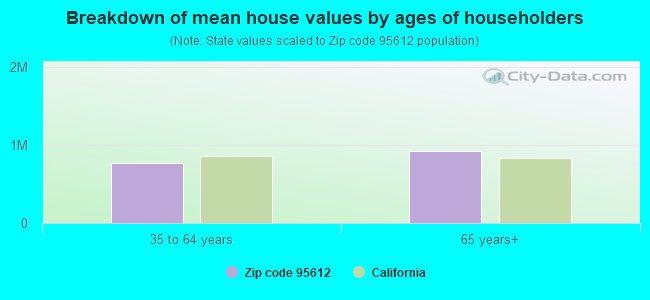
Estimated median house/condo value in 2022: $906,032
95612:
$906,032
California:
$715,900
Median resident age:
This zip code:
45.2 years
California median age:
37.9 years
Average household size:
This zip code:
3.1 people
California:
2.8 people
Averages for the 2020 tax year for zip code 95612, filed in 2021:
Average Adjusted Gross Income (AGI) in 2020: $143,795 (Individual Income Tax Returns)
Here:
$143,795
State:
$95,910
Salary/wage: $70,102 (reported on 75.0% of returns)
Here:
$70,102
State:
$77,331
(% of AGI for various income ranges: 1657.1% for AGIs below $25k, 5000.0% for AGIs $25k-50k, 7885.0% for AGIs $50k-75k, 11043.3% for AGIs $75k-100k, 15013.3% for AGIs $100k-200k)
Taxable interest for individuals: $5,030 (reported on 42.2% of returns)
This zip code:
$5,030
California:
$2,294
(% of AGI for various income ranges: 10.0% for AGIs below $25k, 30.0% for AGIs $25k-50k, 38.3% for AGIs $50k-75k, 30.0% for AGIs $75k-100k, 185.0% for AGIs $100k-200k)
Ordinary dividends: $6,414 (reported on 21.9% of returns)
Here:
$6,414
State:
$10,949
(% of AGI for various income ranges: 135.7% for AGIs below $25k, 288.3% for AGIs $50k-75k, 313.3% for AGIs $100k-200k)
Net capital gain/loss in AGI: +$33,033 (reported on 23.4% of returns)
Here:
+$33,033
State:
+$49,306
(% of AGI for various income ranges: 57.1% for AGIs below $25k, 415.0% for AGIs $50k-75k, 635.0% for AGIs $100k-200k)
Profit/loss from business: +$18,262 (reported on 12.5% of returns)
Here:
+$18,262
State:
+$15,671
(% of AGI for various income ranges: 515.7% for AGIs below $25k, 1223.3% for AGIs $50k-75k, 610.0% for AGIs $100k-200k)
Taxable individual retirement arrangement distribution: $20,017 (reported on 9.4% of returns)
95612:
$20,017
California:
$23,505
(% of AGI for various income ranges: 675.0% for AGIs $50k-75k, 1326.7% for AGIs $100k-200k)
Total itemized deductions: $38,544 (reported on 14.1% of returns)
Here:
$38,544
State:
$39,517
(% of AGI for various income ranges: 641.1% for AGIs $25k-50k, 2173.3% for AGIs $100k-200k)
Charity contributions: $7,412 (reported on 12.5% of returns)
Here:
$7,412
State:
$12,598
(% of AGI for various income ranges: 350.0% for AGIs $100k-200k)
Taxes paid: $8,967 (reported on 14.1% of returns)
95612:
$8,967
State:
$8,807
(% of AGI for various income ranges: 144.4% for AGIs $25k-50k, 610.0% for AGIs $100k-200k)
Earned income credit: $2,650 (reported on 6.2% of returns)
Here:
$2,650
State:
$2,074
(% of AGI for various income ranges: 117.8% for AGIs $25k-50k)
Percentage of individuals using paid preparers for their 2020 taxes: 89.1%
Here:
89%
State:
92%
(% for various income ranges: 84.6% for AGIs below $25k, 87.5% for AGIs $25k-50k, 90.9% for AGIs $50k-75k, 100.0% for AGIs $75k-100k, 91.7% for AGIs $100k-200k, 83.3% for AGIs over 200k)
Averages for the 2012 tax year for zip code 95612, filed in 2013:
Average Adjusted Gross Income (AGI) in 2012: $81,076 (Individual Income Tax Returns)
Here:
$81,076
State:
$72,726
Salary/wage: $52,569 (reported on 81.0% of returns)
Here:
$52,569
State:
$59,079
(% of AGI for various income ranges: 76.0% for AGIs below $25k, 78.8% for AGIs $25k-50k, 68.4% for AGIs $50k-75k, 60.7% for AGIs $75k-100k, 53.4% for AGIs $100k-200k, 34.5% for AGIs over 200k)
Taxable interest for individuals: $1,772 (reported on 46.0% of returns)
This zip code:
$1,772
California:
$2,146
(% of AGI for various income ranges: 2.0% for AGIs below $25k, 0.8% for AGIs $25k-50k, 0.4% for AGIs $50k-75k, 0.8% for AGIs $75k-100k, 0.9% for AGIs $100k-200k, 1.2% for AGIs over 200k)
Ordinary dividends: $4,335 (reported on 27.0% of returns)
Here:
$4,335
State:
$9,308
(% of AGI for various income ranges: 2.3% for AGIs $25k-50k, 1.2% for AGIs $50k-75k, 1.4% for AGIs $75k-100k, 2.5% for AGIs $100k-200k, 0.8% for AGIs over 200k)
Net capital gain/loss in AGI: +$7,838 (reported on 20.6% of returns)
Here:
+$7,838
State:
+$30,460
(% of AGI for various income ranges: 6.3% for AGIs $100k-200k, 1.4% for AGIs over 200k)
Profit/loss from business: +$8,825 (reported on 12.7% of returns)
Here:
+$8,825
State:
+$17,064
(% of AGI for various income ranges: 12.0% for AGIs below $25k, 7.6% for AGIs $50k-75k, 0.2% for AGIs $100k-200k)
Taxable individual retirement arrangement distribution: $12,622 (reported on 14.3% of returns)
95612:
$12,622
California:
$19,557
(% of AGI for various income ranges: 9.2% for AGIs below $25k, 5.7% for AGIs $50k-75k, 4.9% for AGIs $100k-200k)
Total itemized deductions: $35,309 (22% of AGI, reported on 34.9% of returns)
Here:
$35,309
State:
$34,004
Here:
22.5% of AGI
State:
22.7% of AGI
(% of AGI for various income ranges: 13.7% for AGIs $25k-50k, 11.0% for AGIs $50k-75k, 14.3% for AGIs $75k-100k, 18.6% for AGIs $100k-200k, 16.9% for AGIs over 200k)
Charity contributions: $3,689 (reported on 30.2% of returns)
Here:
$3,689
State:
$4,659
(% of AGI for various income ranges: 1.4% for AGIs below $25k, 1.3% for AGIs $50k-75k, 1.8% for AGIs $75k-100k, 2.0% for AGIs $100k-200k, 1.2% for AGIs over 200k)
Taxes paid: $17,495 (reported on 33.3% of returns)
95612:
$17,495
State:
$14,448
(% of AGI for various income ranges: 2.4% for AGIs $25k-50k, 2.8% for AGIs $50k-75k, 4.4% for AGIs $75k-100k, 6.0% for AGIs $100k-200k, 12.3% for AGIs over 200k)
Earned income credit: $2,457 (reported on 11.1% of returns)
Here:
$2,457
State:
$2,286
(% of AGI for various income ranges: 4.5% for AGIs below $25k, 0.9% for AGIs $25k-50k)
Percentage of individuals using paid preparers for their 2012 taxes: 73.0%
Here:
73%
State:
64%
(% for various income ranges: 68.4% for AGIs below $25k, 80.0% for AGIs $25k-50k, 62.5% for AGIs $50k-75k, 62.5% for AGIs $75k-100k, 77.8% for AGIs $100k-200k, 100.0% for AGIs over 200k)
Averages for the 2004 tax year for zip code 95612, filed in 2005:
Average Adjusted Gross Income (AGI) in 2004: $58,981 (Individual Income Tax Returns)
Here:
$58,981
State:
$58,600
Salary/wage: $48,020 (reported on 79.8% of returns)
Here:
$48,020
State:
$49,455
(% of AGI for various income ranges: 76.7% for AGIs $10k-25k, 71.1% for AGIs $25k-50k, 74.4% for AGIs $50k-75k, 67.9% for AGIs $75k-100k, 55.3% for AGIs over 100k)
Taxable interest for individuals: $2,943 (reported on 52.8% of returns)
This zip code:
$2,943
California:
$2,365
(% of AGI for various income ranges: 3.7% for AGIs $10k-25k, 2.7% for AGIs $25k-50k, 1.2% for AGIs $50k-75k, 2.7% for AGIs $75k-100k, 2.7% for AGIs over 100k)
Taxable dividends: $3,089 (reported on 28.4% of returns)
Here:
$3,089
State:
$4,746
(% of AGI for various income ranges: 1.5% for AGIs $10k-25k, 1.9% for AGIs $25k-50k, 1.2% for AGIs $50k-75k, 0.9% for AGIs $75k-100k, 1.4% for AGIs over 100k)
Net capital gain/loss: +$17,372 (reported on 24.6% of returns)
Here:
+$17,372
State:
+$23,418
(% of AGI for various income ranges: -0.6% for AGIs $10k-25k, 1.5% for AGIs $25k-50k, 0.2% for AGIs $50k-75k, 0.4% for AGIs $75k-100k, 13.9% for AGIs over 100k)
Profit/loss from business: +$25,961 (reported on 12.0% of returns)
Here:
+$25,961
State:
+$16,826
Profit/loss from farming: +$3,194 (reported on 4.9% of returns)
Here:
+$3,194
State:
-$7,562
IRA payment deduction: $4,000 (reported on 2.5% of returns)
95612:
$4,000
California:
$3,192
Self-employed pension: $7,667 (reported on 1.9% of returns)
Here:
$7,667
California:
$17,688
Total itemized deductions: $24,600 (21% of AGI, reported on 33.2% of returns)
Here:
$24,600
State:
$28,113
Here:
21.1% of AGI
State:
25.3% of AGI
(% of AGI for various income ranges: 11.3% for AGIs $25k-50k, 12.5% for AGIs $50k-75k, 15.9% for AGIs $75k-100k, 15.0% for AGIs over 100k)
Charity contributions deductions: $3,489 (3% of AGI, reported on 29.4% of returns)
Here:
$3,489
State:
$3,923
Here:
3.2% of AGI
State:
3.3% of AGI
(% of AGI for various income ranges: 1.7% for AGIs $25k-50k, 1.8% for AGIs $50k-75k, 1.1% for AGIs $75k-100k, 2.0% for AGIs over 100k)
Total tax: $10,946 (reported on 76.3% of returns)
95612:
$10,946
State:
$10,761
(% of AGI for various income ranges: 3.5% for AGIs $10k-25k, 6.6% for AGIs $25k-50k, 10.3% for AGIs $50k-75k, 11.2% for AGIs $75k-100k, 19.7% for AGIs over 100k)
Earned income credit: $1,455 (reported on 12.2% of returns)
Here:
$1,455
State:
$1,763
Percentage of individuals using paid preparers for their 2004 taxes: 70.0%
Here:
70%
State:
66%
(% for various income ranges: 71.7% for AGIs below $10k, 63.6% for AGIs $10k-25k, 67.3% for AGIs $25k-50k, 63.0% for AGIs $50k-75k, 75.5% for AGIs $75k-100k, 87.1% for AGIs over 100k)
Household received Food Stamps/SNAP in the past 12 months: 35 Household did not receive Food Stamps/SNAP in the past 12 months: 424
Women who had a birth in the past 12 months: 17 (17 now married, 0 unmarried) Women who did not have a birth in the past 12 months: 225 (120 now married, 104 unmarried)
Housing units in zip code 95612 with a mortgage: 133 (38 second mortgage, 40 both second mortgage and home equity loan) Median monthly owner costs for units with a mortgage: $3,789 Median monthly owner costs for units without a mortgage: $913
Median number of rooms in houses and condos:
Here:
6.3
State:
6.0
Median number of rooms in apartments:
Here:
5.3
State:
3.9
Notable locations in this zip code not listed on our city pages
Notable locations in zip code 95612: Nathans Landing Number One Hundred Fifteen and a Fourth (A), Tye-A-Lee Landing (B), Hemp Landing Number Ninety-Seven (C), McFadden Landing Number One Hundred One (D), Plymans Landing Number One Hundred Fifteen (E), S Smith Landing One Hundred Seventeen (F), Goaters Landing Number One Hundred Fifteen and a Half (G), Clarksburg Marina (H), Clarksburg Fire Protection District (I). Display/hide their locations on the map
Size of family households: 203 2-persons, 82 3-persons, 57 4-persons, 11 5-persons, 5 6-persons, 23 7-or-more-persons
Size of nonfamily households: 72 1-person, 7 2-persons
171 married couples with children.
0 single-parent households ().
75.7% of residents of 95612 zip code speak English at home.
22.6% of residents speak Spanish at home (52% very well, 9% well, 6% not well, 32% not at all).
1.4% of residents speak Asian or Pacific Island language at home (100% not well).
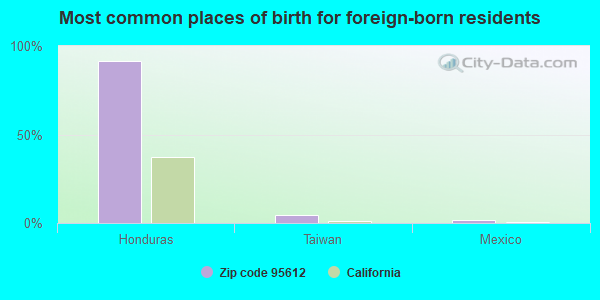
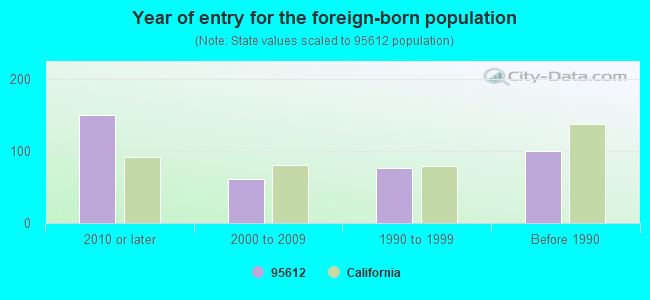
Foreign born population: 365 (25.2%) (75.4% of them are naturalized citizens)
This zip code:
25.2%
Whole state:
26.7%
92%Honduras
5%Taiwan
2%Mexico
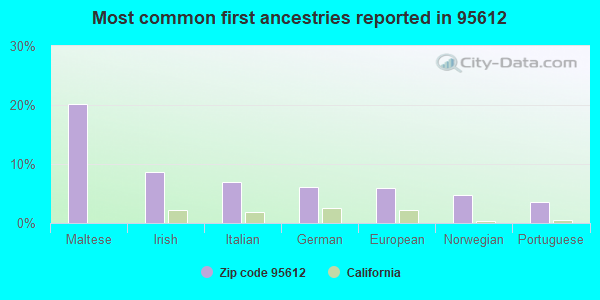
20%Maltese
9%Irish
7%Italian
6%German
6%European
5%Norwegian
4%Portuguese
Year of entry for the foreign-born population
1502010 or later
612000 to 2009
771990 to 1999
100Before 1990
Facilities with environmental interests located in this zip code:
Small Quantity Generators, between 100 kg and 1000 kg of hazardous waste/month (Resource Conservation and Recovery Act (tracking hazardous waste))
FEDERAL AVIATION ADMINISTRATIO (0.45 MI WEST OF SOUTH RIVER RD in CLARKSBURG, CA)
CRITERIA AND HAZARDOUS AIR POLLUTANT INVENTORY (Inventory of air pollution sources) Business SIC classification: REGULATION AND ADMINISTRATION OF TRANSPORTATION PROGRAMS
Housing units lacking complete plumbing facilities: 4.4% Housing units lacking complete kitchen facilities: 4.1%
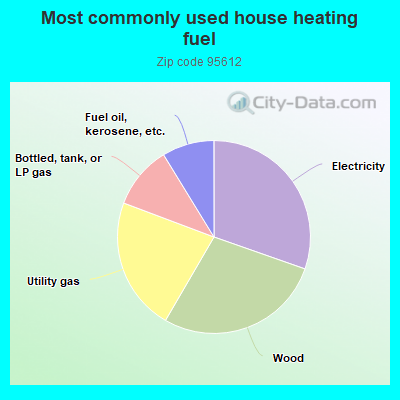
30.6%Electricity
28.2%Wood
22.5%Utility gas
10.6%Bottled, tank, or LP gas
8.8%Fuel oil, kerosene, etc.
Population in 1990: 1,501.
Place of birth for U.S.-born residents:
This state: 877
Northeast: 76
Midwest: 76
South: 9
West: 30
78% of the 95612 zip code residents lived in the same house 5 years ago. Out of people who lived in different houses, 46% lived in this county. Out of people who lived in different counties, 50% lived in California.
91% of the 95612 zip code residents lived in the same house 1 year ago. Out of people who lived in different houses, 38% moved from this county. Out of people who lived in different houses, 63% moved from different county within same state.
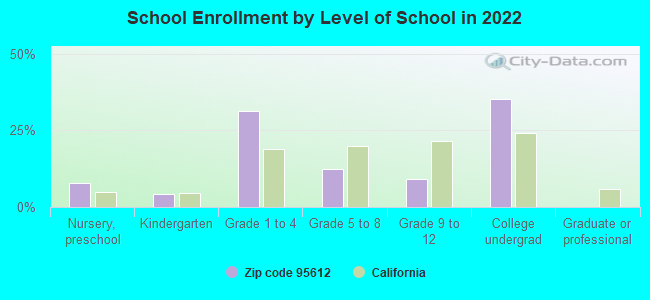
Private vs. public school enrollment:
Students in private schools in grades 1 to 8 (elementary and middle school):
Here:
0.0%
California:
10.5%
Students in private schools in grades 9 to 12 (high school):
Here:
0.0%
California:
8.5%
Students in private undergraduate colleges:
Here:
0.0%
California:
15.9%
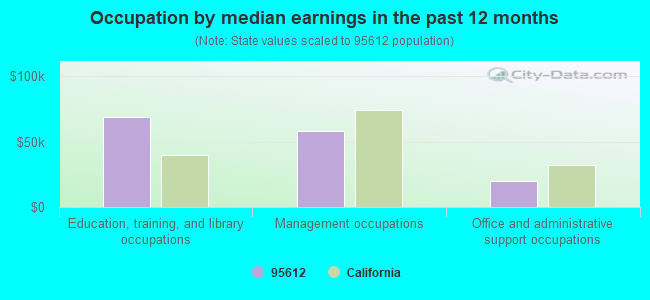
Occupation by median earnings in the past 12 months ($)
68,994Education, training, and library occupations
58,161Management occupations
19,701Office and administrative support occupations
Companies with federal contracts located in this zip code:
WESTERN STRATA EXPLORATION INC (52360 WILLOW POINT RD in CLARKSBURG, CA) : $1,262,022 in 30 contractsfrom 2000 to 2005
Contracts for Well Drilling/Exploratory Services, Construction of Structures and Facilities -- Recreation Facilities (Non-Building), Soil Studies, Other Management Support Services, and moreby U.S. Army Corps of Engineers - civil program financing only, Forest Service (disused code: now 12C2), Army, Federal Highway Administration, and others Signed by year:2000: $111,281; 2001: $658,157; 2002: $185,340; 2003: $288,340; 2004: -$39,560; 2005: $58,464; 2006: $0.
Biggest contracts:
$303,000 with U.S. Army Corps of Engineers - civil program financing only for Well Drilling/Exploratory Services. Signed on 2001-07-03. Completion date: 2001-11-29.
$218,477, same as above.Signed on 2001-08-30. Completion date: 2002-01-31.
$102,023, same as above.Signed on 2003-03-26. Completion date: 2002-09-03.
$89,000 with Forest Service (disused code: now 12C2) for Construction of Structures and Facilities -- Recreation Facilities (Non-Building). Signed on 2001-09-15. Completion date: 2002-04-15.
Top industries in this zip code by the number of employees in 2005:
Mining: Support Activities for Oil and Gas Operations (10-19 employees: 1 establishment)
Administrative and Support and Waste Management and Remediation Services: Document Preparation Services (5-9: 1)
Other Services (except Public Administration): Human Rights Organizations (1-4: 1)
Construction: Water and Sewer Line and Related Structures Construction (1-4: 1)
Professional, Scientific, and Technical Services: Marketing Consulting Services (1-4: 1)
Construction: Residential Remodelers (1-4: 1)
People in group quarters in 2000:
32 people in agriculture workers' dormitories on farms
12 people in unknown juvenile institutions
Fatal accident statistics in 2014:
Fatal accident count: 1
Vehicles involved in fatal accidents: 1
Fatal accidents caused by drunken drivers: 0
Fatalities: 2
Persons involved in fatal accidents: 3
Pedestrians involved in fatal accidents: 0
Fatal accident statistics in 2013:
Fatal accident count: 1
Vehicles involved in fatal accidents: 1
Fatal accidents caused by drunken drivers: 0
Fatalities: 1
Persons involved in fatal accidents: 2
Pedestrians involved in fatal accidents: 0
Home Mortgage Disclosure Act Aggregated Statistics For Year 2009 (Based on 4 partial tracts)
A) FHA, FSA/RHS & VA Home Purchase Loans
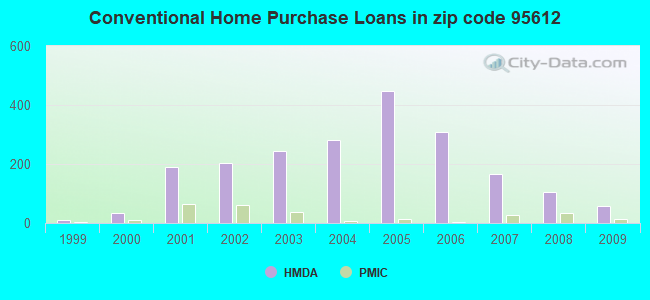
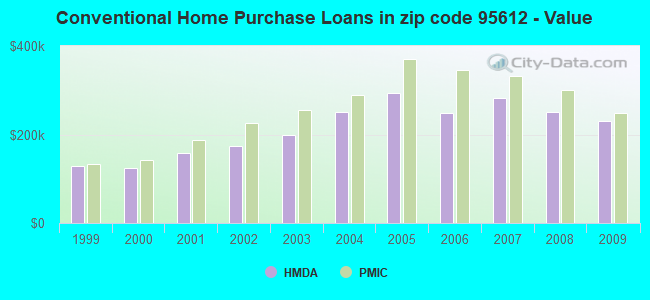
B) Conventional Home Purchase Loans
C) Refinancings
D) Home Improvement Loans
F) Non-occupant Loans on < 5 Family Dwellings (A B C & D)
Number
Average Value
Number
Average Value
Number
Average Value
Number
Average Value
Number
Average Value
LOANS ORIGINATED
70
$263,423
56
$230,377
126
$249,097
7
$128,910
15
$178,618
APPLICATIONS APPROVED, NOT ACCEPTED
4
$252,770
8
$284,328
12
$258,789
1
$17,300
3
$211,533
APPLICATIONS DENIED
9
$251,137
10
$263,513
64
$278,716
3
$27,277
6
$213,318
APPLICATIONS WITHDRAWN
7
$281,387
8
$243,504
49
$271,986
1
$119,180
4
$165,858
FILES CLOSED FOR INCOMPLETENESS
1
$182,060
2
$192,355
7
$372,851
1
$68,650
1
$206,500
Aggregated Statistics For Year 2008 (Based on 4 partial tracts)
A) FHA, FSA/RHS & VA Home Purchase Loans
B) Conventional Home Purchase Loans
C) Refinancings
D) Home Improvement Loans
F) Non-occupant Loans on < 5 Family Dwellings (A B C & D)
G) Loans On Manufactured Home Dwelling (A B C & D)
Number
Average Value
Number
Average Value
Number
Average Value
Number
Average Value
Number
Average Value
Number
Average Value
LOANS ORIGINATED
53
$286,724
106
$250,214
62
$228,738
9
$73,252
23
$210,839
0
$0
APPLICATIONS APPROVED, NOT ACCEPTED
2
$278,995
17
$257,106
19
$263,948
2
$56,020
4
$237,460
0
$0
APPLICATIONS DENIED
5
$308,376
27
$291,754
74
$313,086
12
$120,481
12
$290,918
0
$0
APPLICATIONS WITHDRAWN
7
$281,347
15
$286,236
32
$309,072
3
$288,380
5
$307,178
1
$532,880
FILES CLOSED FOR INCOMPLETENESS
2
$231,760
6
$297,098
8
$318,048
1
$102,700
2
$284,875
0
$0
Aggregated Statistics For Year 2007 (Based on 4 partial tracts)
A) FHA, FSA/RHS & VA Home Purchase Loans
B) Conventional Home Purchase Loans
C) Refinancings
D) Home Improvement Loans
F) Non-occupant Loans on < 5 Family Dwellings (A B C & D)
G) Loans On Manufactured Home Dwelling (A B C & D)
Number
Average Value
Number
Average Value
Number
Average Value
Number
Average Value
Number
Average Value
Number
Average Value
LOANS ORIGINATED
5
$309,034
167
$282,048
150
$255,824
24
$98,906
29
$247,524
1
$67,640
APPLICATIONS APPROVED, NOT ACCEPTED
1
$169,150
42
$246,859
38
$306,290
6
$121,740
8
$279,578
0
$0
APPLICATIONS DENIED
0
$0
56
$299,518
148
$323,058
32
$178,463
18
$269,227
1
$296,570
APPLICATIONS WITHDRAWN
1
$238,080
42
$248,028
44
$323,173
4
$212,540
4
$303,158
1
$104,900
FILES CLOSED FOR INCOMPLETENESS
0
$0
5
$287,670
24
$354,697
1
$104,070
1
$274,870
0
$0
Aggregated Statistics For Year 2006 (Based on 4 partial tracts)
A) FHA, FSA/RHS & VA Home Purchase Loans
B) Conventional Home Purchase Loans
C) Refinancings
D) Home Improvement Loans
F) Non-occupant Loans on < 5 Family Dwellings (A B C & D)
G) Loans On Manufactured Home Dwelling (A B C & D)
Number
Average Value
Number
Average Value
Number
Average Value
Number
Average Value
Number
Average Value
Number
Average Value
LOANS ORIGINATED
2
$328,695
308
$249,117
277
$280,572
50
$131,976
43
$256,863
3
$187,190
APPLICATIONS APPROVED, NOT ACCEPTED
1
$128,790
61
$280,472
62
$320,527
13
$102,375
10
$290,115
0
$0
APPLICATIONS DENIED
0
$0
70
$275,277
167
$341,820
30
$146,958
11
$306,925
1
$218,430
APPLICATIONS WITHDRAWN
0
$0
56
$258,906
99
$311,735
9
$148,742
8
$242,815
1
$355,320
FILES CLOSED FOR INCOMPLETENESS
0
$0
14
$267,872
23
$342,257
3
$237,740
1
$223,250
0
$0
Aggregated Statistics For Year 2005 (Based on 4 partial tracts)
A) FHA, FSA/RHS & VA Home Purchase Loans
B) Conventional Home Purchase Loans
C) Refinancings
D) Home Improvement Loans
F) Non-occupant Loans on < 5 Family Dwellings (A B C & D)
G) Loans On Manufactured Home Dwelling (A B C & D)
Number
Average Value
Number
Average Value
Number
Average Value
Number
Average Value
Number
Average Value
Number
Average Value
LOANS ORIGINATED
4
$187,758
448
$294,446
356
$281,898
53
$122,527
68
$300,572
4
$176,028
APPLICATIONS APPROVED, NOT ACCEPTED
0
$0
89
$313,581
49
$291,621
12
$118,604
13
$331,831
1
$88,970
APPLICATIONS DENIED
1
$108,470
88
$307,550
133
$298,316
26
$105,499
17
$297,302
4
$219,638
APPLICATIONS WITHDRAWN
1
$312,220
96
$303,056
105
$291,401
12
$167,556
11
$254,065
2
$286,935
FILES CLOSED FOR INCOMPLETENESS
0
$0
62
$294,765
26
$287,717
3
$165,767
1
$323,750
0
$0
Aggregated Statistics For Year 2004 (Based on 4 partial tracts)
A) FHA, FSA/RHS & VA Home Purchase Loans
B) Conventional Home Purchase Loans
C) Refinancings
D) Home Improvement Loans
F) Non-occupant Loans on < 5 Family Dwellings (A B C & D)
G) Loans On Manufactured Home Dwelling (A B C & D)
Number
Average Value
Number
Average Value
Number
Average Value
Number
Average Value
Number
Average Value
Number
Average Value
LOANS ORIGINATED
2
$247,965
280
$250,609
299
$239,092
50
$127,910
44
$243,348
0
$0
APPLICATIONS APPROVED, NOT ACCEPTED
0
$0
44
$241,055
60
$269,465
9
$131,168
8
$266,448
1
$143,650
APPLICATIONS DENIED
0
$0
63
$257,347
112
$237,724
26
$94,589
18
$253,898
3
$216,260
APPLICATIONS WITHDRAWN
0
$0
65
$273,733
91
$223,854
8
$155,430
10
$231,548
1
$123,570
FILES CLOSED FOR INCOMPLETENESS
0
$0
26
$235,565
20
$247,884
3
$148,193
2
$309,610
0
$0
Aggregated Statistics For Year 2003 (Based on 4 partial tracts)
A) FHA, FSA/RHS & VA Home Purchase Loans
B) Conventional Home Purchase Loans
C) Refinancings
D) Home Improvement Loans
F) Non-occupant Loans on < 5 Family Dwellings (A B C & D)
Number
Average Value
Number
Average Value
Number
Average Value
Number
Average Value
Number
Average Value
LOANS ORIGINATED
11
$205,076
244
$198,832
512
$189,077
39
$43,466
42
$173,834
APPLICATIONS APPROVED, NOT ACCEPTED
1
$154,870
31
$205,103
74
$188,769
6
$55,287
4
$190,502
APPLICATIONS DENIED
2
$177,390
39
$213,768
127
$191,232
27
$59,427
8
$189,851
APPLICATIONS WITHDRAWN
1
$315,520
40
$184,068
118
$206,998
3
$77,210
5
$169,738
FILES CLOSED FOR INCOMPLETENESS
0
$0
11
$202,480
20
$221,324
2
$47,095
2
$142,245
Aggregated Statistics For Year 2002 (Based on 4 partial tracts)
A) FHA, FSA/RHS & VA Home Purchase Loans
B) Conventional Home Purchase Loans
C) Refinancings
D) Home Improvement Loans
F) Non-occupant Loans on < 5 Family Dwellings (A B C & D)
Number
Average Value
Number
Average Value
Number
Average Value
Number
Average Value
Number
Average Value
LOANS ORIGINATED
19
$192,003
203
$173,549
263
$168,373
28
$46,883
23
$145,769
APPLICATIONS APPROVED, NOT ACCEPTED
1
$202,650
23
$158,850
33
$158,820
7
$40,013
2
$128,785
APPLICATIONS DENIED
1
$149,660
22
$187,172
83
$145,037
17
$33,646
2
$129,870
APPLICATIONS WITHDRAWN
4
$188,855
28
$201,278
54
$190,686
6
$50,983
1
$207,600
FILES CLOSED FOR INCOMPLETENESS
1
$77,440
8
$164,280
23
$148,032
1
$45,580
1
$96,110
Aggregated Statistics For Year 2001 (Based on 4 partial tracts)
A) FHA, FSA/RHS & VA Home Purchase Loans
B) Conventional Home Purchase Loans
C) Refinancings
D) Home Improvement Loans
F) Non-occupant Loans on < 5 Family Dwellings (A B C & D)
Number
Average Value
Number
Average Value
Number
Average Value
Number
Average Value
Number
Average Value
LOANS ORIGINATED
45
$170,417
189
$158,984
131
$143,797
5
$28,010
16
$125,017
APPLICATIONS APPROVED, NOT ACCEPTED
5
$178,820
22
$146,112
16
$123,387
3
$41,740
3
$108,863
APPLICATIONS DENIED
8
$167,369
23
$162,401
54
$125,160
8
$28,900
2
$66,040
APPLICATIONS WITHDRAWN
4
$159,405
19
$175,636
31
$132,571
2
$47,610
1
$117,800
FILES CLOSED FOR INCOMPLETENESS
0
$0
3
$134,280
10
$137,025
0
$0
0
$0
Aggregated Statistics For Year 2000 (Based on 4 partial tracts)
A) FHA, FSA/RHS & VA Home Purchase Loans
B) Conventional Home Purchase Loans
C) Refinancings
D) Home Improvement Loans
F) Non-occupant Loans on < 5 Family Dwellings (A B C & D)
Number
Average Value
Number
Average Value
Number
Average Value
Number
Average Value
Number
Average Value
LOANS ORIGINATED
19
$128,195
35
$125,194
17
$91,060
7
$24,280
4
$88,490
APPLICATIONS APPROVED, NOT ACCEPTED
1
$159,270
5
$198,210
5
$102,096
3
$37,277
0
$0
APPLICATIONS DENIED
4
$137,712
10
$81,330
17
$89,755
12
$32,635
0
$0
APPLICATIONS WITHDRAWN
3
$145,720
8
$158,982
5
$173,816
1
$13,180
0
$0
FILES CLOSED FOR INCOMPLETENESS
0
$0
1
$47,230
5
$151,846
0
$0
0
$0
Aggregated Statistics For Year 1999 (Based on 2 partial tracts)
A) FHA, FSA/RHS & VA Home Purchase Loans
B) Conventional Home Purchase Loans
C) Refinancings
D) Home Improvement Loans
F) Non-occupant Loans on < 5 Family Dwellings (A B C & D)


+$3,194
-$7,562
 Nearest zip codes: 95615, 95639, 95832, 95831, 95758, 95680.