Estimated zip code population in 2022: 4,912 Zip code population in 2010: 4,314 Zip code population in 2000: 914
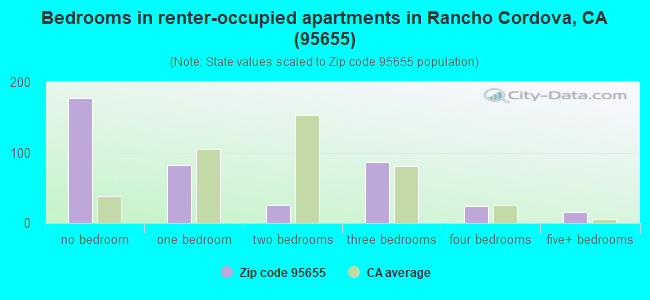
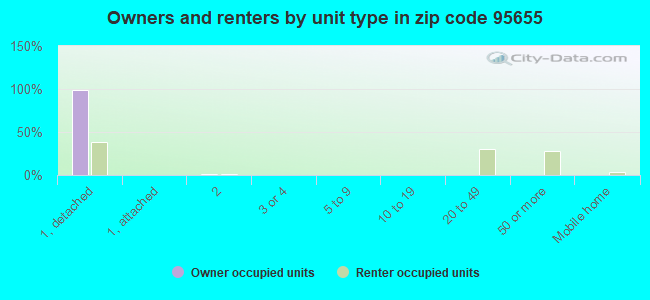
Houses and condos: 1,671 Renter-occupied apartments: 399
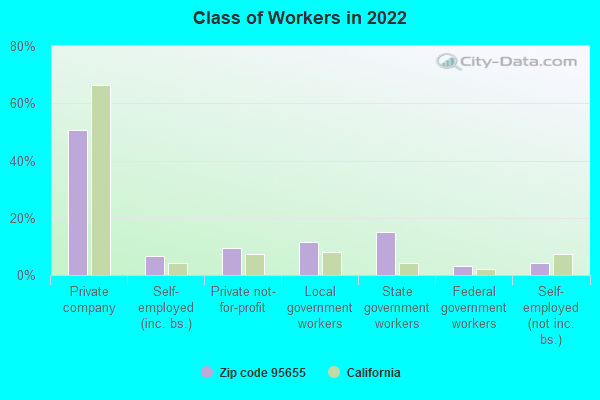
% of renters here:
24%
State:
44%
March 2022 cost of living index in zip code 95655: 97.3 (near average, U.S. average is 100)
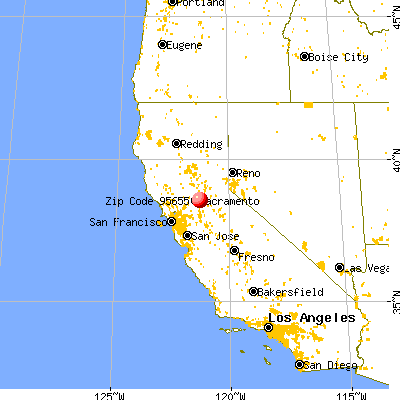
Land area: 9.5 sq. mi. Water area: 0.0 sq. mi.
Population density: 519 people per square mile
(low).
OSM Map
General Map
Google Map
MSN Map
OSM Map
General Map
Google Map
MSN Map
OSM Map
General Map
Google Map
MSN Map
OSM Map
General Map
Google Map
MSN Map
Please wait while loading the map...
Real estate property taxes paid for housing units in 2022:
This zip code:
0.7% ($4,270)
California:
0.7% ($4,831)
Median real estate property taxes paid for housing units with mortgages in 2022: $4,096 (0.7%) Median real estate property taxes paid for housing units with no mortgage in 2022: $5,083 (0.8%)
Business Search- 14 Million verified businesses
Males: 2,264
(46.1%)
Females: 2,648
(53.9%)
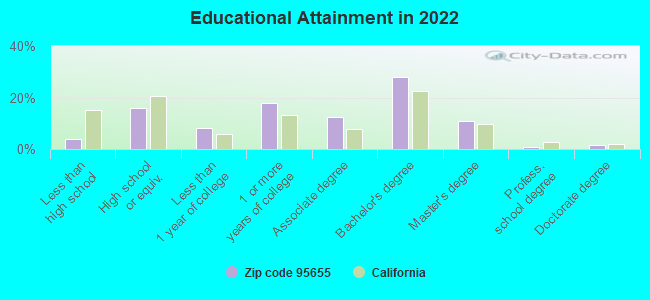
For population 25 years and over in 95655:
High school or higher: 96.0%
Bachelor's degree or higher: 41.4%
Graduate or professional degree: 13.5%
Unemployed: 3.9%
Mean travel time to work (commute): 24.0 minutes
For population 15 years and over in 95655:
Never married: 26.5%
Now married: 60.0%
Separated: 3.5%
Widowed: 4.7%
Divorced: 5.3%
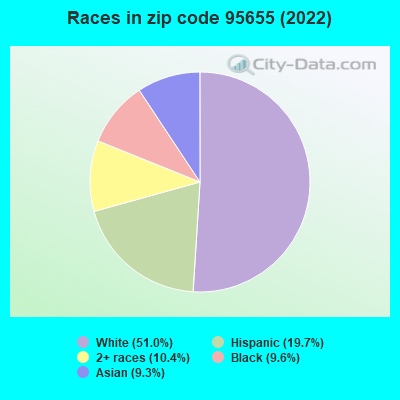
Zip code 95655 compared to state average:
Black race population percentage above state average.
Hispanic race population percentage below state average.
Foreign-born population percentage below state average.
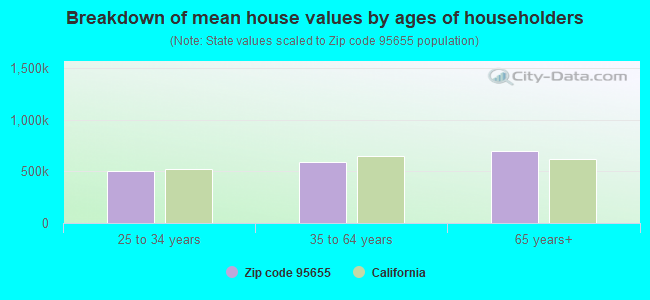
Estimated median house/condo value in 2022: $574,197
95655:
$574,197
California:
$715,900
According to our research of California and other state lists, there were 4 registered sex offenders living in 95655 zip code as of May 28, 2024. The ratio of all residents to sex offenders in zip code 95655 is 1,066 to 1. The ratio of registered sex offenders to all residents in this zip code is lower than the state average.
Median resident age:
This zip code:
34.1 years
California median age:
37.9 years
Average household size:
This zip code:
2.9 people
California:
2.8 people
Averages for the 2020 tax year for zip code 95655, filed in 2021:
Average Adjusted Gross Income (AGI) in 2020: $80,737 (Individual Income Tax Returns)
Here:
$80,737
State:
$95,910
Salary/wage: $75,631 (reported on 86.7% of returns)
Here:
$75,631
State:
$77,331
(% of AGI for various income ranges: 1096.8% for AGIs below $25k, 3703.0% for AGIs $25k-50k, 7216.0% for AGIs $50k-75k, 10633.3% for AGIs $75k-100k, 22467.0% for AGIs $100k-200k, 60497.5% for AGIs over 200k)
Taxable interest for individuals: $317 (reported on 49.2% of returns)
This zip code:
$317
California:
$2,294
(% of AGI for various income ranges: 5.7% for AGIs below $25k, 12.6% for AGIs $25k-50k, 16.0% for AGIs $50k-75k, 33.3% for AGIs $75k-100k, 44.4% for AGIs $100k-200k, 130.0% for AGIs over 200k)
Ordinary dividends: $2,457 (reported on 15.4% of returns)
Here:
$2,457
State:
$10,949
(% of AGI for various income ranges: 3.2% for AGIs below $25k, 51.7% for AGIs $25k-50k, 12.5% for AGIs $50k-75k, 44.0% for AGIs $75k-100k, 61.1% for AGIs $100k-200k, 875.0% for AGIs over 200k)
Net capital gain/loss in AGI: +$9,767 (reported on 15.4% of returns)
Here:
+$9,767
State:
+$49,306
(% of AGI for various income ranges: 5.4% for AGIs below $25k, 100.0% for AGIs $50k-75k, 94.0% for AGIs $75k-100k, 273.7% for AGIs $100k-200k, 4615.0% for AGIs over 200k)
Profit/loss from business: +$7,953 (reported on 16.4% of returns)
Here:
+$7,953
State:
+$15,671
(% of AGI for various income ranges: 69.5% for AGIs below $25k, 158.7% for AGIs $25k-50k, 190.0% for AGIs $50k-75k, 290.0% for AGIs $75k-100k, 410.4% for AGIs $100k-200k)
Taxable individual retirement arrangement distribution: $16,312 (reported on 4.1% of returns)
95655:
$16,312
California:
$23,505
(% of AGI for various income ranges: 141.7% for AGIs $25k-50k, 199.5% for AGIs $50k-75k, 214.8% for AGIs $100k-200k)
Total itemized deductions: $27,232 (reported on 19.0% of returns)
Here:
$27,232
State:
$39,517
(% of AGI for various income ranges: 287.4% for AGIs $25k-50k, 804.5% for AGIs $50k-75k, 1185.3% for AGIs $75k-100k, 1790.0% for AGIs $100k-200k, 2987.5% for AGIs over 200k)
Charity contributions: $5,177 (reported on 15.4% of returns)
Here:
$5,177
State:
$12,598
(% of AGI for various income ranges: 111.0% for AGIs $50k-75k, 116.0% for AGIs $75k-100k, 318.9% for AGIs $100k-200k, 740.0% for AGIs over 200k)
Taxes paid: $8,453 (reported on 19.5% of returns)
95655:
$8,453
State:
$8,807
(% of AGI for various income ranges: 72.6% for AGIs $25k-50k, 258.0% for AGIs $50k-75k, 437.3% for AGIs $75k-100k, 564.8% for AGIs $100k-200k, 870.0% for AGIs over 200k)
Earned income credit: $2,062 (reported on 10.8% of returns)
Here:
$2,062
State:
$2,074
(% of AGI for various income ranges: 76.2% for AGIs below $25k, 65.7% for AGIs $25k-50k)
Percentage of individuals using paid preparers for their 2020 taxes: 93.3%
Here:
93%
State:
92%
(% for various income ranges: 92.2% for AGIs below $25k, 93.8% for AGIs $25k-50k, 89.7% for AGIs $50k-75k, 91.3% for AGIs $75k-100k, 96.0% for AGIs $100k-200k, 100.0% for AGIs over 200k)
Averages for the 2012 tax year for zip code 95655, filed in 2013:
Average Adjusted Gross Income (AGI) in 2012: $62,752 (Individual Income Tax Returns)
Here:
$62,752
State:
$72,726
Salary/wage: $60,287 (reported on 88.8% of returns)
Here:
$60,287
State:
$59,079
(% of AGI for various income ranges: 73.7% for AGIs below $25k, 82.9% for AGIs $25k-50k, 86.4% for AGIs $50k-75k, 88.3% for AGIs $75k-100k, 87.6% for AGIs $100k-200k, 70.1% for AGIs over 200k)
Taxable interest for individuals: $189 (reported on 47.1% of returns)
This zip code:
$189
California:
$2,146
(% of AGI for various income ranges: 0.3% for AGIs below $25k, 0.3% for AGIs $25k-50k, 0.1% for AGIs $75k-100k, 0.1% for AGIs $100k-200k, 0.2% for AGIs over 200k)
Ordinary dividends: $1,836 (reported on 14.7% of returns)
Here:
$1,836
State:
$9,308
(% of AGI for various income ranges: 0.2% for AGIs below $25k, 0.1% for AGIs $25k-50k, 0.2% for AGIs $50k-75k, 0.5% for AGIs $75k-100k, 0.7% for AGIs $100k-200k)
Net capital gain/loss in AGI: +$47 (reported on 11.2% of returns)
Here:
+$47
State:
+$30,460
(% of AGI for various income ranges: 0.1% for AGIs $100k-200k)
Profit/loss from business: +$11,500 (reported on 17.6% of returns)
Here:
+$11,500
State:
+$17,064
(% of AGI for various income ranges: 10.9% for AGIs below $25k, 6.3% for AGIs $25k-50k, 3.6% for AGIs $50k-75k, 2.6% for AGIs $75k-100k, 2.0% for AGIs $100k-200k)
Taxable individual retirement arrangement distribution: $17,829 (reported on 4.1% of returns)
95655:
$17,829
California:
$19,557
(% of AGI for various income ranges: 4.0% for AGIs below $25k, 2.4% for AGIs $50k-75k, 1.4% for AGIs $100k-200k)
Total itemized deductions: $22,160 (25% of AGI, reported on 53.5% of returns)
Here:
$22,160
State:
$34,004
Here:
24.6% of AGI
State:
22.7% of AGI
(% of AGI for various income ranges: 10.4% for AGIs below $25k, 18.5% for AGIs $25k-50k, 19.9% for AGIs $50k-75k, 18.7% for AGIs $75k-100k, 20.1% for AGIs $100k-200k, 15.7% for AGIs over 200k)
Charity contributions: $2,261 (reported on 44.7% of returns)
Here:
$2,261
State:
$4,659
(% of AGI for various income ranges: 0.7% for AGIs below $25k, 1.3% for AGIs $25k-50k, 1.8% for AGIs $50k-75k, 1.8% for AGIs $75k-100k, 1.7% for AGIs $100k-200k, 1.0% for AGIs over 200k)
Taxes paid: $7,387 (reported on 53.5% of returns)
95655:
$7,387
State:
$14,448
(% of AGI for various income ranges: 2.2% for AGIs below $25k, 4.5% for AGIs $25k-50k, 5.7% for AGIs $50k-75k, 6.3% for AGIs $75k-100k, 7.4% for AGIs $100k-200k, 7.7% for AGIs over 200k)
Earned income credit: $2,028 (reported on 14.7% of returns)
Here:
$2,028
State:
$2,286
(% of AGI for various income ranges: 6.9% for AGIs below $25k, 1.2% for AGIs $25k-50k)
Percentage of individuals using paid preparers for their 2012 taxes: 49.4%
Here:
49%
State:
64%
(% for various income ranges: 48.9% for AGIs below $25k, 48.6% for AGIs $25k-50k, 48.4% for AGIs $50k-75k, 45.8% for AGIs $75k-100k, 57.6% for AGIs $100k-200k)
Averages for the 2004 tax year for zip code 95655, filed in 2005:
Average Adjusted Gross Income (AGI) in 2004: $80,543 (Individual Income Tax Returns)
Here:
$80,543
State:
$58,600
Salary/wage: $51,021 (reported on 92.8% of returns)
Here:
$51,021
State:
$49,455
(% of AGI for various income ranges: 126.1% for AGIs below $10k, 81.6% for AGIs $10k-25k, 91.6% for AGIs $25k-50k, 91.2% for AGIs $50k-75k, 93.0% for AGIs $75k-100k, 30.8% for AGIs over 100k)
Taxable interest for individuals: $779 (reported on 56.6% of returns)
This zip code:
$779
California:
$2,365
(% of AGI for various income ranges: 1.5% for AGIs below $10k, 0.4% for AGIs $10k-25k, 0.3% for AGIs $25k-50k, 0.3% for AGIs $50k-75k, 0.3% for AGIs $75k-100k, 0.7% for AGIs over 100k)
Taxable dividends: $996 (reported on 15.6% of returns)
Here:
$996
State:
$4,746
(% of AGI for various income ranges: 0.2% for AGIs $10k-25k, 0.2% for AGIs $25k-50k, 0.3% for AGIs $50k-75k, 0.1% for AGIs $75k-100k, 0.2% for AGIs over 100k)
Net capital gain/loss: +$51,255 (reported on 15.8% of returns)
Here:
+$51,255
State:
+$23,418
(% of AGI for various income ranges: 0.5% for AGIs $10k-25k, 0.5% for AGIs $25k-50k, 0.0% for AGIs $50k-75k, 1.0% for AGIs $75k-100k, 18.2% for AGIs over 100k)
Profit/loss from business: +$13,660 (reported on 18.6% of returns)
Here:
+$13,660
State:
+$16,826
(% of AGI for various income ranges: 16.1% for AGIs below $10k, 10.7% for AGIs $10k-25k, 3.9% for AGIs $25k-50k, 2.4% for AGIs $50k-75k, 2.3% for AGIs $75k-100k, 2.9% for AGIs over 100k)
IRA payment deduction: $2,419 (reported on 1.9% of returns)
95655:
$2,419
California:
$3,192
Total itemized deductions: $30,474 (26% of AGI, reported on 62.0% of returns)
Here:
$30,474
State:
$28,113
Here:
26.3% of AGI
State:
25.3% of AGI
(% of AGI for various income ranges: 33.5% for AGIs below $10k, 23.2% for AGIs $10k-25k, 27.7% for AGIs $25k-50k, 28.6% for AGIs $50k-75k, 27.3% for AGIs $75k-100k, 19.9% for AGIs over 100k)
Charity contributions deductions: $3,047 (4% of AGI, reported on 52.6% of returns)
Here:
$3,047
State:
$3,923
Here:
3.6% of AGI
State:
3.3% of AGI
(% of AGI for various income ranges: 1.5% for AGIs $10k-25k, 2.4% for AGIs $25k-50k, 2.0% for AGIs $50k-75k, 2.0% for AGIs $75k-100k, 2.0% for AGIs over 100k)
Total tax: $7,351 (reported on 78.6% of returns)
95655:
$7,351
State:
$10,761
(% of AGI for various income ranges: 5.6% for AGIs below $10k, 4.6% for AGIs $10k-25k, 5.5% for AGIs $25k-50k, 6.8% for AGIs $50k-75k, 8.0% for AGIs $75k-100k, 7.6% for AGIs over 100k)
Earned income credit: $1,533 (reported on 13.7% of returns)
Here:
$1,533
State:
$1,763
Percentage of individuals using paid preparers for their 2004 taxes: 53.6%
Here:
54%
State:
66%
(% for various income ranges: 47.2% for AGIs below $10k, 54.3% for AGIs $10k-25k, 54.3% for AGIs $25k-50k, 52.7% for AGIs $50k-75k, 56.4% for AGIs $75k-100k, 56.2% for AGIs over 100k)
Household received Food Stamps/SNAP in the past 12 months: 372 Household did not receive Food Stamps/SNAP in the past 12 months: 1,308
Women who had a birth in the past 12 months: 100 (29 now married, 72 unmarried) Women who did not have a birth in the past 12 months: 1,191 (732 now married, 448 unmarried)
Housing units in zip code 95655 with a mortgage: 1,065 (95 second mortgage, 88 both second mortgage and home equity loan) Median monthly owner costs for units with a mortgage: $2,657 Median monthly owner costs for units without a mortgage: $938
Residents with income below the poverty level in 2022:
This zip code:
10.9%
Whole state:
12.2%
Residents with income below 50% of the poverty level in 2022:
This zip code:
1.8%
Whole state:
6.2%
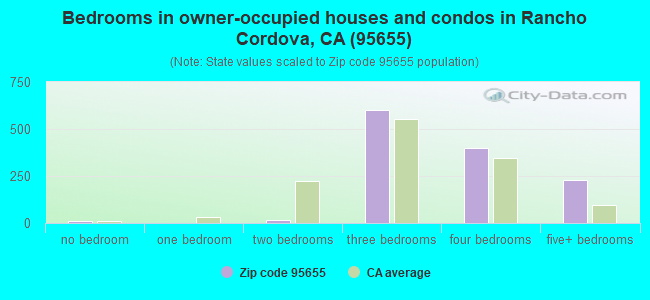
Median number of rooms in houses and condos:
Here:
6.6
State:
6.0
Median number of rooms in apartments:
Here:
2.8
State:
3.9
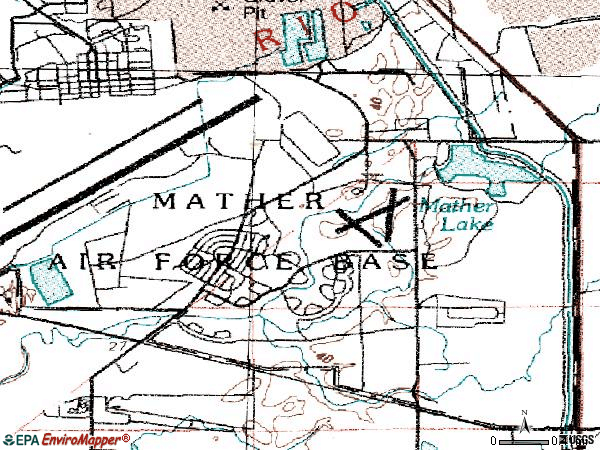
Notable locations in this zip code not listed on our city pages
Notable locations in zip code 95655: Mather Golf Course (A), California Governor Office of Emergency Services Fire and Rescue (B), Sacramento County Airport System Fire Department Station 97 (C), California State Office of Emergency Services (D). Display/hide their locations on the map
In group quarters: 105 (-1 institutionalized population)
Size of family households: 372 2-persons, 332 3-persons, 397 4-persons, 78 5-persons, 60 6-persons, 53 7-or-more-persons
Size of nonfamily households: 266 1-person, 71 2-persons
1,169 married couples with children.
286 single-parent households (123 men, 163 women).
74.6% of residents of 95655 zip code speak English at home.
10.6% of residents speak Spanish at home (59% very well, 27% well, 9% not well, 6% not at all).
7.7% of residents speak other Indo-European language at home (67% very well, 9% well, 9% not well, 15% not at all).
6.1% of residents speak Asian or Pacific Island language at home (64% very well, 28% well, 8% not well).
0.3% of residents speak other language at home (100% very well).
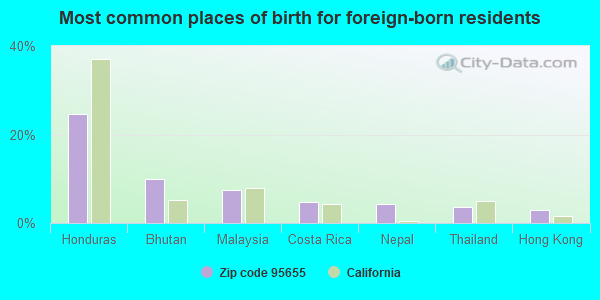
Foreign born population: 599 (12.2%) (65.9% of them are naturalized citizens)
This zip code:
12.2%
Whole state:
26.7%
25%Honduras
10%Bhutan
8%Malaysia
5%Costa Rica
4%Nepal
4%Thailand
3%Hong Kong
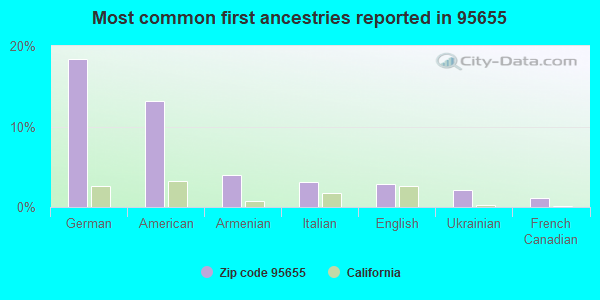
18%German
13%American
4%Armenian
3%Italian
3%English
2%Ukrainian
1%French Canadian
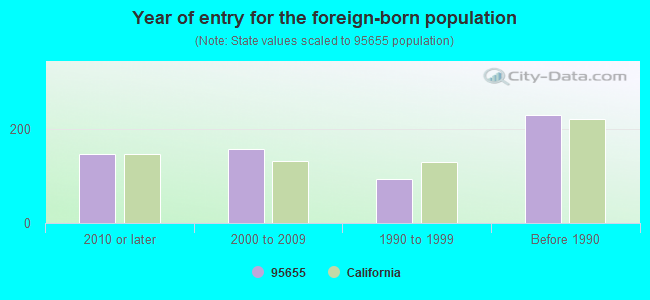
Year of entry for the foreign-born population
1482010 or later
1582000 to 2009
941990 to 1999
230Before 1990
Facilities with environmental interests located in this zip code:
MATHER AIR FORCE BASE (AC&W DISPOSAL SITE) (MATHER FIELD ROAD in MATHER AFB, CA) . Federal Facility. U.S. AIR FORCE
SUPERFUND NPL (Superfund database) COMPLIANCE ACTIVITY (Tracking inspections of insecticide, fungicide, and rodenticide, and toxic substances) Large Quantity Generators, more that 1000 kg of hazardous waste/month (Resource Conservation and Recovery Act (tracking hazardous waste)) TSD (Resource Conservation and Recovery Act (tracking hazardous waste)) Organizations: MATHER AIR FORCE BASE USAF (CONTACT/OPERATOR)
, RICHARD A BLANK (CONTACT/OPERATOR)
Alternative names: AC & W SITE, MATHER AFB, CIVIL ENGR DEPT, MATHER AFB GROUNDS, MATHER AFB, PCB STORAGE FACILITY, USAF MATHER, USAF MATHER AIR FORCE BASE
KITTY HAWK (4420 MONHEGAN WAY in MATHER, CA)
(National Center for Education Statistics) - STATE ID-6033195 Organizations: FOLSOM-CORDOVA UNIFIED (SCHOOL DISTRICT)
MATHER HEIGHTS ELEMENTARY (4379 MATHER SCHOOL RD. in MATHER, CA)
(National Center for Education Statistics) - STATE ID-6033203 Organizations: FOLSOM-CORDOVA UNIFIED (SCHOOL DISTRICT)
MATHER YOUTH ACADEMY (COMMUN. DAY) (4420 MONHEGAN WAY in MATHER, CA)
(National Center for Education Statistics) - STATE ID-3430667 Organizations: FOLSOM-CORDOVA UNIFIED (SCHOOL DISTRICT)
A C & W - GW TREATMENT (10503 ARMSTONG AVE in MATHER, CA) . Federal Facility. U.S. AIR FORCE
National Pollutant Discharge Elimination System NON-MAJOR (Tracking pollutant discharge elimination systems) - permit Business SIC classification: NATIONAL SECURITY Organizations: AFB CONVERSION AGENCY (CONTACT/OWNER)
Alternative names: AFB CONVERSION AGENCY
FOLSOM CORDOVA UNIFIED SCHOOL DISTRICT KITTY HAWK ELEMENTARY (4340 GATOR DRIVE in MATHER, CA) . Federal Facility. U.S. AIR FORCE
Small Quantity Generators, between 100 kg and 1000 kg of hazardous waste/month (Resource Conservation and Recovery Act (tracking hazardous waste)) Alternative names: FOLSOM CORDOVA USD KITTY HAWK ELEM
MATHER HEIGHTS ELEMENTARY SCHOOL (4370 SCHOOL ROAD in MATHER, CA) . Federal Facility. U.S. AIR FORCE
Small Quantity Generators, between 100 kg and 1000 kg of hazardous waste/month (Resource Conservation and Recovery Act (tracking hazardous waste))
MATHER AIR FORCE BASE (AC&W DISPOSAL SITE) (MATHER AIR FORCE BASE in MATHER, CA) . Federal Facility
BRAC (Military Base Realignment and Closure)
Housing units lacking complete kitchen facilities: 4.9%
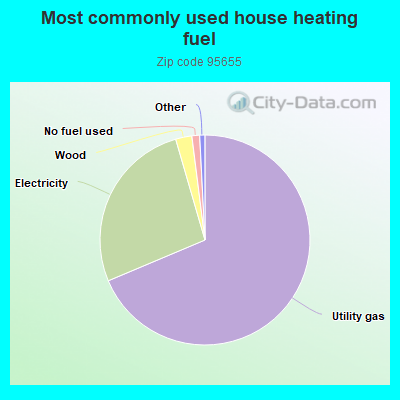
68.8%Utility gas
26.9%Electricity
2.5%Wood
1.2%No fuel used
Population in 1990: 4,880.
Place of birth for U.S.-born residents:
This state: 3,411
Northeast: 51
Midwest: 171
South: 304
West: 331
0% of the 95655 zip code residents lived in the same house 5 years ago. Out of people who lived in different houses, 71% lived in this county. Out of people who lived in different counties, 50% lived in California.
87% of the 95655 zip code residents lived in the same house 1 year ago. Out of people who lived in different houses, 83% moved from this county. Out of people who lived in different houses, 5% moved from different county within same state. Out of people who lived in different houses, 6% moved from different state.
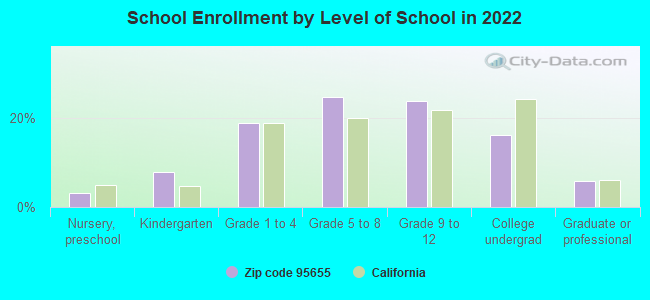
Private vs. public school enrollment:
Students in private schools in grades 1 to 8 (elementary and middle school): 55
Here:
8.9%
California:
10.5%
Students in private schools in grades 9 to 12 (high school): 31
Here:
9.2%
California:
8.5%
Students in private undergraduate colleges: 23
Here:
10.0%
California:
15.9%
Occupation by median earnings in the past 12 months ($)
148,413Health diagnosing and treating practitioners and other technical occupations
137,886Architecture and engineering occupations
115,670Installation, maintenance, and repair occupations
107,820Computer and mathematical occupations
91,521Management occupations
83,884Education, training, and library occupations
Companies with federal contracts located in this zip code:
MWH AMERICAS, INC (10503 ARMSTRONG in MATHER, CA) : $21,118,702 in 51 contractsfrom 2000 to 2004
Contracts for Purchase of Structures and Facilities -- Restoration of real property, Other Architect and Engineering Services, Architect - Engineer Services (including landscaping, interior layout, and designing), Hazardous Substance Removal, Cleanup, and Disposal Services and Operational Support, and moreby Air Force Signed by year:2000: $500,281; 2001: $5,836,013; 2002: $15,766,844; 2003: -$1,142,835; 2004: $158,399; 2005: $0; 2006: $0.
Biggest contracts:
$5,772,798 with Air Force for Purchase of Structures and Facilities -- Restoration of real property. Taking place in NM. Signed on 2002-08-21. Completion date: 2004-02-29.
$4,044,678 with Air Force for Other Architect and Engineering Services. Taking place in IL. Signed on 2002-07-15. Completion date: 2002-12-31.
$2,679,800, same as above.Signed on 2001-09-20. Completion date: 2002-12-31.
$1,602,251, same as above.Signed on 2002-08-26. Completion date: 2002-12-31.
PLACER FIRE EQUIPMENT INC (10203 MISSILE WAY in MATHER, CA; small business) : $175,081 in 2 contractsfrom 2005 to 2006
$172,383 with Air Force for Safety and Rescue Equipment. Signed on 2005-09-20. Completion date: 2006-07-06.
$2,698, same as above.Signed on 2006-03-01. Completion date: 2006-07-06.
PRECISION FLIGHT CONTROLS INC (10555 NORDEN AVE STE A in MATHER, CA; small business) : $101,860 in 8 contractsfrom 2003 to 2006
Contracts for Training Aids, Maintenance, Repair and Rebuilding of Equipment -- Training Aids and Devices, , Electronic Modules by Animal and Plant Health Inspection Service, Air Force, Transportation Security Administration, NASA, and others Signed by year:2000: $0; 2001: $0; 2002: $0; 2003: $36,200; 2004: $10,000; 2005: $37,625; 2006: $18,035.
Biggest contracts:
$36,200 with Animal and Plant Health Inspection Service for Training Aids. Signed on 2003-08-15. Completion date: 2003-10-15.
$19,950 with Air Force for Maintenance, Repair and Rebuilding of Equipment -- Training Aids and Devices. Taking place in TX. Signed on 2005-07-18. Completion date: 2005-09-12.
$18,035 with Transportation Security Administration for Training Aids. Taking place in NJ. Signed on 2006-09-25. Completion date: 2006-11-06.
$10,000 with Animal and Plant Health Inspection Service for Training Aids. Signed on 2004-08-24. Completion date: 2004-09-30.
Top industries in this zip code by the number of employees in 2005:
Health Care and Social Assistance: General Medical and Surgical Hospitals (500-999 employees: 1 establishment)
Administrative and Support and Waste Management and Remediation Services: Temporary Help Services (100-249: 1)
Wholesale Trade: Petroleum and Petroleum Products Merchant Wholesalers (except Bulk Stations and Terminals) (100-249: 1)
Health Care and Social Assistance: All Other Miscellaneous Ambulatory Health Care Services (50-99: 1)
Management of Companies and Enterprises: Corporate, Subsidiary, and Regional Managing Offices (20-49: 1, 5-9: 1)
People in group quarters in 2010:
4 people in group homes intended for adults
Fatal accident statistics in 2010:
Fatal accident count: 1
Vehicles involved in fatal accidents: 2
Fatal accidents caused by drunken drivers: 0
Fatalities: 1
Persons involved in fatal accidents: 3
Pedestrians involved in fatal accidents: 0
Home Mortgage Disclosure Act Aggregated Statistics For Year 2009 (Based on 2 partial tracts)
A) FHA, FSA/RHS & VA Home Purchase Loans
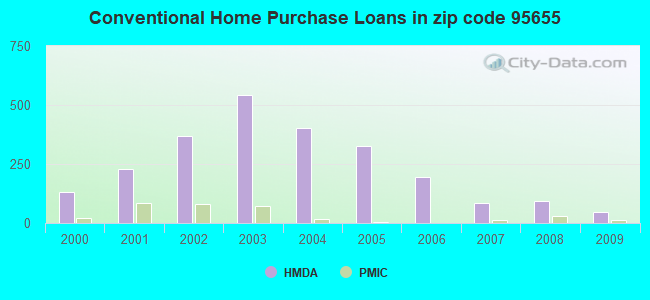
B) Conventional Home Purchase Loans
C) Refinancings
D) Home Improvement Loans
F) Non-occupant Loans on < 5 Family Dwellings (A B C & D)
Number
Average Value
Number
Average Value
Number
Average Value
Number
Average Value
Number
Average Value
LOANS ORIGINATED
88
$216,546
45
$203,116
120
$237,725
6
$138,367
13
$160,086
APPLICATIONS APPROVED, NOT ACCEPTED
3
$226,953
8
$193,098
8
$195,506
0
$0
2
$128,465
APPLICATIONS DENIED
18
$240,781
11
$223,206
79
$231,438
3
$25,157
2
$167,005
APPLICATIONS WITHDRAWN
8
$202,331
3
$272,987
34
$226,749
6
$46,300
0
$0
FILES CLOSED FOR INCOMPLETENESS
0
$0
3
$257,463
5
$191,090
2
$69,850
0
$0
Aggregated Statistics For Year 2008 (Based on 2 partial tracts)
A) FHA, FSA/RHS & VA Home Purchase Loans
B) Conventional Home Purchase Loans
C) Refinancings
D) Home Improvement Loans
F) Non-occupant Loans on < 5 Family Dwellings (A B C & D)
Number
Average Value
Number
Average Value
Number
Average Value
Number
Average Value
Number
Average Value
LOANS ORIGINATED
82
$269,892
92
$197,897
71
$238,812
8
$36,934
5
$280,694
APPLICATIONS APPROVED, NOT ACCEPTED
5
$212,286
11
$224,666
19
$277,888
0
$0
0
$0
APPLICATIONS DENIED
19
$302,905
39
$217,030
64
$234,949
10
$82,378
8
$224,009
APPLICATIONS WITHDRAWN
5
$236,052
13
$263,598
35
$254,863
2
$188,680
3
$297,073
FILES CLOSED FOR INCOMPLETENESS
2
$263,350
5
$232,520
8
$338,221
2
$231,235
2
$231,235
Aggregated Statistics For Year 2007 (Based on 2 partial tracts)
A) FHA, FSA/RHS & VA Home Purchase Loans
B) Conventional Home Purchase Loans
C) Refinancings
D) Home Improvement Loans
F) Non-occupant Loans on < 5 Family Dwellings (A B C & D)
Number
Average Value
Number
Average Value
Number
Average Value
Number
Average Value
Number
Average Value
LOANS ORIGINATED
2
$230,430
85
$249,258
170
$249,003
32
$145,375
16
$252,712
APPLICATIONS APPROVED, NOT ACCEPTED
0
$0
18
$185,202
72
$271,737
13
$72,878
10
$145,967
APPLICATIONS DENIED
0
$0
40
$252,994
201
$310,630
35
$173,610
19
$235,038
APPLICATIONS WITHDRAWN
2
$238,460
22
$310,285
79
$291,585
6
$84,037
5
$269,454
FILES CLOSED FOR INCOMPLETENESS
0
$0
0
$0
32
$340,229
2
$200,725
2
$250,505
Aggregated Statistics For Year 2006 (Based on 2 partial tracts)
B) Conventional Home Purchase Loans
C) Refinancings
D) Home Improvement Loans
F) Non-occupant Loans on < 5 Family Dwellings (A B C & D)
G) Loans On Manufactured Home Dwelling (A B C & D)
Number
Average Value
Number
Average Value
Number
Average Value
Number
Average Value
Number
Average Value
LOANS ORIGINATED
193
$267,220
334
$282,429
66
$153,062
53
$276,288
2
$104,375
APPLICATIONS APPROVED, NOT ACCEPTED
42
$257,196
95
$298,037
14
$1,592,380
13
$1,812,207
0
$0
APPLICATIONS DENIED
88
$271,617
207
$324,790
67
$153,294
26
$290,835
0
$0
APPLICATIONS WITHDRAWN
51
$290,870
124
$321,691
21
$176,638
14
$366,581
0
$0
FILES CLOSED FOR INCOMPLETENESS
3
$382,717
53
$281,954
3
$36,397
2
$213,570
0
$0
Aggregated Statistics For Year 2005 (Based on 2 partial tracts)
B) Conventional Home Purchase Loans
C) Refinancings
D) Home Improvement Loans
F) Non-occupant Loans on < 5 Family Dwellings (A B C & D)
G) Loans On Manufactured Home Dwelling (A B C & D)
Number
Average Value
Number
Average Value
Number
Average Value
Number
Average Value
Number
Average Value
LOANS ORIGINATED
326
$260,130
552
$297,399
82
$155,900
40
$279,851
0
$0
APPLICATIONS APPROVED, NOT ACCEPTED
42
$256,584
67
$279,241
11
$176,784
10
$257,410
0
$0
APPLICATIONS DENIED
77
$263,205
214
$288,009
50
$152,936
24
$298,812
2
$203,135
APPLICATIONS WITHDRAWN
50
$259,369
175
$304,340
34
$230,905
6
$211,163
0
$0
FILES CLOSED FOR INCOMPLETENESS
10
$295,307
56
$331,655
2
$32,115
0
$0
0
$0
Aggregated Statistics For Year 2004 (Based on 2 partial tracts)
A) FHA, FSA/RHS & VA Home Purchase Loans
B) Conventional Home Purchase Loans
C) Refinancings
D) Home Improvement Loans
F) Non-occupant Loans on < 5 Family Dwellings (A B C & D)
G) Loans On Manufactured Home Dwelling (A B C & D)
Number
Average Value
Number
Average Value
Number
Average Value
Number
Average Value
Number
Average Value
Number
Average Value
LOANS ORIGINATED
2
$227,220
401
$236,785
681
$249,364
98
$128,022
55
$244,578
0
$0
APPLICATIONS APPROVED, NOT ACCEPTED
2
$227,220
67
$254,819
114
$236,517
13
$133,405
10
$258,213
0
$0
APPLICATIONS DENIED
0
$0
114
$240,912
257
$234,953
71
$107,996
21
$219,153
2
$59,415
APPLICATIONS WITHDRAWN
0
$0
100
$247,100
201
$240,662
18
$113,119
6
$305,102
0
$0
FILES CLOSED FOR INCOMPLETENESS
0
$0
37
$278,368
87
$260,416
11
$49,634
3
$238,730
0
$0
Aggregated Statistics For Year 2003 (Based on 2 partial tracts)
A) FHA, FSA/RHS & VA Home Purchase Loans
B) Conventional Home Purchase Loans
C) Refinancings
D) Home Improvement Loans
F) Non-occupant Loans on < 5 Family Dwellings (A B C & D)
Number
Average Value
Number
Average Value
Number
Average Value
Number
Average Value
Number
Average Value
LOANS ORIGINATED
132
$202,331
543
$208,801
636
$199,834
53
$41,478
27
$196,443
APPLICATIONS APPROVED, NOT ACCEPTED
5
$193,660
101
$227,992
141
$196,283
19
$40,737
8
$200,122
APPLICATIONS DENIED
8
$247,695
103
$216,814
328
$205,606
75
$47,682
18
$189,038
APPLICATIONS WITHDRAWN
19
$256,167
228
$212,001
186
$197,962
6
$51,922
6
$241,940
FILES CLOSED FOR INCOMPLETENESS
2
$134,885
79
$264,225
21
$189,790
0
$0
2
$174,230
Aggregated Statistics For Year 2002 (Based on 2 partial tracts)
A) FHA, FSA/RHS & VA Home Purchase Loans
B) Conventional Home Purchase Loans
C) Refinancings
D) Home Improvement Loans
F) Non-occupant Loans on < 5 Family Dwellings (A B C & D)
Number
Average Value
Number
Average Value
Number
Average Value
Number
Average Value
Number
Average Value
LOANS ORIGINATED
398
$188,322
368
$191,671
263
$179,013
40
$29,868
16
$154,659
APPLICATIONS APPROVED, NOT ACCEPTED
5
$164,434
40
$191,652
42
$181,570
18
$36,398
2
$185,470
APPLICATIONS DENIED
21
$203,631
40
$189,565
127
$170,847
50
$40,884
3
$38,540
APPLICATIONS WITHDRAWN
53
$213,693
149
$198,429
82
$182,591
6
$28,102
5
$151,908
FILES CLOSED FOR INCOMPLETENESS
3
$196,977
22
$190,725
24
$198,383
0
$0
2
$151,750
Aggregated Statistics For Year 2001 (Based on 2 partial tracts)
A) FHA, FSA/RHS & VA Home Purchase Loans
B) Conventional Home Purchase Loans
C) Refinancings
D) Home Improvement Loans
F) Non-occupant Loans on < 5 Family Dwellings (A B C & D)
Number
Average Value
Number
Average Value
Number
Average Value
Number
Average Value
Number
Average Value
LOANS ORIGINATED
207
$160,347
230
$177,217
128
$152,137
11
$33,868
5
$178,244
APPLICATIONS APPROVED, NOT ACCEPTED
8
$150,945
22
$192,915
14
$163,218
10
$43,196
0
$0
APPLICATIONS DENIED
11
$174,010
29
$198,732
59
$132,764
16
$30,008
0
$0
APPLICATIONS WITHDRAWN
35
$177,189
130
$201,602
39
$105,571
5
$19,270
0
$0
FILES CLOSED FOR INCOMPLETENESS
3
$131,140
10
$162,989
10
$53,794
2
$24,085
3
$144,523
Aggregated Statistics For Year 2000 (Based on 2 partial tracts)
A) FHA, FSA/RHS & VA Home Purchase Loans
B) Conventional Home Purchase Loans
C) Refinancings
D) Home Improvement Loans
F) Non-occupant Loans on < 5 Family Dwellings (A B C & D)
Number
Average Value
Number
Average Value
Number
Average Value
Number
Average Value
Number
Average Value
LOANS ORIGINATED
117
$154,335
130
$160,321
6
$178,243
0
$0
0
$0
APPLICATIONS APPROVED, NOT ACCEPTED
19
$147,142
24
$134,285
0
$0
0
$0
3
$116,153
APPLICATIONS DENIED
6
$175,567
48
$123,847
3
$134,887
3
$14,453
0
$0
APPLICATIONS WITHDRAWN
127
$158,658
120
$171,152
0
$0
2
$168,610
0
$0
FILES CLOSED FOR INCOMPLETENESS
0
$0
3
$194,303
0
$0
0
$0
0
$0
Aggregated Statistics For Year 1999 (Based on 1 partial tract)
Detailed PMIC statistics for the following Tracts:0088.00
2011 - 2018 National Fire Incident Reporting System (NFIRS) incidents
According to the data from the years 2011 - 2018 the average number of fires per year is 325. The highest number of reported fires - 554 took place in 2018, and the least - 10 in 2011. The data has a growing trend.
When looking into fire subcategories, the most reports belonged to: Outside Fires (48.9%), and Structure Fires (33.1%).
Fire incident types reported to NFIRS in Zip Code 95655


 Nearest zip codes: 95827, 95670, 95830, 95829, 95742, 95608.


 . Federal Facility. U.S. AIR FORCE


 According to the data from the years 2011 - 2018 the average number of fires per year is 325. The highest number of reported fires - 554 took place in 2018, and the least - 10 in 2011. The data has a growing trend.
 When looking into fire subcategories, the most reports belonged to: Outside Fires (48.9%), and Structure Fires (33.1%).