Estimated zip code population in 2022: 4,654 Zip code population in 2010: 4,426 Zip code population in 2000: 4,351
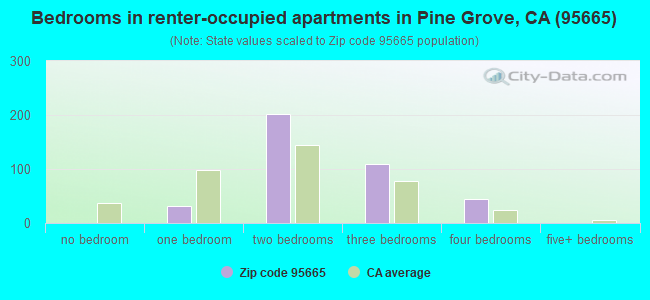
Houses and condos: 2,361 Renter-occupied apartments: 389
% of renters here:
19%
State:
44%
March 2022 cost of living index in zip code 95665: 97.3 (near average, U.S. average is 100)
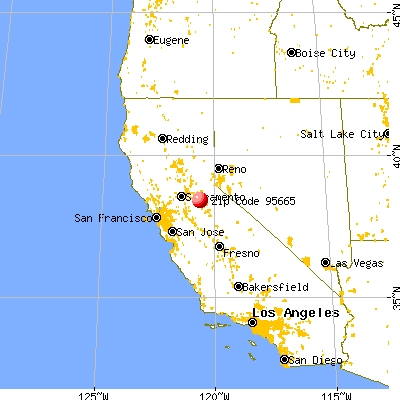
Land area: 20.3 sq. mi. Water area: 0.1 sq. mi.
Population density: 229 people per square mile
(very low).
OSM Map
General Map
Google Map
MSN Map
OSM Map
General Map
Google Map
MSN Map
OSM Map
General Map
Google Map
MSN Map
OSM Map
General Map
Google Map
MSN Map
Please wait while loading the map...
Real estate property taxes paid for housing units in 2022:
This zip code:
0.7% ($2,841)
California:
0.7% ($4,831)
Median real estate property taxes paid for housing units with mortgages in 2022: $2,763 (0.7%) Median real estate property taxes paid for housing units with no mortgage in 2022: $3,093 (0.7%)
Business Search- 14 Million verified businesses
Males: 2,130
(45.8%)
Females: 2,524
(54.2%)
For population 25 years and over in 95665:
High school or higher: 95.3%
Bachelor's degree or higher: 18.9%
Graduate or professional degree: 8.8%
Unemployed: 8.7%
Mean travel time to work (commute): 25.5 minutes
For population 15 years and over in 95665:
Never married: 14.8%
Now married: 56.0%
Separated: 4.9%
Widowed: 8.7%
Divorced: 15.5%
Zip code 95665 compared to state average:
Median household income below state average.
Median house value below state average.
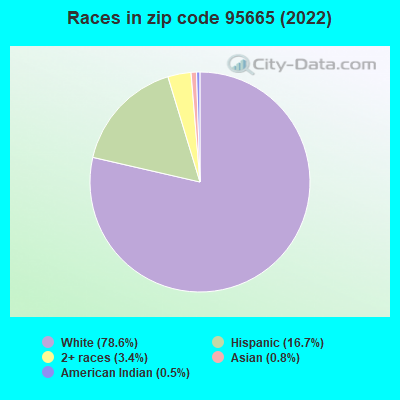
Black race population percentage significantly below state average.
Hispanic race population percentage below state average.
Median age significantly above state average.
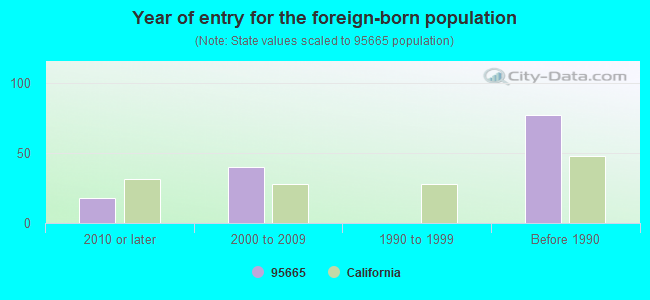
Foreign-born population percentage significantly below state average.
Renting percentage significantly below state average.
Length of stay since moving in above state average.
Percentage of population with a bachelor's degree or higher below state average.
Averages for the 2020 tax year for zip code 95665, filed in 2021:
Average Adjusted Gross Income (AGI) in 2020: $70,906 (Individual Income Tax Returns)
Here:
$70,906
State:
$95,910
Salary/wage: $61,282 (reported on 67.1% of returns)
Here:
$61,282
State:
$77,331
(% of AGI for various income ranges: 1032.8% for AGIs below $25k, 3444.7% for AGIs $25k-50k, 5857.5% for AGIs $50k-75k, 7962.7% for AGIs $75k-100k, 15098.2% for AGIs $100k-200k, 62826.7% for AGIs over 200k)
Taxable interest for individuals: $936 (reported on 47.5% of returns)
This zip code:
$936
California:
$2,294
(% of AGI for various income ranges: 32.3% for AGIs below $25k, 34.7% for AGIs $25k-50k, 66.5% for AGIs $50k-75k, 144.0% for AGIs $75k-100k, 139.5% for AGIs $100k-200k, 290.0% for AGIs over 200k)
Ordinary dividends: $6,684 (reported on 20.5% of returns)
Here:
$6,684
State:
$10,949
(% of AGI for various income ranges: 43.3% for AGIs below $25k, 71.7% for AGIs $25k-50k, 129.5% for AGIs $50k-75k, 260.0% for AGIs $75k-100k, 528.2% for AGIs $100k-200k, 2710.0% for AGIs over 200k)
Net capital gain/loss in AGI: +$17,000 (reported on 19.2% of returns)
Here:
+$17,000
State:
+$49,306
(% of AGI for various income ranges: 36.4% for AGIs below $25k, 46.7% for AGIs $25k-50k, 78.5% for AGIs $50k-75k, 509.3% for AGIs $75k-100k, 882.3% for AGIs $100k-200k, 13320.0% for AGIs over 200k)
Profit/loss from business: +$13,860 (reported on 16.0% of returns)
Here:
+$13,860
State:
+$15,671
(% of AGI for various income ranges: 176.9% for AGIs below $25k, 231.0% for AGIs $25k-50k, 498.0% for AGIs $50k-75k, 198.7% for AGIs $75k-100k, 988.2% for AGIs $100k-200k)
Taxable individual retirement arrangement distribution: $18,779 (reported on 12.8% of returns)
95665:
$18,779
California:
$23,505
(% of AGI for various income ranges: 119.7% for AGIs below $25k, 197.7% for AGIs $25k-50k, 314.5% for AGIs $50k-75k, 642.0% for AGIs $75k-100k, 1184.5% for AGIs $100k-200k)
Total itemized deductions: $29,152 (reported on 11.4% of returns)
Here:
$29,152
State:
$39,517
(% of AGI for various income ranges: 225.9% for AGIs below $25k, 411.0% for AGIs $50k-75k, 623.3% for AGIs $75k-100k, 1264.5% for AGIs $100k-200k, 6226.7% for AGIs over 200k)
Charity contributions: $5,311 (reported on 8.2% of returns)
Here:
$5,311
State:
$12,598
(% of AGI for various income ranges: 34.5% for AGIs $50k-75k, 100.7% for AGIs $75k-100k, 183.2% for AGIs $100k-200k, 1110.0% for AGIs over 200k)
Taxes paid: $7,508 (reported on 11.4% of returns)
95665:
$7,508
State:
$8,807
(% of AGI for various income ranges: 40.5% for AGIs below $25k, 108.0% for AGIs $50k-75k, 174.7% for AGIs $75k-100k, 386.8% for AGIs $100k-200k, 1300.0% for AGIs over 200k)
Earned income credit: $2,014 (reported on 10.0% of returns)
Here:
$2,014
State:
$2,074
(% of AGI for various income ranges: 67.2% for AGIs below $25k, 60.3% for AGIs $25k-50k)
Percentage of individuals using paid preparers for their 2020 taxes: 92.2%
Here:
92%
State:
92%
(% for various income ranges: 89.2% for AGIs below $25k, 95.6% for AGIs $25k-50k, 93.9% for AGIs $50k-75k, 92.3% for AGIs $75k-100k, 92.7% for AGIs $100k-200k, 88.9% for AGIs over 200k)
Averages for the 2012 tax year for zip code 95665, filed in 2013:
Average Adjusted Gross Income (AGI) in 2012: $56,680 (Individual Income Tax Returns)
Here:
$56,680
State:
$72,726
Salary/wage: $47,929 (reported on 67.0% of returns)
Here:
$47,929
State:
$59,079
(% of AGI for various income ranges: 50.5% for AGIs below $25k, 55.7% for AGIs $25k-50k, 56.8% for AGIs $50k-75k, 57.1% for AGIs $75k-100k, 60.5% for AGIs $100k-200k, 52.2% for AGIs over 200k)
Taxable interest for individuals: $1,085 (reported on 50.0% of returns)
This zip code:
$1,085
California:
$2,146
(% of AGI for various income ranges: 3.0% for AGIs below $25k, 1.3% for AGIs $25k-50k, 1.3% for AGIs $50k-75k, 0.6% for AGIs $75k-100k, 0.6% for AGIs $100k-200k, 0.4% for AGIs over 200k)
Ordinary dividends: $5,177 (reported on 23.3% of returns)
Here:
$5,177
State:
$9,308
(% of AGI for various income ranges: 2.7% for AGIs below $25k, 2.1% for AGIs $25k-50k, 2.2% for AGIs $50k-75k, 1.7% for AGIs $75k-100k, 2.0% for AGIs $100k-200k, 2.6% for AGIs over 200k)
Net capital gain/loss in AGI: +$2,007 (reported on 20.9% of returns)
Here:
+$2,007
State:
+$30,460
(% of AGI for various income ranges: 0.2% for AGIs $25k-50k, 0.2% for AGIs $50k-75k, 0.4% for AGIs $75k-100k, 1.6% for AGIs $100k-200k, 1.3% for AGIs over 200k)
Profit/loss from business: +$14,467 (reported on 17.5% of returns)
Here:
+$14,467
State:
+$17,064
(% of AGI for various income ranges: 11.6% for AGIs below $25k, 4.8% for AGIs $25k-50k, 5.6% for AGIs $50k-75k, 2.4% for AGIs $75k-100k, 5.0% for AGIs $100k-200k)
Taxable individual retirement arrangement distribution: $13,576 (reported on 18.0% of returns)
95665:
$13,576
California:
$19,557
(% of AGI for various income ranges: 5.7% for AGIs below $25k, 4.9% for AGIs $25k-50k, 4.3% for AGIs $50k-75k, 3.6% for AGIs $75k-100k, 6.1% for AGIs $100k-200k)
Total itemized deductions: $23,487 (26% of AGI, reported on 40.3% of returns)
Here:
$23,487
State:
$34,004
Here:
25.6% of AGI
State:
22.7% of AGI
(% of AGI for various income ranges: 19.7% for AGIs below $25k, 15.3% for AGIs $25k-50k, 14.4% for AGIs $50k-75k, 17.5% for AGIs $75k-100k, 17.9% for AGIs $100k-200k, 15.8% for AGIs over 200k)
Charity contributions: $2,653 (reported on 33.0% of returns)
Here:
$2,653
State:
$4,659
(% of AGI for various income ranges: 1.0% for AGIs below $25k, 1.4% for AGIs $25k-50k, 1.1% for AGIs $50k-75k, 2.0% for AGIs $75k-100k, 1.8% for AGIs $100k-200k, 1.5% for AGIs over 200k)
Taxes paid: $7,236 (reported on 40.3% of returns)
95665:
$7,236
State:
$14,448
(% of AGI for various income ranges: 3.5% for AGIs below $25k, 3.3% for AGIs $25k-50k, 3.8% for AGIs $50k-75k, 4.8% for AGIs $75k-100k, 6.4% for AGIs $100k-200k, 7.1% for AGIs over 200k)
Earned income credit: $1,680 (reported on 12.1% of returns)
Here:
$1,680
State:
$2,286
(% of AGI for various income ranges: 3.2% for AGIs below $25k, 0.7% for AGIs $25k-50k)
Percentage of individuals using paid preparers for their 2012 taxes: 57.8%
Here:
58%
State:
64%
(% for various income ranges: 48.6% for AGIs below $25k, 59.6% for AGIs $25k-50k, 62.5% for AGIs $50k-75k, 61.9% for AGIs $75k-100k, 66.7% for AGIs $100k-200k, 80.0% for AGIs over 200k)
Averages for the 2004 tax year for zip code 95665, filed in 2005:
Average Adjusted Gross Income (AGI) in 2004: $46,566 (Individual Income Tax Returns)
Here:
$46,566
State:
$58,600
Salary/wage: $40,755 (reported on 70.3% of returns)
Here:
$40,755
State:
$49,455
(% of AGI for various income ranges: 153.4% for AGIs below $10k, 54.1% for AGIs $10k-25k, 62.6% for AGIs $25k-50k, 62.9% for AGIs $50k-75k, 65.9% for AGIs $75k-100k, 56.7% for AGIs over 100k)
Taxable interest for individuals: $1,718 (reported on 62.0% of returns)
This zip code:
$1,718
California:
$2,365
(% of AGI for various income ranges: 20.0% for AGIs below $10k, 4.4% for AGIs $10k-25k, 2.5% for AGIs $25k-50k, 1.9% for AGIs $50k-75k, 1.3% for AGIs $75k-100k, 2.0% for AGIs over 100k)
Taxable dividends: $3,116 (reported on 30.6% of returns)
Here:
$3,116
State:
$4,746
(% of AGI for various income ranges: 10.0% for AGIs below $10k, 3.1% for AGIs $10k-25k, 2.1% for AGIs $25k-50k, 1.4% for AGIs $50k-75k, 1.2% for AGIs $75k-100k, 2.5% for AGIs over 100k)
Net capital gain/loss: +$8,577 (reported on 27.1% of returns)
Here:
+$8,577
State:
+$23,418
(% of AGI for various income ranges: -1.9% for AGIs below $10k, -0.2% for AGIs $10k-25k, 0.8% for AGIs $25k-50k, 1.7% for AGIs $50k-75k, 2.7% for AGIs $75k-100k, 12.5% for AGIs over 100k)
Profit/loss from business: +$15,942 (reported on 21.0% of returns)
Here:
+$15,942
State:
+$16,826
(% of AGI for various income ranges: 8.3% for AGIs below $10k, 6.7% for AGIs $10k-25k, 4.2% for AGIs $25k-50k, 7.5% for AGIs $50k-75k, 6.6% for AGIs $75k-100k, 9.2% for AGIs over 100k)
IRA payment deduction: $3,065 (reported on 2.9% of returns)
95665:
$3,065
California:
$3,192
Self-employed pension: $14,333 (reported on 1.4% of returns)
Here:
$14,333
California:
$17,688
Total itemized deductions: $20,218 (28% of AGI, reported on 45.6% of returns)
Here:
$20,218
State:
$28,113
Here:
28.1% of AGI
State:
25.3% of AGI
(% of AGI for various income ranges: 76.3% for AGIs below $10k, 20.4% for AGIs $10k-25k, 17.5% for AGIs $25k-50k, 19.6% for AGIs $50k-75k, 19.9% for AGIs $75k-100k, 19.6% for AGIs over 100k)
Charity contributions deductions: $2,556 (3% of AGI, reported on 39.3% of returns)
Here:
$2,556
State:
$3,923
Here:
3.4% of AGI
State:
3.3% of AGI
(% of AGI for various income ranges: 4.2% for AGIs below $10k, 2.1% for AGIs $10k-25k, 1.6% for AGIs $25k-50k, 2.2% for AGIs $50k-75k, 1.9% for AGIs $75k-100k, 2.6% for AGIs over 100k)
Total tax: $5,952 (reported on 80.1% of returns)
95665:
$5,952
State:
$10,761
(% of AGI for various income ranges: 6.2% for AGIs below $10k, 4.4% for AGIs $10k-25k, 6.8% for AGIs $25k-50k, 9.0% for AGIs $50k-75k, 10.2% for AGIs $75k-100k, 14.7% for AGIs over 100k)
Earned income credit: $1,388 (reported on 8.8% of returns)
Here:
$1,388
State:
$1,763
Percentage of individuals using paid preparers for their 2004 taxes: 65.2%
Here:
65%
State:
66%
(% for various income ranges: 56.8% for AGIs below $10k, 63.0% for AGIs $10k-25k, 65.2% for AGIs $25k-50k, 67.8% for AGIs $50k-75k, 72.0% for AGIs $75k-100k, 73.8% for AGIs over 100k)
Household received Food Stamps/SNAP in the past 12 months: 240 Household did not receive Food Stamps/SNAP in the past 12 months: 1,802
Women who had a birth in the past 12 months: 94 (93 now married, 0 unmarried) Women who did not have a birth in the past 12 months: 643 (446 now married, 188 unmarried)
Housing units in zip code 95665 with a mortgage: 1,093 (54 second mortgage, 56 both second mortgage and home equity loan) Houses without a mortgage: 20
Median monthly owner costs for units with a mortgage: $1,992 Median monthly owner costs for units without a mortgage: $635
Residents with income below the poverty level in 2022:
This zip code:
5.9%
Whole state:
12.2%
Residents with income below 50% of the poverty level in 2022:
This zip code:
3.9%
Whole state:
6.2%
Median number of rooms in houses and condos:
Here:
5.7
State:
6.0
Median number of rooms in apartments:
Here:
3.8
State:
3.9
Notable locations in this zip code not listed on our city pages
Notable locations in zip code 95665: California Youth Authority (A), Zion California Department of Forestry Station (B), U'macha'tam'ma Environmental Campsites (C), Pine Grove Forestry Camp (D), Pine Grove Town Hall (E), Chaw'se Regional Indian Museum (F), American Legion Ambulance Station 4 (G), Department of Forestry and Fire Protection Station 80 Mount Zion (H), Amador Fire Protection District Station 115 (I), Amador Fire Protection District Station 114 (J), Department of Forestry and Fire Protection Pine Grove Conservation (K). Display/hide their locations on the map
In group quarters: 82 (-1 institutionalized population)
Size of family households: 753 2-persons, 215 3-persons, 267 4-persons, 113 5-persons, 8 6-persons
Size of nonfamily households: 571 1-person, 124 2-persons
389 married couples with children.
0 single-parent households ().
95.3% of residents of 95665 zip code speak English at home.
3.9% of residents speak Spanish at home (70% very well, 18% well, 12% not at all).
1.1% of residents speak other language at home (100% very well).
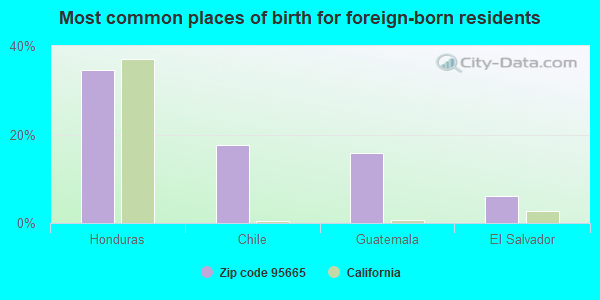
Foreign born population: 113 (2.4%) (50.5% of them are naturalized citizens)
This zip code:
2.4%
Whole state:
26.7%
35%Honduras
18%Chile
16%Guatemala
6%El Salvador
18%English
8%Italian
7%German
6%Irish
4%Portuguese
4%European
3%American
Year of entry for the foreign-born population
182010 or later
402000 to 2009
01990 to 1999
77Before 1990
Facilities with environmental interests located in this zip code:
CAL TRANS (19587 HWY 88 in PINE GROVE, CA)
Small Quantity Generators, between 100 kg and 1000 kg of hazardous waste/month (Resource Conservation and Recovery Act (tracking hazardous waste)) - notification Organizations: CALIFORNIA STATE OF (CONTACT/OWNER)
Housing units lacking complete plumbing facilities: 0.8%
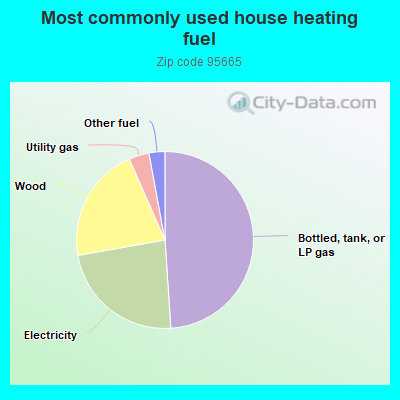
49.0%Bottled, tank, or LP gas
23.3%Electricity
21.2%Wood
3.7%Utility gas
2.9%Other fuel
Population in 1990: 3,066. Population change in the 1990s: +1,285 (+41.9%).
Place of birth for U.S.-born residents:
This state: 3,639
Northeast: 152
Midwest: 149
South: 401
West: 162
63% of the 95665 zip code residents lived in the same house 5 years ago. Out of people who lived in different houses, 39% lived in this county. Out of people who lived in different counties, 50% lived in California.
90% of the 95665 zip code residents lived in the same house 1 year ago. Out of people who lived in different houses, 23% moved from this county. Out of people who lived in different houses, 63% moved from different county within same state. Out of people who lived in different houses, 16% moved from different state.
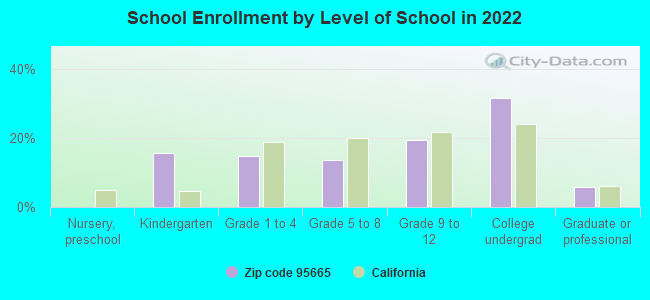
Private vs. public school enrollment:
Students in private schools in grades 1 to 8 (elementary and middle school): 19
Here:
9.6%
California:
10.5%
Students in private schools in grades 9 to 12 (high school): 22
Here:
15.7%
California:
8.5%
Students in private undergraduate colleges: 111
Here:
46.6%
California:
15.9%
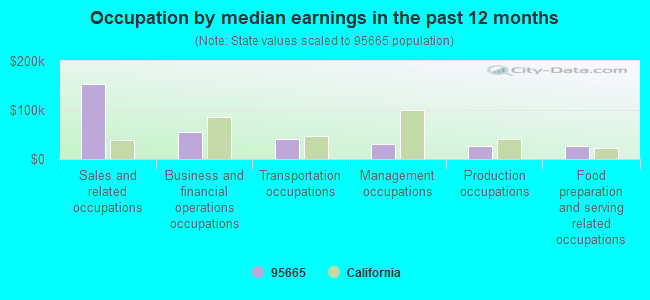
Occupation by median earnings in the past 12 months ($)
153,754Sales and related occupations
55,299Business and financial operations occupations
41,464Transportation occupations
30,937Management occupations
27,142Production occupations
26,138Food preparation and serving related occupations
Top industries in this zip code by the number of employees in 2005:
Accommodation and Food Services: Full-Service Restaurants (20-49: 1, 10-19: 1)
Other Services (except Public Administration): Religious Organizations (20-49: 1, 5-9: 1, 1-4: 2)
Administrative and Support and Waste Management and Remediation Services: Solid Waste Collection (20-49: 1)
Administrative and Support and Waste Management and Remediation Services: Septic Tank and Related Services (10-19: 1, 1-4: 1)
Finance and Insurance: Commercial Banking (10-19: 1)
People in group quarters in 2010:
62 people in correctional residential facilities
4 people in group homes intended for adults
4 people in other noninstitutional facilities
2 people in workers' group living quarters and job corps centers
People in group quarters in 2000:
80 people in other types of correctional institutions
Fatal accident statistics in 2014:
Fatal accident count: 1
Vehicles involved in fatal accidents: 1
Fatal accidents caused by drunken drivers: 0
Fatalities: 1
Persons involved in fatal accidents: 1
Pedestrians involved in fatal accidents: 0
Fatal accident statistics in 2011:
Fatal accident count: 1
Vehicles involved in fatal accidents: 2
Fatal accidents caused by drunken drivers: 0
Fatalities: 1
Persons involved in fatal accidents: 3
Pedestrians involved in fatal accidents: 0
2005 - 2018 National Fire Incident Reporting System (NFIRS) incidents
According to the data from the years 2005 - 2018 the average number of fires per year is 31. The highest number of reported fire incidents - 46 took place in 2014, and the least - 18 in 2015. The data has a growing trend.
When looking into fire subcategories, the most reports belonged to: Outside Fires (53.7%), and Structure Fires (29.7%).
Fire incident types reported to NFIRS in Zip Code 95665


 Nearest zip codes: 95232, 95689, 95245, 95629, 95685, 95642.


 According to the data from the years 2005 - 2018 the average number of fires per year is 31. The highest number of reported fire incidents - 46 took place in 2014, and the least - 18 in 2015. The data has a growing trend.
 When looking into fire subcategories, the most reports belonged to: Outside Fires (53.7%), and Structure Fires (29.7%).