Estimated zip code population in 2022: 1,938 Zip code population in 2010: 897 Zip code population in 2000: 1,512
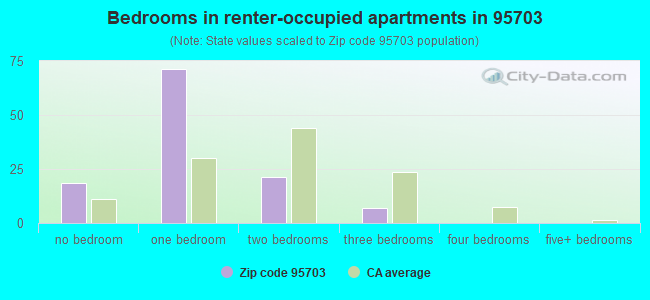
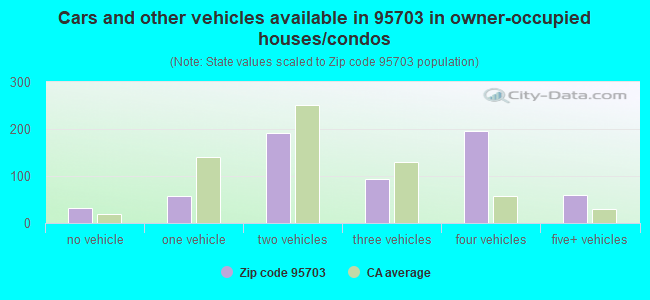
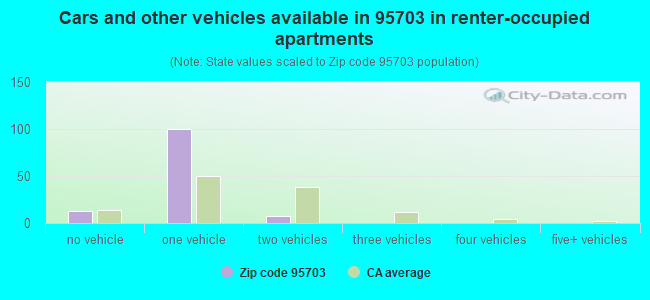
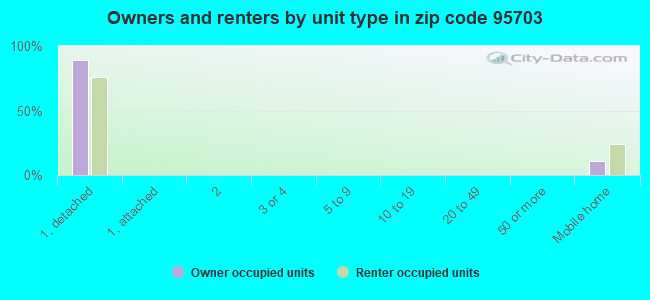
Houses and condos: 880 Renter-occupied apartments: 117
% of renters here:
16%
State:
44%
March 2022 cost of living index in zip code 95703: 101.8 (near average, U.S. average is 100)
Land area: 4.5 sq. mi. Water area: 0.0 sq. mi.
Population density: 435 people per square mile
(low).
OSM Map
General Map
Google Map
MSN Map
OSM Map
General Map
Google Map
MSN Map
OSM Map
General Map
Google Map
MSN Map
OSM Map
General Map
Google Map
MSN Map
Please wait while loading the map...
Real estate property taxes paid for housing units in 2022:
This zip code:
0.7% ($4,577)
California:
0.7% ($4,831)
Median real estate property taxes paid for housing units with mortgages in 2022: $4,939 (0.7%) Median real estate property taxes paid for housing units with no mortgage in 2022: $2,748 (0.6%)
Averages for the 2020 tax year for zip code 95703, filed in 2021:
Average Adjusted Gross Income (AGI) in 2020: $77,587 (Individual Income Tax Returns)
Here:
$77,587
State:
$95,910
Salary/wage: $65,556 (reported on 69.4% of returns)
Here:
$65,556
State:
$77,331
(% of AGI for various income ranges: 1168.0% for AGIs below $25k, 3656.7% for AGIs $25k-50k, 7185.7% for AGIs $50k-75k, 8481.2% for AGIs $75k-100k, 16818.0% for AGIs $100k-200k, 49025.0% for AGIs over 200k)
Taxable interest for individuals: $802 (reported on 45.9% of returns)
This zip code:
$802
California:
$2,294
(% of AGI for various income ranges: 16.7% for AGIs below $25k, 75.0% for AGIs $25k-50k, 45.7% for AGIs $50k-75k, 35.0% for AGIs $75k-100k, 115.0% for AGIs $100k-200k, 355.0% for AGIs over 200k)
Ordinary dividends: $5,867 (reported on 21.4% of returns)
Here:
$5,867
State:
$10,949
(% of AGI for various income ranges: 77.3% for AGIs below $25k, 50.8% for AGIs $25k-50k, 157.1% for AGIs $50k-75k, 112.5% for AGIs $75k-100k, 532.0% for AGIs $100k-200k, 1615.0% for AGIs over 200k)
Net capital gain/loss in AGI: +$13,391 (reported on 22.4% of returns)
Here:
+$13,391
State:
+$49,306
(% of AGI for various income ranges: 25.3% for AGIs below $25k, 11.7% for AGIs $25k-50k, 7.1% for AGIs $50k-75k, 243.8% for AGIs $75k-100k, 1224.0% for AGIs $100k-200k, 7350.0% for AGIs over 200k)
Profit/loss from business: +$21,205 (reported on 20.4% of returns)
Here:
+$21,205
State:
+$15,671
(% of AGI for various income ranges: 190.0% for AGIs below $25k, 610.0% for AGIs $25k-50k, 481.2% for AGIs $75k-100k, 2839.0% for AGIs $100k-200k)
Taxable individual retirement arrangement distribution: $16,750 (reported on 12.2% of returns)
95703:
$16,750
California:
$23,505
(% of AGI for various income ranges: 341.7% for AGIs $25k-50k, 732.9% for AGIs $50k-75k, 1087.0% for AGIs $100k-200k)
Total itemized deductions: $28,842 (reported on 19.4% of returns)
Here:
$28,842
State:
$39,517
(% of AGI for various income ranges: 406.7% for AGIs below $25k, 787.1% for AGIs $50k-75k, 823.8% for AGIs $75k-100k, 1924.0% for AGIs $100k-200k, 8680.0% for AGIs over 200k)
Charity contributions: $4,477 (reported on 13.3% of returns)
Here:
$4,477
State:
$12,598
(% of AGI for various income ranges: 84.2% for AGIs $25k-50k, 71.2% for AGIs $75k-100k, 269.0% for AGIs $100k-200k, 775.0% for AGIs over 200k)
Taxes paid: $7,384 (reported on 19.4% of returns)
95703:
$7,384
State:
$8,807
(% of AGI for various income ranges: 94.7% for AGIs below $25k, 227.1% for AGIs $50k-75k, 258.8% for AGIs $75k-100k, 616.0% for AGIs $100k-200k, 1395.0% for AGIs over 200k)
Earned income credit: $1,730 (reported on 10.2% of returns)
Here:
$1,730
State:
$2,074
(% of AGI for various income ranges: 64.7% for AGIs below $25k, 63.3% for AGIs $25k-50k)
Percentage of individuals using paid preparers for their 2020 taxes: 92.9%
Here:
93%
State:
92%
(% for various income ranges: 86.2% for AGIs below $25k, 95.0% for AGIs $25k-50k, 92.3% for AGIs $50k-75k, 91.7% for AGIs $75k-100k, 100.0% for AGIs $100k-200k, 100.0% for AGIs over 200k)
Averages for the 2012 tax year for zip code 95703, filed in 2013:
Average Adjusted Gross Income (AGI) in 2012: $61,043 (Individual Income Tax Returns)
Here:
$61,043
State:
$72,726
Salary/wage: $55,129 (reported on 69.6% of returns)
Here:
$55,129
State:
$59,079
(% of AGI for various income ranges: 51.2% for AGIs below $25k, 57.9% for AGIs $25k-50k, 63.9% for AGIs $50k-75k, 61.2% for AGIs $75k-100k, 66.8% for AGIs $100k-200k, 64.1% for AGIs over 200k)
Taxable interest for individuals: $715 (reported on 49.4% of returns)
This zip code:
$715
California:
$2,146
(% of AGI for various income ranges: 1.6% for AGIs below $25k, 1.1% for AGIs $25k-50k, 0.2% for AGIs $50k-75k, 0.6% for AGIs $75k-100k, 0.4% for AGIs $100k-200k, 0.5% for AGIs over 200k)
Ordinary dividends: $3,614 (reported on 27.8% of returns)
Here:
$3,614
State:
$9,308
(% of AGI for various income ranges: 2.8% for AGIs below $25k, 1.7% for AGIs $25k-50k, 1.9% for AGIs $50k-75k, 2.6% for AGIs $75k-100k, 1.7% for AGIs $100k-200k)
Net capital gain/loss in AGI: +$2,365 (reported on 21.5% of returns)
Here:
+$2,365
State:
+$30,460
(% of AGI for various income ranges: 0.2% for AGIs $75k-100k, 2.8% for AGIs $100k-200k)
Profit/loss from business: +$16,260 (reported on 19.0% of returns)
Here:
+$16,260
State:
+$17,064
(% of AGI for various income ranges: 14.9% for AGIs below $25k, 16.2% for AGIs $25k-50k, 5.1% for AGIs $75k-100k, 4.0% for AGIs $100k-200k)
Taxable individual retirement arrangement distribution: $16,600 (reported on 15.2% of returns)
95703:
$16,600
California:
$19,557
(% of AGI for various income ranges: 4.8% for AGIs below $25k, 6.4% for AGIs $25k-50k, 9.0% for AGIs $50k-75k, 5.2% for AGIs $100k-200k)
Total itemized deductions: $25,243 (26% of AGI, reported on 44.3% of returns)
Here:
$25,243
State:
$34,004
Here:
26.2% of AGI
State:
22.7% of AGI
(% of AGI for various income ranges: 21.4% for AGIs below $25k, 14.6% for AGIs $25k-50k, 19.3% for AGIs $50k-75k, 15.1% for AGIs $75k-100k, 19.4% for AGIs $100k-200k, 20.2% for AGIs over 200k)
Charity contributions: $2,759 (reported on 36.7% of returns)
Here:
$2,759
State:
$4,659
(% of AGI for various income ranges: 0.9% for AGIs below $25k, 1.1% for AGIs $25k-50k, 2.6% for AGIs $50k-75k, 1.5% for AGIs $75k-100k, 2.0% for AGIs $100k-200k, 1.0% for AGIs over 200k)
Taxes paid: $8,149 (reported on 44.3% of returns)
95703:
$8,149
State:
$14,448
(% of AGI for various income ranges: 4.3% for AGIs below $25k, 3.7% for AGIs $25k-50k, 4.5% for AGIs $50k-75k, 5.4% for AGIs $75k-100k, 6.7% for AGIs $100k-200k, 8.4% for AGIs over 200k)
Earned income credit: $1,850 (reported on 10.1% of returns)
Here:
$1,850
State:
$2,286
(% of AGI for various income ranges: 3.2% for AGIs below $25k, 0.8% for AGIs $25k-50k)
Percentage of individuals using paid preparers for their 2012 taxes: 55.7%
Here:
56%
State:
64%
(% for various income ranges: 48.1% for AGIs below $25k, 56.2% for AGIs $25k-50k, 58.3% for AGIs $50k-75k, 66.7% for AGIs $75k-100k, 58.3% for AGIs $100k-200k, 66.7% for AGIs over 200k)
Averages for the 2004 tax year for zip code 95703, filed in 2005:
Average Adjusted Gross Income (AGI) in 2004: $48,665 (Individual Income Tax Returns)
Here:
$48,665
State:
$58,600
Salary/wage: $45,444 (reported on 75.2% of returns)
Here:
$45,444
State:
$49,455
(% of AGI for various income ranges: 143.1% for AGIs below $10k, 59.8% for AGIs $10k-25k, 68.3% for AGIs $25k-50k, 76.3% for AGIs $50k-75k, 80.7% for AGIs $75k-100k, 62.1% for AGIs over 100k)
Taxable interest for individuals: $1,169 (reported on 58.8% of returns)
This zip code:
$1,169
California:
$2,365
(% of AGI for various income ranges: 14.1% for AGIs below $10k, 3.8% for AGIs $10k-25k, 2.3% for AGIs $25k-50k, 1.0% for AGIs $50k-75k, 0.4% for AGIs $75k-100k, 0.9% for AGIs over 100k)
Taxable dividends: $2,194 (reported on 28.7% of returns)
Here:
$2,194
State:
$4,746
(% of AGI for various income ranges: 7.2% for AGIs below $10k, 1.3% for AGIs $10k-25k, 1.6% for AGIs $25k-50k, 1.2% for AGIs $50k-75k, 0.3% for AGIs $75k-100k, 1.5% for AGIs over 100k)
Net capital gain/loss: +$3,820 (reported on 24.9% of returns)
Here:
+$3,820
State:
+$23,418
(% of AGI for various income ranges: -2.6% for AGIs below $10k, -1.1% for AGIs $10k-25k, 0.4% for AGIs $25k-50k, -0.2% for AGIs $50k-75k, -0.1% for AGIs $75k-100k, 5.8% for AGIs over 100k)
Profit/loss from business: +$14,659 (reported on 22.0% of returns)
Here:
+$14,659
State:
+$16,826
(% of AGI for various income ranges: 35.6% for AGIs below $10k, 12.2% for AGIs $10k-25k, 7.7% for AGIs $25k-50k, -1.2% for AGIs $50k-75k, 2.0% for AGIs $75k-100k, 11.2% for AGIs over 100k)
IRA payment deduction: $3,680 (reported on 3.0% of returns)
95703:
$3,680
California:
$3,192
Self-employed pension: $7,062 (reported on 1.9% of returns)
Here:
$7,062
California:
$17,688
Total itemized deductions: $22,235 (29% of AGI, reported on 49.3% of returns)
Here:
$22,235
State:
$28,113
Here:
29.0% of AGI
State:
25.3% of AGI
(% of AGI for various income ranges: 68.4% for AGIs below $10k, 22.9% for AGIs $10k-25k, 20.7% for AGIs $25k-50k, 23.5% for AGIs $50k-75k, 23.5% for AGIs $75k-100k, 20.9% for AGIs over 100k)
Charity contributions deductions: $2,753 (3% of AGI, reported on 45.5% of returns)
Here:
$2,753
State:
$3,923
Here:
3.5% of AGI
State:
3.3% of AGI
(% of AGI for various income ranges: 4.8% for AGIs below $10k, 2.4% for AGIs $10k-25k, 2.6% for AGIs $25k-50k, 2.8% for AGIs $50k-75k, 3.0% for AGIs $75k-100k, 2.2% for AGIs over 100k)
Total tax: $6,728 (reported on 79.1% of returns)
95703:
$6,728
State:
$10,761
(% of AGI for various income ranges: 7.2% for AGIs below $10k, 5.3% for AGIs $10k-25k, 7.1% for AGIs $25k-50k, 8.6% for AGIs $50k-75k, 9.6% for AGIs $75k-100k, 16.0% for AGIs over 100k)
Earned income credit: $1,233 (reported on 10.4% of returns)
Here:
$1,233
State:
$1,763
Percentage of individuals using paid preparers for their 2004 taxes: 61.7%
Here:
62%
State:
66%
(% for various income ranges: 48.8% for AGIs below $10k, 61.1% for AGIs $10k-25k, 65.1% for AGIs $25k-50k, 65.2% for AGIs $50k-75k, 65.5% for AGIs $75k-100k, 70.0% for AGIs over 100k)
Household received Food Stamps/SNAP in the past 12 months: 21 Household did not receive Food Stamps/SNAP in the past 12 months: 708
Women who did not have a birth in the past 12 months: 333 (125 now married, 208 unmarried)
Housing units in zip code 95703 with a mortgage: 425 (25 second mortgage, 5 home equity loan, 21 both second mortgage and home equity loan) Houses without a mortgage: 10
Median monthly owner costs for units with a mortgage: $2,390 Median monthly owner costs for units without a mortgage: $703
Residents with income below the poverty level in 2022:
This zip code:
11.7%
Whole state:
12.2%
Residents with income below 50% of the poverty level in 2022:
This zip code:
7.2%
Whole state:
6.2%
Median number of rooms in houses and condos:
Here:
6.2
State:
6.0
Median number of rooms in apartments:
Here:
2.9
State:
3.9
Notable locations in this zip code not listed on our city pages
In group quarters: 159 (-1 institutionalized population)
Size of family households: 340 2-persons, 57 3-persons, 54 4-persons, 46 5-persons, 15 7-or-more-persons
Size of nonfamily households: 182 1-person, 43 2-persons, 10 3-persons
65 married couples with children.
17 single-parent households (17 women).
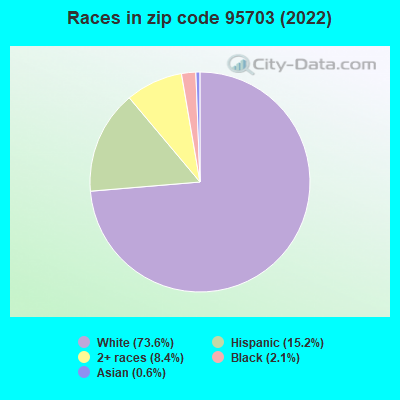
86.7% of residents of 95703 zip code speak English at home.
12.4% of residents speak Spanish at home (15% very well, 51% well, 34% not well).
0.5% of residents speak other Indo-European language at home (100% very well).
0.1% of residents speak Asian or Pacific Island language at home (100% very well).
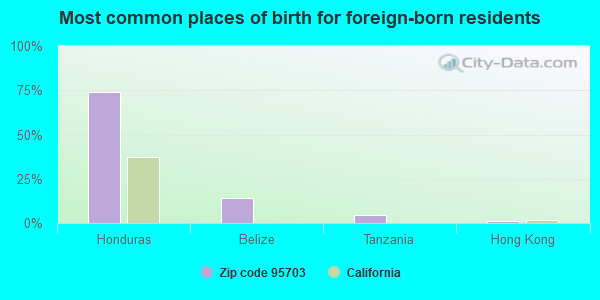
Foreign born population: 205 (10.6%) (22.5% of them are naturalized citizens)
This zip code:
10.6%
Whole state:
26.7%
74%Honduras
14%Belize
4%Tanzania
1%Hong Kong
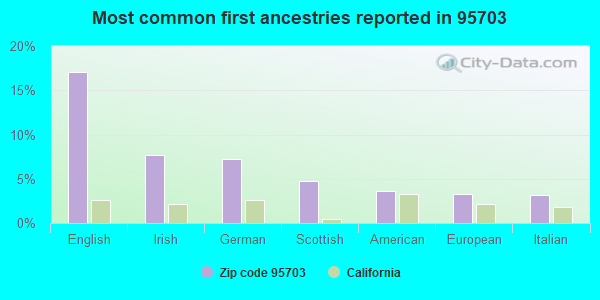
17%English
8%Irish
7%German
5%Scottish
4%American
3%European
3%Italian
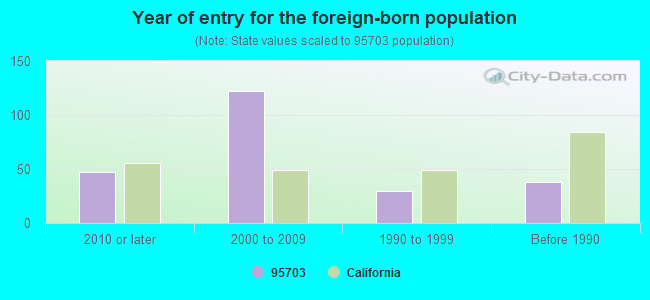
Year of entry for the foreign-born population
472010 or later
1222000 to 2009
301990 to 1999
38Before 1990
Facilities with environmental interests located in this zip code:
APPLEGATE GARAGE (17914 APPLEGATE RD in APPLEGATE, CA)
Small Quantity Generators, between 100 kg and 1000 kg of hazardous waste/month (Resource Conservation and Recovery Act (tracking hazardous waste)) - notification STATE MASTER (California - Used Oil Recycling System ) - USED OIL RECYCLING Business NAICS classification: GENERAL AUTOMOTIVE REPAIR. Organizations: MIKE SCHLENDER (CONTACT/OWNER)
Housing units lacking complete plumbing facilities: 3.9% Housing units lacking complete kitchen facilities: 9.9%
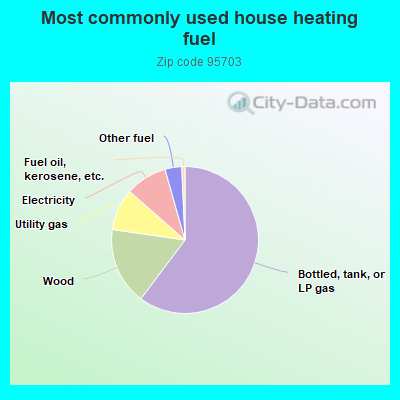
60.5%Bottled, tank, or LP gas
17.1%Wood
9.2%Utility gas
9.2%Electricity
3.7%Other fuel
0.7%Fuel oil, kerosene, etc.
Population in 1990: 1,898.
Place of birth for U.S.-born residents:
This state: 1,221
Northeast: 45
Midwest: 167
South: 76
West: 176
70% of the 95703 zip code residents lived in the same house 5 years ago. Out of people who lived in different houses, 54% lived in this county. Out of people who lived in different counties, 50% lived in California.
91% of the 95703 zip code residents lived in the same house 1 year ago. Out of people who lived in different houses, 81% moved from this county. Out of people who lived in different houses, 9% moved from different county within same state. Out of people who lived in different houses, 6% moved from different state.
Private vs. public school enrollment:
Students in private schools in grades 1 to 8 (elementary and middle school):
Here:
0.0%
California:
10.5%
Students in private schools in grades 9 to 12 (high school): 27
Here:
82.2%
California:
8.5%
Students in private undergraduate colleges: 56
Here:
32.3%
California:
15.9%
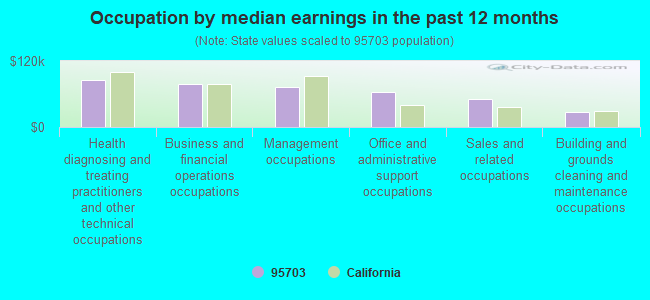
Occupation by median earnings in the past 12 months ($)
84,652Health diagnosing and treating practitioners and other technical occupations
77,762Business and financial operations occupations
73,443Management occupations
64,323Office and administrative support occupations
50,079Sales and related occupations
26,419Building and grounds cleaning and maintenance occupations
Companies with federal contracts located in this zip code:
ATB ENVIRONMENTAL SERVICES (900 HILLTOP CT in APPLEGATE, CA; small business) : $35,975 in 3 contractsfrom 2004 to 2005
$19,890 with Army for Other Environmental Services, Studies, and Analytical Support. Signed on 2004-10-05. Completion date: 2004-11-24.
$14,420, same as above.Signed on 2004-10-04. Completion date: 2004-10-15.
$1,665, same as above.Signed on 2005-04-18. Completion date: 2004-10-15.
Top industries in this zip code by the number of employees in 2005:
Other Services (except Public Administration): Religious Organizations (10-19 employees: 1 establishment, 5-9 employees: 1 establishment)
Construction: All Other Specialty Trade Contractors (10-19: 1, 5-9: 1)
Construction: Drywall and Insulation Contractors (10-19: 1)
Construction: Poured Concrete Foundation and Structure Contractors (10-19: 1)
Health Care and Social Assistance: Child Day Care Services (5-9: 2)
Construction: Electrical Contractors (5-9: 1)
Construction: Plumbing, Heating, and Air-Conditioning Contractors (1-4: 3)
Professional, Scientific, and Technical Services: Other Accounting Services (1-4: 2)
Administrative and Support and Waste Management and Remediation Services: Landscaping Services (1-4: 2)
People in group quarters in 2010:
55 people in other noninstitutional facilities
27 people in correctional facilities intended for juveniles
5 people in residential treatment centers for adults
4 people in group homes intended for adults
People in group quarters in 2000:
11 people in other noninstitutional group quarters
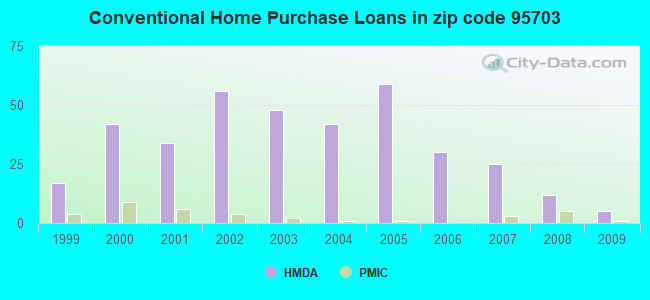
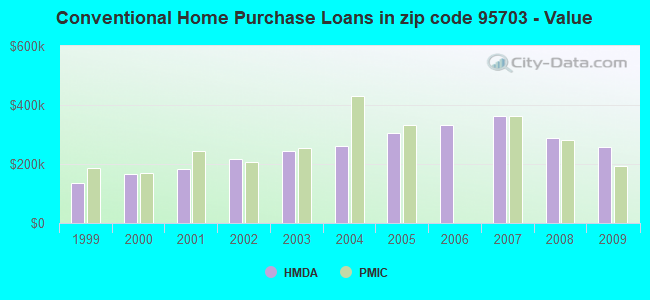
Home Mortgage Disclosure Act Aggregated Statistics For Year 2009 (Based on 2 partial tracts)
A) FHA, FSA/RHS & VA Home Purchase Loans
B) Conventional Home Purchase Loans
C) Refinancings
D) Home Improvement Loans
F) Non-occupant Loans on < 5 Family Dwellings (A B C & D)
Number
Average Value
Number
Average Value
Number
Average Value
Number
Average Value
Number
Average Value
LOANS ORIGINATED
10
$281,398
5
$256,544
69
$255,306
3
$105,780
2
$171,510
APPLICATIONS APPROVED, NOT ACCEPTED
0
$0
2
$189,995
9
$348,381
0
$0
1
$190,000
APPLICATIONS DENIED
2
$247,505
5
$187,736
28
$257,410
2
$17,975
4
$238,265
APPLICATIONS WITHDRAWN
3
$236,210
4
$278,060
17
$298,796
2
$85,240
0
$0
FILES CLOSED FOR INCOMPLETENESS
1
$206,430
0
$0
3
$202,320
0
$0
0
$0
Aggregated Statistics For Year 2008 (Based on 2 partial tracts)
A) FHA, FSA/RHS & VA Home Purchase Loans
B) Conventional Home Purchase Loans
C) Refinancings
D) Home Improvement Loans
F) Non-occupant Loans on < 5 Family Dwellings (A B C & D)
G) Loans On Manufactured Home Dwelling (A B C & D)
Number
Average Value
Number
Average Value
Number
Average Value
Number
Average Value
Number
Average Value
Number
Average Value
LOANS ORIGINATED
4
$259,318
12
$289,528
48
$251,979
6
$162,267
3
$274,893
2
$365,100
APPLICATIONS APPROVED, NOT ACCEPTED
2
$270,615
2
$255,210
3
$264,623
0
$0
1
$219,780
0
$0
APPLICATIONS DENIED
3
$232,787
4
$153,280
23
$289,570
5
$204,168
2
$122,215
2
$40,565
APPLICATIONS WITHDRAWN
0
$0
3
$202,660
12
$301,682
0
$0
1
$378,960
0
$0
FILES CLOSED FOR INCOMPLETENESS
0
$0
2
$303,480
1
$498,100
1
$7,190
0
$0
0
$0
Aggregated Statistics For Year 2007 (Based on 2 partial tracts)
A) FHA, FSA/RHS & VA Home Purchase Loans
B) Conventional Home Purchase Loans
C) Refinancings
D) Home Improvement Loans
F) Non-occupant Loans on < 5 Family Dwellings (A B C & D)
G) Loans On Manufactured Home Dwelling (A B C & D)
Number
Average Value
Number
Average Value
Number
Average Value
Number
Average Value
Number
Average Value
Number
Average Value
LOANS ORIGINATED
1
$166,370
25
$361,381
71
$310,096
11
$330,975
7
$343,311
3
$172,880
APPLICATIONS APPROVED, NOT ACCEPTED
1
$252,640
5
$331,104
20
$294,082
2
$33,380
1
$35,950
0
$0
APPLICATIONS DENIED
1
$349,180
9
$219,664
33
$325,559
5
$89,760
5
$169,044
2
$83,700
APPLICATIONS WITHDRAWN
0
$0
4
$377,422
13
$277,527
2
$318,885
0
$0
0
$0
FILES CLOSED FOR INCOMPLETENESS
0
$0
1
$603,880
6
$519,148
0
$0
0
$0
0
$0
Aggregated Statistics For Year 2006 (Based on 2 partial tracts)
A) FHA, FSA/RHS & VA Home Purchase Loans
B) Conventional Home Purchase Loans
C) Refinancings
D) Home Improvement Loans
E) Loans on Dwellings For 5+ Families
F) Non-occupant Loans on < 5 Family Dwellings (A B C & D)
G) Loans On Manufactured Home Dwelling (A B C & D)
Number
Average Value
Number
Average Value
Number
Average Value
Number
Average Value
Number
Average Value
Number
Average Value
Number
Average Value
LOANS ORIGINATED
0
$0
30
$331,961
82
$267,997
18
$160,269
0
$0
6
$294,748
1
$77,030
APPLICATIONS APPROVED, NOT ACCEPTED
0
$0
8
$329,282
13
$323,821
1
$492,960
0
$0
3
$226,967
0
$0
APPLICATIONS DENIED
1
$252,640
6
$407,377
31
$261,289
6
$250,760
1
$647,010
7
$305,019
0
$0
APPLICATIONS WITHDRAWN
0
$0
3
$252,643
23
$307,073
5
$76,820
0
$0
3
$189,653
0
$0
FILES CLOSED FOR INCOMPLETENESS
0
$0
1
$617,230
5
$177,672
0
$0
0
$0
1
$340,960
0
$0
Aggregated Statistics For Year 2005 (Based on 2 partial tracts)
B) Conventional Home Purchase Loans
C) Refinancings
D) Home Improvement Loans
F) Non-occupant Loans on < 5 Family Dwellings (A B C & D)
G) Loans On Manufactured Home Dwelling (A B C & D)
Number
Average Value
Number
Average Value
Number
Average Value
Number
Average Value
Number
Average Value
LOANS ORIGINATED
59
$306,707
120
$286,507
26
$133,431
21
$274,307
4
$184,602
APPLICATIONS APPROVED, NOT ACCEPTED
7
$229,754
17
$309,308
5
$181,574
6
$265,650
0
$0
APPLICATIONS DENIED
20
$326,638
40
$261,372
9
$220,349
7
$347,273
6
$242,885
APPLICATIONS WITHDRAWN
6
$400,702
37
$230,187
2
$138,645
0
$0
7
$204,226
FILES CLOSED FOR INCOMPLETENESS
2
$513,500
10
$323,300
1
$102,700
0
$0
1
$234,160
Aggregated Statistics For Year 2004 (Based on 2 partial tracts)
B) Conventional Home Purchase Loans
C) Refinancings
D) Home Improvement Loans
F) Non-occupant Loans on < 5 Family Dwellings (A B C & D)
G) Loans On Manufactured Home Dwelling (A B C & D)
Number
Average Value
Number
Average Value
Number
Average Value
Number
Average Value
Number
Average Value
LOANS ORIGINATED
42
$261,885
129
$238,694
21
$167,841
10
$221,010
7
$140,993
APPLICATIONS APPROVED, NOT ACCEPTED
4
$435,705
12
$293,637
0
$0
0
$0
0
$0
APPLICATIONS DENIED
3
$378,620
33
$192,640
4
$171,252
2
$192,050
2
$87,810
APPLICATIONS WITHDRAWN
5
$209,714
36
$190,337
2
$188,970
1
$246,480
4
$143,780
FILES CLOSED FOR INCOMPLETENESS
1
$503,230
11
$301,378
0
$0
0
$0
0
$0
Aggregated Statistics For Year 2003 (Based on 2 partial tracts)
A) FHA, FSA/RHS & VA Home Purchase Loans
B) Conventional Home Purchase Loans
C) Refinancings
D) Home Improvement Loans
F) Non-occupant Loans on < 5 Family Dwellings (A B C & D)
Number
Average Value
Number
Average Value
Number
Average Value
Number
Average Value
Number
Average Value
LOANS ORIGINATED
1
$136,590
48
$242,800
295
$194,232
9
$40,966
21
$167,988
APPLICATIONS APPROVED, NOT ACCEPTED
0
$0
6
$273,353
32
$189,161
4
$21,052
3
$211,563
APPLICATIONS DENIED
0
$0
8
$278,445
60
$208,841
9
$32,293
3
$232,787
APPLICATIONS WITHDRAWN
0
$0
8
$222,345
63
$208,774
1
$231,080
1
$209,510
FILES CLOSED FOR INCOMPLETENESS
1
$183,830
1
$287,560
7
$229,167
0
$0
2
$190,510
Aggregated Statistics For Year 2002 (Based on 2 partial tracts)
A) FHA, FSA/RHS & VA Home Purchase Loans
B) Conventional Home Purchase Loans
C) Refinancings
D) Home Improvement Loans
F) Non-occupant Loans on < 5 Family Dwellings (A B C & D)
Number
Average Value
Number
Average Value
Number
Average Value
Number
Average Value
Number
Average Value
LOANS ORIGINATED
1
$163,290
56
$215,468
191
$194,657
8
$42,364
12
$186,828
APPLICATIONS APPROVED, NOT ACCEPTED
0
$0
7
$328,493
24
$156,532
2
$54,945
0
$0
APPLICATIONS DENIED
0
$0
12
$147,374
36
$171,024
4
$31,068
3
$130,087
APPLICATIONS WITHDRAWN
1
$159,190
6
$245,967
32
$161,335
2
$33,380
1
$345,070
FILES CLOSED FOR INCOMPLETENESS
0
$0
2
$133,510
6
$231,932
0
$0
0
$0
Aggregated Statistics For Year 2001 (Based on 2 partial tracts)
A) FHA, FSA/RHS & VA Home Purchase Loans
B) Conventional Home Purchase Loans
C) Refinancings
D) Home Improvement Loans
F) Non-occupant Loans on < 5 Family Dwellings (A B C & D)
Number
Average Value
Number
Average Value
Number
Average Value
Number
Average Value
Number
Average Value
LOANS ORIGINATED
1
$199,240
34
$181,507
164
$175,204
17
$38,059
11
$153,396
APPLICATIONS APPROVED, NOT ACCEPTED
0
$0
5
$188,558
17
$181,477
1
$77,030
1
$245,450
APPLICATIONS DENIED
0
$0
2
$101,160
37
$160,295
4
$92,172
1
$112,970
APPLICATIONS WITHDRAWN
0
$0
3
$216,697
23
$211,339
0
$0
1
$534,040
FILES CLOSED FOR INCOMPLETENESS
0
$0
2
$249,560
6
$199,923
0
$0
0
$0
Aggregated Statistics For Year 2000 (Based on 2 partial tracts)
A) FHA, FSA/RHS & VA Home Purchase Loans
B) Conventional Home Purchase Loans
C) Refinancings
D) Home Improvement Loans
F) Non-occupant Loans on < 5 Family Dwellings (A B C & D)
Number
Average Value
Number
Average Value
Number
Average Value
Number
Average Value
Number
Average Value
LOANS ORIGINATED
3
$141,383
42
$166,130
44
$135,214
5
$50,734
2
$102,700
APPLICATIONS APPROVED, NOT ACCEPTED
0
$0
5
$132,484
12
$141,641
2
$51,350
1
$79,080
APPLICATIONS DENIED
0
$0
10
$124,575
15
$137,755
5
$90,992
3
$236,893
APPLICATIONS WITHDRAWN
0
$0
7
$138,791
8
$178,312
0
$0
0
$0
FILES CLOSED FOR INCOMPLETENESS
0
$0
0
$0
4
$98,335
0
$0
0
$0
Aggregated Statistics For Year 1999 (Based on 1 partial tract)
A) FHA, FSA/RHS & VA Home Purchase Loans
B) Conventional Home Purchase Loans
C) Refinancings
D) Home Improvement Loans
F) Non-occupant Loans on < 5 Family Dwellings (A B C & D)
Detailed PMIC statistics for the following Tracts:0219.01
2005 - 2018 National Fire Incident Reporting System (NFIRS) incidents
According to the data from the years 2005 - 2018 the average number of fires per year is 10. The highest number of reported fires - 19 took place in 2018, and the least - 1 in 2005. The data has an increasing trend.
When looking into fire subcategories, the most reports belonged to: Outside Fires (51.1%), and Mobile Property/Vehicle Fires (30.4%).
Fire incident types reported to NFIRS in Zip Code 95703

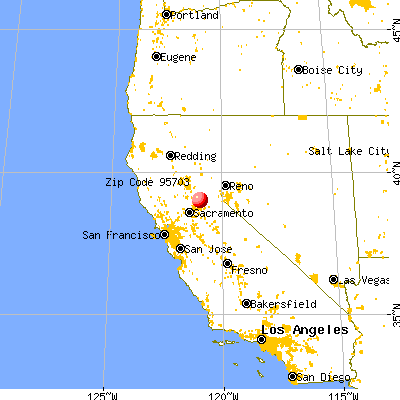


 Nearest zip codes: 95736, 95722, 95614, 95635, 95603, 95602.
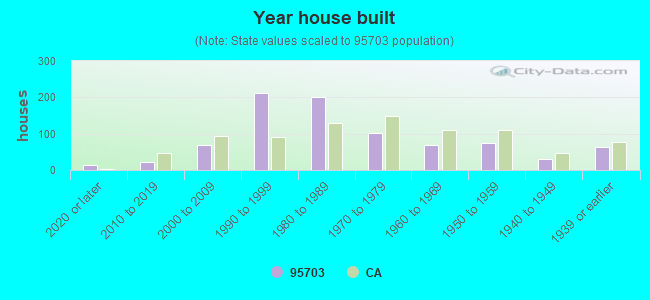


 According to the data from the years 2005 - 2018 the average number of fires per year is 10. The highest number of reported fires - 19 took place in 2018, and the least - 1 in 2005. The data has an increasing trend.
 When looking into fire subcategories, the most reports belonged to: Outside Fires (51.1%), and Mobile Property/Vehicle Fires (30.4%).