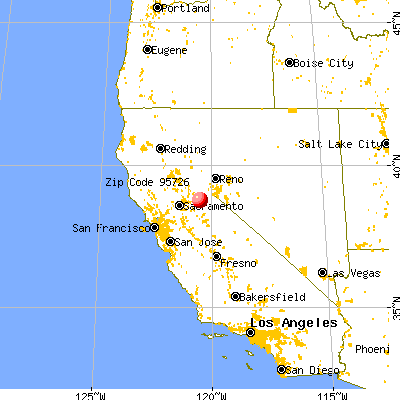
Estimated zip code population in 2022: 7,907 Zip code population in 2010: 8,842 Zip code population in 2000: 8,567
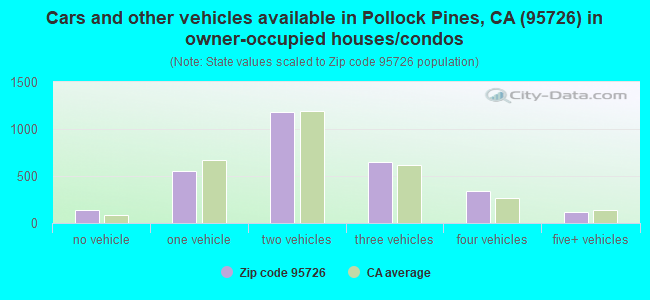
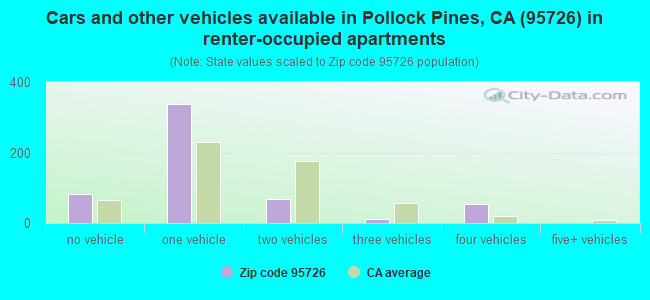
Houses and condos: 4,599 Renter-occupied apartments: 549
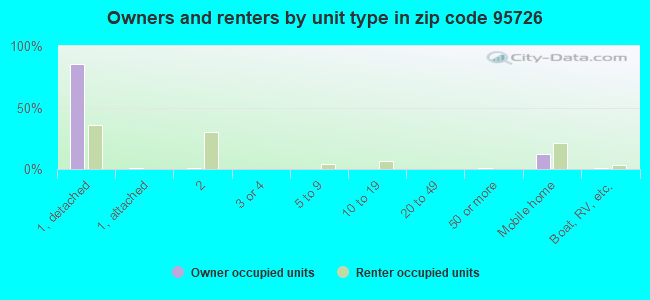
% of renters here:
16%
State:
44%
March 2022 cost of living index in zip code 95726: 98.8 (near average, U.S. average is 100)
Land area: 74.3 sq. mi. Water area: 0.8 sq. mi.
Population density: 106 people per square mile
(very low).
OSM Map
General Map
Google Map
MSN Map
OSM Map
General Map
Google Map
MSN Map
OSM Map
General Map
Google Map
MSN Map
OSM Map
General Map
Google Map
MSN Map
Please wait while loading the map...
Real estate property taxes paid for housing units in 2022:
This zip code:
0.7% ($2,830)
California:
0.7% ($4,831)
Median real estate property taxes paid for housing units with mortgages in 2022: $3,265 (0.7%) Median real estate property taxes paid for housing units with no mortgage in 2022: $2,042 (0.5%)
Business Search- 14 Million verified businesses
Males: 4,240
(53.6%)
Females: 3,666
(46.4%)
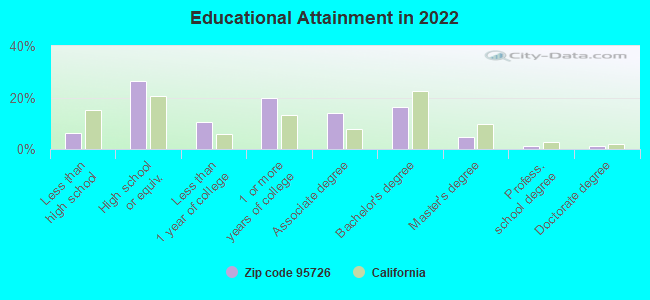
For population 25 years and over in 95726:
High school or higher: 93.3%
Bachelor's degree or higher: 23.2%
Graduate or professional degree: 6.9%
Unemployed: 5.0%
Mean travel time to work (commute): 35.7 minutes
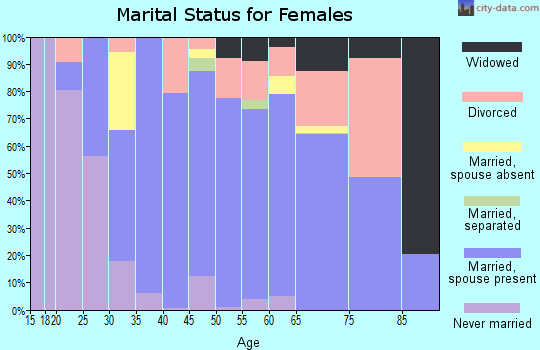
For population 15 years and over in 95726:
Never married: 24.0%
Now married: 55.7%
Separated: 4.9%
Widowed: 4.1%
Divorced: 11.3%
Zip code 95726 compared to state average:
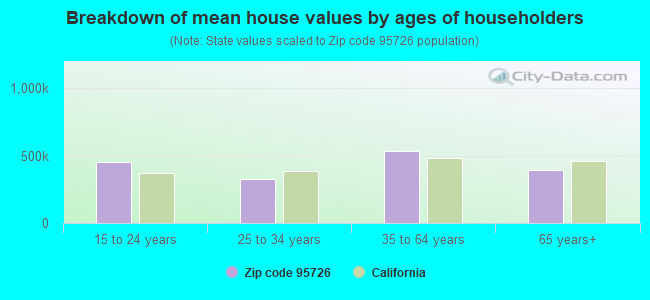
Median house value below state average.
Black race population percentage significantly below state average.
Hispanic race population percentage significantly below state average.
Median age significantly above state average.
Foreign-born population percentage significantly below state average.
Renting percentage significantly below state average.
Averages for the 2020 tax year for zip code 95726, filed in 2021:
Average Adjusted Gross Income (AGI) in 2020: $67,659 (Individual Income Tax Returns)
Here:
$67,659
State:
$95,910
Salary/wage: $59,224 (reported on 74.2% of returns)
Here:
$59,224
State:
$77,331
(% of AGI for various income ranges: 1055.1% for AGIs below $25k, 3839.5% for AGIs $25k-50k, 6361.0% for AGIs $50k-75k, 9771.3% for AGIs $75k-100k, 17683.9% for AGIs $100k-200k, 60637.5% for AGIs over 200k)
Taxable interest for individuals: $744 (reported on 43.4% of returns)
This zip code:
$744
California:
$2,294
(% of AGI for various income ranges: 24.7% for AGIs below $25k, 27.4% for AGIs $25k-50k, 44.4% for AGIs $50k-75k, 52.3% for AGIs $75k-100k, 95.4% for AGIs $100k-200k, 652.5% for AGIs over 200k)
Ordinary dividends: $4,117 (reported on 15.3% of returns)
Here:
$4,117
State:
$10,949
(% of AGI for various income ranges: 33.7% for AGIs below $25k, 48.5% for AGIs $25k-50k, 76.1% for AGIs $50k-75k, 114.7% for AGIs $75k-100k, 202.9% for AGIs $100k-200k, 1457.5% for AGIs over 200k)
Net capital gain/loss in AGI: +$17,217 (reported on 15.8% of returns)
Here:
+$17,217
State:
+$49,306
(% of AGI for various income ranges: 3.1% for AGIs below $25k, 51.8% for AGIs $25k-50k, 75.1% for AGIs $50k-75k, 201.7% for AGIs $75k-100k, 563.9% for AGIs $100k-200k, 19482.5% for AGIs over 200k)
Profit/loss from business: +$11,823 (reported on 14.3% of returns)
Here:
+$11,823
State:
+$15,671
(% of AGI for various income ranges: 66.8% for AGIs below $25k, 190.2% for AGIs $25k-50k, 326.6% for AGIs $50k-75k, 362.0% for AGIs $75k-100k, 343.7% for AGIs $100k-200k, 3900.0% for AGIs over 200k)
Taxable individual retirement arrangement distribution: $20,544 (reported on 10.3% of returns)
95726:
$20,544
California:
$23,505
(% of AGI for various income ranges: 81.5% for AGIs below $25k, 126.8% for AGIs $25k-50k, 279.5% for AGIs $50k-75k, 298.0% for AGIs $75k-100k, 885.9% for AGIs $100k-200k, 4350.0% for AGIs over 200k)
Total itemized deductions: $27,087 (reported on 12.9% of returns)
Here:
$27,087
State:
$39,517
(% of AGI for various income ranges: 80.5% for AGIs below $25k, 230.6% for AGIs $25k-50k, 633.9% for AGIs $50k-75k, 776.7% for AGIs $75k-100k, 1282.7% for AGIs $100k-200k, 5952.5% for AGIs over 200k)
Charity contributions: $4,030 (reported on 9.5% of returns)
Here:
$4,030
State:
$12,598
(% of AGI for various income ranges: 25.2% for AGIs $25k-50k, 38.0% for AGIs $50k-75k, 103.3% for AGIs $75k-100k, 138.5% for AGIs $100k-200k, 1055.0% for AGIs over 200k)
Taxes paid: $7,513 (reported on 12.9% of returns)
95726:
$7,513
State:
$8,807
(% of AGI for various income ranges: 16.0% for AGIs below $25k, 47.6% for AGIs $25k-50k, 152.4% for AGIs $50k-75k, 246.3% for AGIs $75k-100k, 408.0% for AGIs $100k-200k, 1500.0% for AGIs over 200k)
Earned income credit: $1,912 (reported on 11.5% of returns)
Here:
$1,912
State:
$2,074
(% of AGI for various income ranges: 69.9% for AGIs below $25k, 60.2% for AGIs $25k-50k)
Percentage of individuals using paid preparers for their 2020 taxes: 92.6%
Here:
93%
State:
92%
(% for various income ranges: 91.3% for AGIs below $25k, 92.6% for AGIs $25k-50k, 95.4% for AGIs $50k-75k, 92.0% for AGIs $75k-100k, 92.5% for AGIs $100k-200k, 92.9% for AGIs over 200k)
Averages for the 2012 tax year for zip code 95726, filed in 2013:
Average Adjusted Gross Income (AGI) in 2012: $54,856 (Individual Income Tax Returns)
Here:
$54,856
State:
$72,726
Salary/wage: $48,058 (reported on 75.0% of returns)
Here:
$48,058
State:
$59,079
(% of AGI for various income ranges: 57.1% for AGIs below $25k, 64.7% for AGIs $25k-50k, 65.4% for AGIs $50k-75k, 64.1% for AGIs $75k-100k, 73.6% for AGIs $100k-200k, 45.5% for AGIs over 200k)
Taxable interest for individuals: $639 (reported on 46.7% of returns)
This zip code:
$639
California:
$2,146
(% of AGI for various income ranges: 1.3% for AGIs below $25k, 0.8% for AGIs $25k-50k, 0.6% for AGIs $50k-75k, 0.7% for AGIs $75k-100k, 0.2% for AGIs $100k-200k, 0.3% for AGIs over 200k)
Ordinary dividends: $2,921 (reported on 19.4% of returns)
Here:
$2,921
State:
$9,308
(% of AGI for various income ranges: 2.4% for AGIs below $25k, 1.2% for AGIs $25k-50k, 0.9% for AGIs $50k-75k, 1.3% for AGIs $75k-100k, 0.8% for AGIs $100k-200k)
Net capital gain/loss in AGI: +$4,210 (reported on 17.2% of returns)
Here:
+$4,210
State:
+$30,460
(% of AGI for various income ranges: 0.5% for AGIs $50k-75k, 1.1% for AGIs $75k-100k, 0.8% for AGIs $100k-200k, 11.5% for AGIs over 200k)
Profit/loss from business: +$10,743 (reported on 16.7% of returns)
Here:
+$10,743
State:
+$17,064
(% of AGI for various income ranges: 10.3% for AGIs below $25k, 3.6% for AGIs $25k-50k, 2.8% for AGIs $50k-75k, 1.3% for AGIs $75k-100k, 3.7% for AGIs $100k-200k)
Taxable individual retirement arrangement distribution: $16,243 (reported on 12.2% of returns)
95726:
$16,243
California:
$19,557
(% of AGI for various income ranges: 3.8% for AGIs below $25k, 3.9% for AGIs $25k-50k, 3.0% for AGIs $50k-75k, 3.8% for AGIs $75k-100k, 4.5% for AGIs $100k-200k)
Total itemized deductions: $22,903 (27% of AGI, reported on 42.2% of returns)
Here:
$22,903
State:
$34,004
Here:
27.2% of AGI
State:
22.7% of AGI
(% of AGI for various income ranges: 20.0% for AGIs below $25k, 15.4% for AGIs $25k-50k, 16.7% for AGIs $50k-75k, 17.7% for AGIs $75k-100k, 18.6% for AGIs $100k-200k, 17.4% for AGIs over 200k)
Charity contributions: $2,069 (reported on 34.7% of returns)
Here:
$2,069
State:
$4,659
(% of AGI for various income ranges: 0.8% for AGIs below $25k, 1.0% for AGIs $25k-50k, 1.2% for AGIs $50k-75k, 1.4% for AGIs $75k-100k, 1.5% for AGIs $100k-200k, 1.2% for AGIs over 200k)
Taxes paid: $6,651 (reported on 42.2% of returns)
95726:
$6,651
State:
$14,448
(% of AGI for various income ranges: 3.0% for AGIs below $25k, 3.1% for AGIs $25k-50k, 4.1% for AGIs $50k-75k, 5.2% for AGIs $75k-100k, 6.7% for AGIs $100k-200k, 6.8% for AGIs over 200k)
Earned income credit: $1,946 (reported on 14.4% of returns)
Here:
$1,946
State:
$2,286
(% of AGI for various income ranges: 5.1% for AGIs below $25k, 1.0% for AGIs $25k-50k)
Percentage of individuals using paid preparers for their 2012 taxes: 54.7%
Here:
55%
State:
64%
(% for various income ranges: 49.2% for AGIs below $25k, 53.8% for AGIs $25k-50k, 57.4% for AGIs $50k-75k, 59.1% for AGIs $75k-100k, 62.0% for AGIs $100k-200k, 60.0% for AGIs over 200k)
Averages for the 2004 tax year for zip code 95726, filed in 2005:
Average Adjusted Gross Income (AGI) in 2004: $48,252 (Individual Income Tax Returns)
Here:
$48,252
State:
$58,600
Salary/wage: $43,782 (reported on 76.8% of returns)
Here:
$43,782
State:
$49,455
(% of AGI for various income ranges: 152.7% for AGIs below $10k, 60.7% for AGIs $10k-25k, 69.1% for AGIs $25k-50k, 73.5% for AGIs $50k-75k, 78.4% for AGIs $75k-100k, 60.3% for AGIs over 100k)
Taxable interest for individuals: $1,096 (reported on 58.2% of returns)
This zip code:
$1,096
California:
$2,365
(% of AGI for various income ranges: 10.2% for AGIs below $10k, 3.4% for AGIs $10k-25k, 1.4% for AGIs $25k-50k, 0.9% for AGIs $50k-75k, 1.0% for AGIs $75k-100k, 1.1% for AGIs over 100k)
Taxable dividends: $1,834 (reported on 23.4% of returns)
Here:
$1,834
State:
$4,746
(% of AGI for various income ranges: 10.8% for AGIs below $10k, 2.1% for AGIs $10k-25k, 0.7% for AGIs $25k-50k, 0.9% for AGIs $50k-75k, 0.6% for AGIs $75k-100k, 0.7% for AGIs over 100k)
Net capital gain/loss: +$12,208 (reported on 21.5% of returns)
Here:
+$12,208
State:
+$23,418
(% of AGI for various income ranges: -5.9% for AGIs below $10k, 0.5% for AGIs $10k-25k, 0.5% for AGIs $25k-50k, 1.0% for AGIs $50k-75k, 1.9% for AGIs $75k-100k, 17.0% for AGIs over 100k)
Profit/loss from business: +$13,478 (reported on 19.2% of returns)
Here:
+$13,478
State:
+$16,826
(% of AGI for various income ranges: -0.9% for AGIs below $10k, 7.4% for AGIs $10k-25k, 5.6% for AGIs $25k-50k, 4.2% for AGIs $50k-75k, 3.0% for AGIs $75k-100k, 7.7% for AGIs over 100k)
IRA payment deduction: $3,157 (reported on 2.7% of returns)
95726:
$3,157
California:
$3,192
(% of AGI for various income ranges: 0.2% for AGIs $10k-25k, 0.3% for AGIs $25k-50k, 0.2% for AGIs $50k-75k, 0.1% for AGIs $75k-100k, 0.1% for AGIs over 100k)
Self-employed pension: $11,596 (reported on 1.2% of returns)
Here:
$11,596
California:
$17,688
(% of AGI for various income ranges: 0.6% for AGIs $10k-25k, 0.3% for AGIs $50k-75k, 0.6% for AGIs over 100k)
Total itemized deductions: $19,334 (27% of AGI, reported on 50.7% of returns)
Here:
$19,334
State:
$28,113
Here:
27.5% of AGI
State:
25.3% of AGI
(% of AGI for various income ranges: 58.4% for AGIs below $10k, 20.9% for AGIs $10k-25k, 20.6% for AGIs $25k-50k, 21.9% for AGIs $50k-75k, 21.3% for AGIs $75k-100k, 16.9% for AGIs over 100k)
Charity contributions deductions: $1,806 (2% of AGI, reported on 43.5% of returns)
Here:
$1,806
State:
$3,923
Here:
2.5% of AGI
State:
3.3% of AGI
(% of AGI for various income ranges: 2.7% for AGIs below $10k, 1.0% for AGIs $10k-25k, 1.6% for AGIs $25k-50k, 1.9% for AGIs $50k-75k, 1.9% for AGIs $75k-100k, 1.3% for AGIs over 100k)
Total tax: $5,958 (reported on 81.2% of returns)
95726:
$5,958
State:
$10,761
(% of AGI for various income ranges: 7.7% for AGIs below $10k, 4.7% for AGIs $10k-25k, 6.6% for AGIs $25k-50k, 8.5% for AGIs $50k-75k, 9.7% for AGIs $75k-100k, 15.3% for AGIs over 100k)
Earned income credit: $1,468 (reported on 10.8% of returns)
Here:
$1,468
State:
$1,763
Percentage of individuals using paid preparers for their 2004 taxes: 61.8%
Here:
62%
State:
66%
(% for various income ranges: 51.3% for AGIs below $10k, 59.3% for AGIs $10k-25k, 64.9% for AGIs $25k-50k, 64.2% for AGIs $50k-75k, 66.3% for AGIs $75k-100k, 66.6% for AGIs over 100k)
Household received Food Stamps/SNAP in the past 12 months: 270 Household did not receive Food Stamps/SNAP in the past 12 months: 3,206
Women who had a birth in the past 12 months: 88 (60 now married, 28 unmarried) Women who did not have a birth in the past 12 months: 1,247 (765 now married, 470 unmarried)
Housing units in zip code 95726 with a mortgage: 1,904 (134 second mortgage, 26 home equity loan, 95 both second mortgage and home equity loan) Median monthly owner costs for units with a mortgage: $2,130 Median monthly owner costs for units without a mortgage: $715
Residents with income below the poverty level in 2022:
This zip code:
9.8%
Whole state:
12.2%
Residents with income below 50% of the poverty level in 2022:
This zip code:
4.7%
Whole state:
6.2%
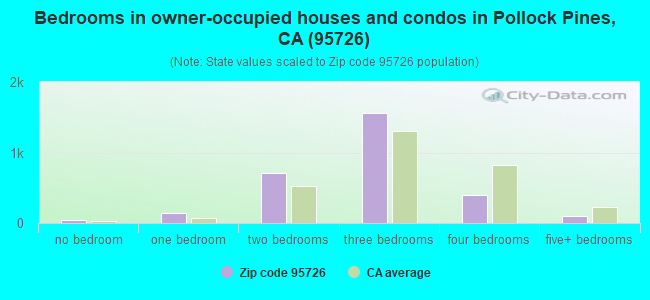
Median number of rooms in houses and condos:
Here:
5.7
State:
6.0
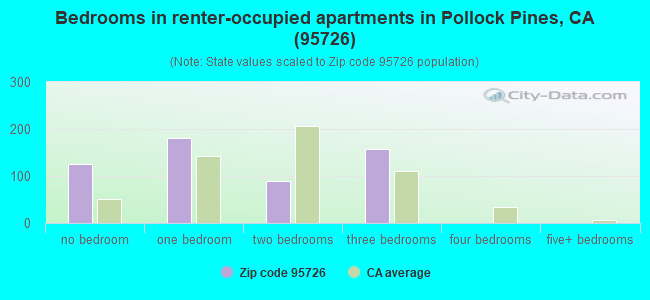
Median number of rooms in apartments:
Here:
3.1
State:
3.9
Notable locations in this zip code not listed on our city pages
Notable locations in zip code 95726: El Dorado Power House (A), Sly Park Guard Station (B), Sly Park Recreation Site (C), Ditch Camp Four (D), Blair Mill (E), Rice Cabin (F), Pacific Ranger Station (G), Indian Hatties (H), Morman Immigrant Trail Information Site (I), Sly Park Campground (J), Harris Tree Farm (K), Ghost Mountain Campground (L), Bridal Veil Campground (M), Pacific Ranger Station (N), Pollock Pines Branch El Dorado County Library (O), El Dorado County Fire Protection District Station 18 Sierra Springs (P), El Dorado County Fire Protection District Station 17 Pollock Pines (Q). Display/hide their locations on the map
Parks in zip code 95726 include: Bullion Bend Historic Marker (1), Pollock Pines Recreation Park (2), Sportsmans Hall State Historic Landmark 704 (3). Display/hide their locations on the map
719 married couples with children.
431 single-parent households (284 men, 147 women).
95.2% of residents of 95726 zip code speak English at home.
2.6% of residents speak Spanish at home (55% very well, 38% well, 6% not well).
1.1% of residents speak other Indo-European language at home (92% very well, 8% not well).
0.6% of residents speak Asian or Pacific Island language at home (73% very well, 27% well).
0.1% of residents speak other language at home (100% very well).
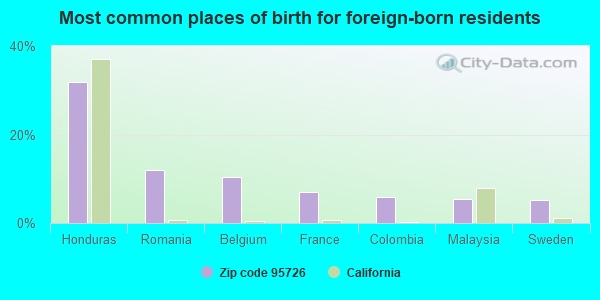
Foreign born population: 325 (4.1%) (44.2% of them are naturalized citizens)
This zip code:
4.1%
Whole state:
26.7%
32%Honduras
12%Romania
10%Belgium
7%France
6%Colombia
6%Malaysia
5%Sweden
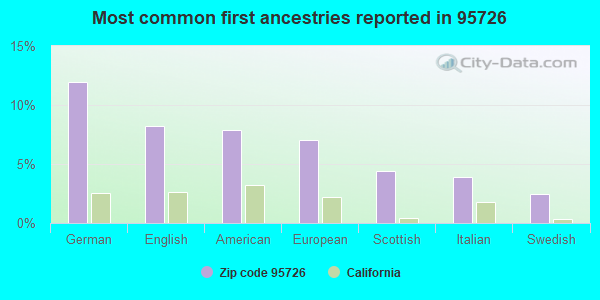
12%German
8%English
8%American
7%European
4%Scottish
4%Italian
2%Swedish
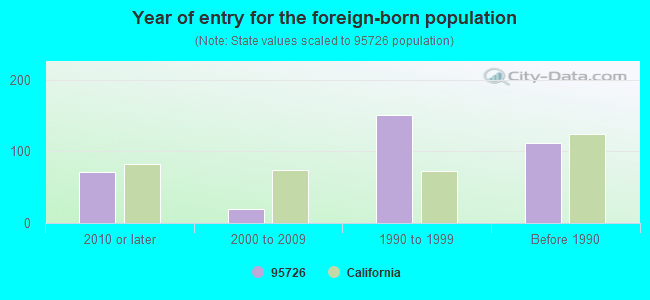
Year of entry for the foreign-born population
722010 or later
192000 to 2009
1511990 to 1999
112Before 1990
Facilities with environmental interests located in this zip code:
LONGS DRUG STORE NO 490 (6450 PONY EXPRESS TRAIL in POLLOCK PINES, CA)
STATE MASTER (California - Hazardous Waste Tracking) - HAZARDOU WASTE PROGRAM Small Quantity Generators, between 100 kg and 1000 kg of hazardous waste/month (Resource Conservation and Recovery Act (tracking hazardous waste)) - notification Organizations: LONGS DRUG STORES CAL (CONTACT/OWNER)
, PAYLESS DRUG (CONTACT/OWNER)
Alternative names: LONGS DRUG STORE #490
F E R C PROJ 184 MILL BULL TUNNEL (TUNNEL EXTENSION BETWEEN in POLLOCK PINES, CA) . Federal Facility
STATE MASTER (California - Hazardous Waste Tracking) - HAZARDOU WASTE PROGRAM Small Quantity Generators, between 100 kg and 1000 kg of hazardous waste/month (Resource Conservation and Recovery Act (tracking hazardous waste)) - notification Organizations: EL DORADO IRRIGATION DIST (CONTACT/OWNER)
EMIGRANT TRAIL ELEMENTARY (2701 AMBER TRAIL in POLLOCK PINES, CA)
(National Center for Education Statistics) - STATE ID-6112908 Organizations: POLLOCK PINES ELEMENTARY (SCHOOL DISTRICT)
AMER TELE & TELE CO UNION HILL (1.7 MI E OF in POLLOCK PINES, CA)
Small Quantity Generators, between 100 kg and 1000 kg of hazardous waste/month (Resource Conservation and Recovery Act (tracking hazardous waste))
FRESH POND #1 (E SIDE OLD CARSON RD .6 MI FR in POLLOCK PINES, CA)
CRITERIA AND HAZARDOUS AIR POLLUTANT INVENTORY (Inventory of air pollution sources) Business SIC classification: REFUSE SYSTEMS Business NAICS classification: SOLID WASTE LANDFILL.
CRITERIA AND HAZARDOUS AIR POLLUTANT INVENTORY (Inventory of air pollution sources) Business SIC classification: REFUSE SYSTEMS Business NAICS classification: SOLID WASTE LANDFILL.
Housing units lacking complete plumbing facilities: 0.4% Housing units lacking complete kitchen facilities: 1.0%
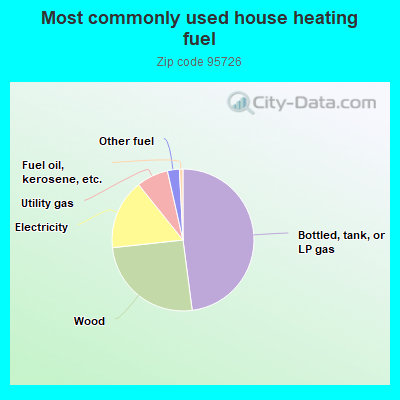
47.7%Bottled, tank, or LP gas
25.2%Wood
15.9%Electricity
7.2%Utility gas
2.7%Other fuel
0.8%Fuel oil, kerosene, etc.
Population in 1990: 7,722. Population change in the 1990s: +845 (+10.9%).
Place of birth for U.S.-born residents:
This state: 5,721
Northeast: 380
Midwest: 452
South: 344
West: 616
55% of the 95726 zip code residents lived in the same house 5 years ago. Out of people who lived in different houses, 46% lived in this county. Out of people who lived in different counties, 50% lived in California.
87% of the 95726 zip code residents lived in the same house 1 year ago. Out of people who lived in different houses, 41% moved from this county. Out of people who lived in different houses, 45% moved from different county within same state. Out of people who lived in different houses, 10% moved from different state. Out of people who lived in different houses, 4% moved from abroad.
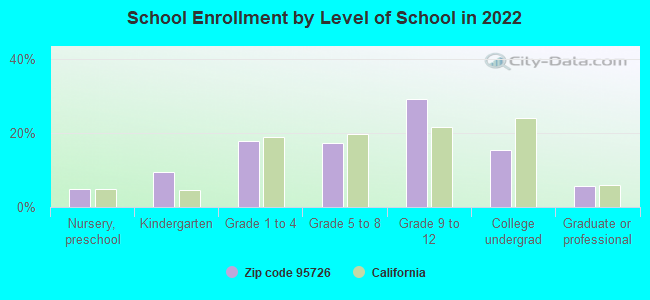
Private vs. public school enrollment:
Students in private schools in grades 1 to 8 (elementary and middle school): 32
Here:
7.0%
California:
10.5%
Students in private schools in grades 9 to 12 (high school): 38
Here:
9.9%
California:
8.5%
Students in private undergraduate colleges: 2
Here:
1.4%
California:
15.9%
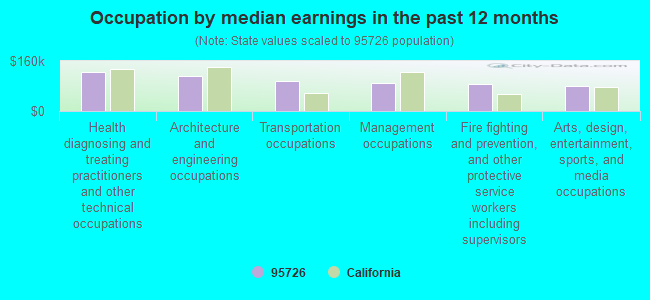
Occupation by median earnings in the past 12 months ($)
124,694Health diagnosing and treating practitioners and other technical occupations
112,679Architecture and engineering occupations
95,374Transportation occupations
89,856Management occupations
85,339Fire fighting and prevention, and other protective service workers including supervisors
80,318Arts, design, entertainment, sports, and media occupations
Companies with federal contracts located in this zip code:
ALTERNATIVE TECHNOLOGY & MGMT, (3035 RANDALL TRACT in POLLOCK PINES, CA; small business) : $1,364,877 in 35 contractsfrom 1999 to 2002
Contracts for Maintenance, Repair and Rebuilding of Equipment -- Railway Equipment, Landscaping/Groundskeeping Services by Navy, U.S. Army Corps of Engineers - civil program financing only Signed by year:2000: $793,350; 2001: $451,527; 2002: -$300,000; 2003: $0; 2004: $0; 2005: $0; 2006: $0.
Biggest contracts:
$420,000 with Navy for Maintenance, Repair and Rebuilding of Equipment -- Railway Equipment. Signed on 2000-10-04. Completion date: 2001-10-15.
$420,000, same as above.Signed on 1999-10-14. Completion date: 2000-10-15.
$373,350 with U.S. Army Corps of Engineers - civil program financing only for Landscaping/Groundskeeping Services. Signed on 2000-03-21. Completion date: 2001-03-17.
$300,000 with Navy for Maintenance, Repair and Rebuilding of Equipment -- Railway Equipment. Signed on 2001-10-10. Completion date: 2001-10-15.
R F SYSTEMS (5967 HEATH CT in POLLOCK PINES, CA; small business) : $187,861 in 5 contractsfrom 2001 to 2004
Contracts for Equipment and Materials Testing -- Communication, Detection, and Coherent Radiation Equipment by Navy Signed by year:2000: $0; 2001: $35,826; 2002: $37,556; 2003: $59,762; 2004: $54,717; 2005: $0; 2006: $0.
Biggest contracts:
$59,762 with Navy for Equipment and Materials Testing -- Communication, Detection, and Coherent Radiation Equipment. Signed on 2003-05-08. Completion date: 2003-09-30.
$54,717, same as above.Signed on 2004-04-07. Completion date: 2004-09-30.
$35,860 with Navy for Equipment and Materials Testing -- Communication, Detection, and Coherent Radiation Equipment. Taking place in TX. Signed on 2002-03-01. Completion date: 2002-12-31.
$35,826 with Navy for Equipment and Materials Testing -- Communication, Detection, and Coherent Radiation Equipment. Signed on 2001-06-14. Completion date: 2001-12-31.
Top industries in this zip code by the number of employees in 2005:
2005 - 2018 National Fire Incident Reporting System (NFIRS) incidents
Based on the data from the years 2005 - 2018 the average number of fire incidents per year is 30. The highest number of fires - 50 took place in 2008, and the least - 2 in 2006. The data has a growing trend.
When looking into fire subcategories, the most reports belonged to: Outside Fires (66.6%), and Structure Fires (20.5%).
Fire incident types reported to NFIRS in Zip Code 95726


 Nearest zip codes: 95709, 95636, 95684, 95667, 95720, 95634.


 Based on the data from the years 2005 - 2018 the average number of fire incidents per year is 30. The highest number of fires - 50 took place in 2008, and the least - 2 in 2006. The data has a growing trend.
 When looking into fire subcategories, the most reports belonged to: Outside Fires (66.6%), and Structure Fires (20.5%).