Estimated zip code population in 2022: 544 Zip code population in 2010: 386 Zip code population in 2000: 76
Houses and condos: 1,153 Renter-occupied apartments: 47
% of renters here:
21%
State:
44%
March 2022 cost of living index in zip code 95728: 101.1 (near average, U.S. average is 100)
Land area: 12.4 sq. mi. Water area: 0.2 sq. mi.
Population density: 44 people per square mile
(very low).
OSM Map
General Map
Google Map
MSN Map
OSM Map
General Map
Google Map
MSN Map
OSM Map
General Map
Google Map
MSN Map
OSM Map
General Map
Google Map
MSN Map
Please wait while loading the map...
Real estate property taxes paid for housing units in 2022:
This zip code:
0.6% ($6,030)
California:
0.7% ($4,831)
Median real estate property taxes paid for housing units with mortgages in 2022: $4,628 (0.5%) Median real estate property taxes paid for housing units with no mortgage in 2022: $7,308 (0.6%)
Business Search- 14 Million verified businesses
Males: 299
(55.0%)
Females: 245
(45.0%)
For population 25 years and over in 95728:
High school or higher: 98.5%
Bachelor's degree or higher: 68.2%
Graduate or professional degree: 37.9%
Unemployed: 9.2%
Mean travel time to work (commute): 26.1 minutes
For population 15 years and over in 95728:
Never married: 36.3%
Now married: 59.5%
Separated: 0.0%
Widowed: 2.4%
Divorced: 1.8%
Zip code 95728 compared to state average:
Unemployed percentage above state average.
Black race population percentage significantly below state average.
Hispanic race population percentage significantly below state average.
Median age significantly above state average.
Foreign-born population percentage significantly below state average.
Renting percentage below state average.
Length of stay since moving in above state average.
Number of college students below state average.
Percentage of population with a bachelor's degree or higher above state average.
Estimated median house/condo value in 2022: $998,329
95728:
$998,329
California:
$715,900
Median resident age:
This zip code:
49.0 years
California median age:
37.9 years
Average household size:
This zip code:
2.3 people
California:
2.8 people
Averages for the 2004 tax year for zip code 95728, filed in 2005:
Average Adjusted Gross Income (AGI) in 2004: $47,837 (Individual Income Tax Returns)
Here:
$47,837
State:
$58,600
Salary/wage: $37,040 (reported on 82.4% of returns)
Here:
$37,040
State:
$49,455
(% of AGI for various income ranges: 123.4% for AGIs below $10k, 77.1% for AGIs $10k-25k, 72.3% for AGIs $25k-50k, 87.5% for AGIs $50k-75k, 55.5% for AGIs $75k-100k, 51.3% for AGIs over 100k)
Taxable interest for individuals: $759 (reported on 47.3% of returns)
This zip code:
$759
California:
$2,365
(% of AGI for various income ranges: 4.7% for AGIs below $10k, 1.5% for AGIs $10k-25k, 0.6% for AGIs $25k-50k, 0.3% for AGIs $50k-75k, 0.2% for AGIs $75k-100k, 0.8% for AGIs over 100k)
Taxable dividends: $1,457 (reported on 28.6% of returns)
Here:
$1,457
State:
$4,746
(% of AGI for various income ranges: 0.6% for AGIs below $10k, 1.2% for AGIs $10k-25k, 0.5% for AGIs $25k-50k, 0.8% for AGIs $50k-75k, 1.2% for AGIs over 100k)
Net capital gain/loss: +$12,300 (reported on 20.4% of returns)
Here:
+$12,300
State:
+$23,418
(% of AGI for various income ranges: -10.5% for AGIs below $10k, 0.1% for AGIs $25k-50k, 3.1% for AGIs $50k-75k, 10.8% for AGIs over 100k)
Profit/loss from business: +$8,228 (reported on 23.3% of returns)
Here:
+$8,228
State:
+$16,826
(% of AGI for various income ranges: 10.5% for AGIs $10k-25k, 8.6% for AGIs $25k-50k, 3.2% for AGIs $50k-75k, 2.1% for AGIs over 100k)
Total itemized deductions: $20,313 (25% of AGI, reported on 40.4% of returns)
Here:
$20,313
State:
$28,113
Here:
24.6% of AGI
State:
25.3% of AGI
(% of AGI for various income ranges: 28.2% for AGIs $10k-25k, 16.2% for AGIs $25k-50k, 17.2% for AGIs $50k-75k, 18.2% for AGIs $75k-100k, 15.8% for AGIs over 100k)
Charity contributions deductions: $1,169 (1% of AGI, reported on 29.0% of returns)
Here:
$1,169
State:
$3,923
Here:
1.3% of AGI
State:
3.3% of AGI
(% of AGI for various income ranges: 2.3% for AGIs below $10k, 0.5% for AGIs $25k-50k, 0.7% for AGIs $50k-75k, 1.1% for AGIs over 100k)
Total tax: $7,799 (reported on 83.3% of returns)
95728:
$7,799
State:
$10,761
(% of AGI for various income ranges: 3.5% for AGIs below $10k, 5.4% for AGIs $10k-25k, 9.8% for AGIs $25k-50k, 9.9% for AGIs $50k-75k, 11.5% for AGIs $75k-100k, 18.6% for AGIs over 100k)
Earned income credit: $800 (reported on 10.2% of returns)
Here:
$800
State:
$1,763
Percentage of individuals using paid preparers for their 2004 taxes: 50.2%
Here:
50%
State:
66%
(% for various income ranges: 40.4% for AGIs below $10k, 46.9% for AGIs $10k-25k, 41.5% for AGIs $25k-50k, 62.5% for AGIs $50k-75k, 86.7% for AGIs $75k-100k, 63.3% for AGIs over 100k)
Household received Food Stamps/SNAP in the past 12 months: 11 Household did not receive Food Stamps/SNAP in the past 12 months: 207
Women who did not have a birth in the past 12 months: 133 (71 now married, 61 unmarried)
Housing units in zip code 95728 with a mortgage: 87 (11 second mortgage) Median monthly owner costs for units with a mortgage: $3,398 Median monthly owner costs for units without a mortgage: $1,518
Residents with income below the poverty level in 2022:
This zip code:
4.2%
Whole state:
12.2%
Median number of rooms in houses and condos:
Here:
6.5
State:
6.0
Median number of rooms in apartments:
Here:
5.7
State:
3.9
Notable locations in this zip code not listed on our city pages
Notable locations in zip code 95728: Camp Pahatsi (A), Van Norden Campground (B), Deer Park Recreation Site (C), Soda Springs Ski Area (D), Donner Summit Ski Area (E), Boreal Ridge Ski Area (F), Truckee Fire Protection District Station 98 Serene Lakes (G). Display/hide their locations on the map
Lakes and reservoirs: Flora Lake (A), Ice Lakes (B), Azalea Lake (C), Crater Lake (D), Kilborn Lake (E), Lytton Lake (F), Serena Lake (G), Dulzura Lake (H). Display/hide their locations on the map
In group quarters: 27 (-1 institutionalized population)
Size of family households: 110 2-persons, 44 4-persons
Size of nonfamily households: 68 1-person
95 married couples with children.
8 single-parent households (8 women).
83.5% of residents of 95728 zip code speak English at home.
5.7% of residents speak Spanish at home (100% very well).
8.2% of residents speak other Indo-European language at home (100% very well).
2.0% of residents speak Asian or Pacific Island language at home (100% well).
Foreign born population: 55 (10.1%) (80.3% of them are naturalized citizens)
This zip code:
10.1%
Whole state:
26.7%
22%Chile
20%Singapore
19%Greece
15%Austria
30%English
20%American
14%Irish
10%Finnish
4%Italian
4%Belgian
3%Swiss
Year of entry for the foreign-born population
122010 or later
202000 to 2009
221990 to 1999
0Before 1990
Facilities with environmental interests located in this zip code:
NYACO INC (53102 DONNER PASS RD in SODA SPRINGS, CA)
STATE MASTER (California - Hazardous Waste Tracking) - HAZARDOU WASTE PROGRAM TRANSPORTER (Resource Conservation and Recovery Act (tracking hazardous waste)) Organizations: STEWART WELLS (CONTACT/OWNER)
CALTRANS KINGVALE MAINTENANCE FACILITY (51121 DONNER PASS RD in SODA SPRINGS, CA)
Small Quantity Generators, between 100 kg and 1000 kg of hazardous waste/month (Resource Conservation and Recovery Act (tracking hazardous waste)) Organizations: STATE OF CALIFORNIA (CONTACT/OPERATOR)
AMER TELE & TELE CO CISCO BUTTE (3 MI FR SNOW CAT GARAGE NR in CISCO, CA)
Small Quantity Generators, between 100 kg and 1000 kg of hazardous waste/month (Resource Conservation and Recovery Act (tracking hazardous waste))
64.5%Bottled, tank, or LP gas
22.1%Electricity
9.7%Utility gas
4.6%Wood
Population in 1990: 96.
Place of birth for U.S.-born residents:
This state: 349
Northeast: 54
Midwest: 25
South: 10
West: 47
100% of the 95728 zip code residents lived in the same house 5 years ago.
94% of the 95728 zip code residents lived in the same house 1 year ago. Out of people who lived in different houses, 45% moved from different county within same state. Out of people who lived in different houses, 68% moved from abroad.
Private vs. public school enrollment:
Students in private schools in grades 1 to 8 (elementary and middle school):
Here:
0.0%
California:
10.5%
Students in private schools in grades 9 to 12 (high school): 10
Here:
17.2%
California:
8.5%
Students in private undergraduate colleges: 8
Here:
66.0%
California:
15.9%
Occupation by median earnings in the past 12 months ($)
95,529Fire fighting and prevention, and other protective service workers including supervisors
56,700Management occupations
27,841Sales and related occupations
Top industries in this zip code by the number of employees in 2005:
Accommodation and Food Services: Hotels (except Casino Hotels) and Motels (50-99 employees: 1 establishment, 20-49 employees: 1 establishment)
Arts, Entertainment, and Recreation: Skiing Facilities (20-49: 1, 5-9: 1)
Accommodation and Food Services: Bed-and-Breakfast Inns (20-49: 1)
Accommodation and Food Services: Full-Service Restaurants (10-19: 1, 5-9: 1)
Construction: New Single-Family Housing Construction (except Operative Builders) (5-9: 1, 1-4: 3)
Real Estate and Rental and Leasing: Residential Property Managers (5-9: 1, 1-4: 1)
Fatal accident statistics in 2013:
Fatal accident count: 1
Vehicles involved in fatal accidents: 1
Fatal accidents caused by drunken drivers: 0
Fatalities: 1
Persons involved in fatal accidents: 2
Pedestrians involved in fatal accidents: 0
Home Mortgage Disclosure Act Aggregated Statistics For Year 2009 (Based on 2 partial tracts)
A) FHA, FSA/RHS & VA Home Purchase Loans
B) Conventional Home Purchase Loans
C) Refinancings
D) Home Improvement Loans
F) Non-occupant Loans on < 5 Family Dwellings (A B C & D)
G) Loans On Manufactured Home Dwelling (A B C & D)
Number
Average Value
Number
Average Value
Number
Average Value
Number
Average Value
Number
Average Value
Number
Average Value
LOANS ORIGINATED
2
$187,690
12
$477,533
46
$362,823
1
$402,400
37
$431,824
1
$204,620
APPLICATIONS APPROVED, NOT ACCEPTED
0
$0
1
$820,120
3
$434,767
0
$0
3
$470,650
0
$0
APPLICATIONS DENIED
1
$194,070
2
$251,140
18
$387,395
1
$128,300
11
$380,627
0
$0
APPLICATIONS WITHDRAWN
1
$141,400
1
$311,920
8
$414,671
0
$0
4
$448,950
0
$0
FILES CLOSED FOR INCOMPLETENESS
0
$0
0
$0
2
$383,900
0
$0
1
$420,960
0
$0
Aggregated Statistics For Year 2008 (Based on 2 partial tracts)
A) FHA, FSA/RHS & VA Home Purchase Loans
B) Conventional Home Purchase Loans
C) Refinancings
D) Home Improvement Loans
F) Non-occupant Loans on < 5 Family Dwellings (A B C & D)
G) Loans On Manufactured Home Dwelling (A B C & D)
Number
Average Value
Number
Average Value
Number
Average Value
Number
Average Value
Number
Average Value
Number
Average Value
LOANS ORIGINATED
1
$266,100
15
$596,874
22
$408,921
2
$264,770
23
$528,758
0
$0
APPLICATIONS APPROVED, NOT ACCEPTED
0
$0
3
$613,330
4
$411,308
0
$0
4
$520,202
0
$0
APPLICATIONS DENIED
1
$197,550
5
$535,062
12
$447,451
1
$259,260
7
$566,146
1
$175,970
APPLICATIONS WITHDRAWN
0
$0
1
$797,620
6
$360,663
0
$0
3
$369,887
0
$0
FILES CLOSED FOR INCOMPLETENESS
0
$0
1
$462,380
1
$707,720
0
$0
1
$659,460
0
$0
Aggregated Statistics For Year 2007 (Based on 2 partial tracts)
B) Conventional Home Purchase Loans
C) Refinancings
D) Home Improvement Loans
F) Non-occupant Loans on < 5 Family Dwellings (A B C & D)
G) Loans On Manufactured Home Dwelling (A B C & D)
Number
Average Value
Number
Average Value
Number
Average Value
Number
Average Value
Number
Average Value
LOANS ORIGINATED
26
$587,558
36
$483,340
4
$357,830
38
$592,983
1
$208,220
APPLICATIONS APPROVED, NOT ACCEPTED
5
$522,116
8
$512,995
1
$330,830
7
$639,044
1
$175,970
APPLICATIONS DENIED
9
$508,299
16
$463,645
3
$263,360
11
$573,377
2
$189,835
APPLICATIONS WITHDRAWN
2
$697,855
5
$402,312
1
$435,350
3
$566,777
0
$0
FILES CLOSED FOR INCOMPLETENESS
0
$0
2
$655,920
0
$0
1
$867,450
0
$0
Aggregated Statistics For Year 2006 (Based on 2 partial tracts)
B) Conventional Home Purchase Loans
C) Refinancings
D) Home Improvement Loans
F) Non-occupant Loans on < 5 Family Dwellings (A B C & D)
G) Loans On Manufactured Home Dwelling (A B C & D)
Number
Average Value
Number
Average Value
Number
Average Value
Number
Average Value
Number
Average Value
LOANS ORIGINATED
32
$547,821
45
$431,927
6
$373,830
41
$560,843
1
$282,000
APPLICATIONS APPROVED, NOT ACCEPTED
5
$425,048
7
$350,353
1
$176,200
5
$422,356
0
$0
APPLICATIONS DENIED
9
$594,410
15
$352,215
3
$150,917
9
$581,908
2
$184,905
APPLICATIONS WITHDRAWN
4
$535,862
8
$442,555
1
$232,350
5
$649,600
0
$0
FILES CLOSED FOR INCOMPLETENESS
1
$760,500
2
$371,955
0
$0
2
$459,360
0
$0
Aggregated Statistics For Year 2005 (Based on 2 partial tracts)
B) Conventional Home Purchase Loans
C) Refinancings
D) Home Improvement Loans
F) Non-occupant Loans on < 5 Family Dwellings (A B C & D)
G) Loans On Manufactured Home Dwelling (A B C & D)
Number
Average Value
Number
Average Value
Number
Average Value
Number
Average Value
Number
Average Value
LOANS ORIGINATED
50
$507,034
55
$384,072
7
$248,223
58
$490,628
1
$301,720
APPLICATIONS APPROVED, NOT ACCEPTED
6
$413,792
7
$409,829
0
$0
7
$470,016
0
$0
APPLICATIONS DENIED
13
$520,697
15
$332,943
2
$94,890
13
$534,832
1
$247,200
APPLICATIONS WITHDRAWN
6
$561,982
12
$386,406
1
$246,500
6
$599,817
0
$0
FILES CLOSED FOR INCOMPLETENESS
1
$333,620
3
$421,157
0
$0
2
$425,835
0
$0
Aggregated Statistics For Year 2004 (Based on 2 partial tracts)
B) Conventional Home Purchase Loans
C) Refinancings
D) Home Improvement Loans
F) Non-occupant Loans on < 5 Family Dwellings (A B C & D)
G) Loans On Manufactured Home Dwelling (A B C & D)
Number
Average Value
Number
Average Value
Number
Average Value
Number
Average Value
Number
Average Value
LOANS ORIGINATED
37
$440,324
55
$331,895
4
$324,858
50
$412,800
1
$185,480
APPLICATIONS APPROVED, NOT ACCEPTED
6
$421,312
7
$293,696
1
$64,030
4
$404,028
1
$80,740
APPLICATIONS DENIED
9
$326,360
14
$314,070
2
$88,565
5
$494,206
1
$217,500
APPLICATIONS WITHDRAWN
5
$333,894
9
$294,524
1
$125,160
3
$570,023
1
$163,910
FILES CLOSED FOR INCOMPLETENESS
2
$292,900
3
$294,213
0
$0
2
$318,190
0
$0
Aggregated Statistics For Year 2003 (Based on 2 partial tracts)
B) Conventional Home Purchase Loans
C) Refinancings
D) Home Improvement Loans
F) Non-occupant Loans on < 5 Family Dwellings (A B C & D)
Number
Average Value
Number
Average Value
Number
Average Value
Number
Average Value
LOANS ORIGINATED
32
$341,040
131
$278,569
2
$69,485
83
$325,732
APPLICATIONS APPROVED, NOT ACCEPTED
5
$350,854
14
$267,049
0
$0
8
$385,439
APPLICATIONS DENIED
6
$414,913
26
$279,654
3
$54,790
11
$372,065
APPLICATIONS WITHDRAWN
6
$370,658
19
$260,121
1
$30,620
7
$375,989
FILES CLOSED FOR INCOMPLETENESS
1
$345,680
3
$252,570
0
$0
2
$269,235
Aggregated Statistics For Year 2002 (Based on 2 partial tracts)
B) Conventional Home Purchase Loans
C) Refinancings
D) Home Improvement Loans
F) Non-occupant Loans on < 5 Family Dwellings (A B C & D)
Number
Average Value
Number
Average Value
Number
Average Value
Number
Average Value
LOANS ORIGINATED
31
$311,127
93
$287,747
2
$68,730
61
$339,372
APPLICATIONS APPROVED, NOT ACCEPTED
3
$220,827
11
$264,744
0
$0
5
$285,128
APPLICATIONS DENIED
4
$242,932
11
$376,620
1
$25,870
4
$397,620
APPLICATIONS WITHDRAWN
3
$403,680
12
$235,654
1
$32,250
5
$299,420
FILES CLOSED FOR INCOMPLETENESS
1
$188,960
2
$237,685
0
$0
1
$287,220
Aggregated Statistics For Year 2001 (Based on 2 partial tracts)
A) FHA, FSA/RHS & VA Home Purchase Loans
B) Conventional Home Purchase Loans
C) Refinancings
D) Home Improvement Loans
F) Non-occupant Loans on < 5 Family Dwellings (A B C & D)
Number
Average Value
Number
Average Value
Number
Average Value
Number
Average Value
Number
Average Value
LOANS ORIGINATED
1
$141,870
21
$321,165
63
$255,307
3
$62,523
35
$309,233
APPLICATIONS APPROVED, NOT ACCEPTED
0
$0
2
$267,845
8
$285,476
0
$0
3
$305,273
APPLICATIONS DENIED
0
$0
3
$229,217
11
$255,347
2
$61,945
3
$412,650
APPLICATIONS WITHDRAWN
0
$0
3
$267,457
6
$239,270
1
$26,800
3
$306,317
FILES CLOSED FOR INCOMPLETENESS
0
$0
0
$0
3
$243,600
0
$0
1
$415,160
Aggregated Statistics For Year 2000 (Based on 2 partial tracts)
A) FHA, FSA/RHS & VA Home Purchase Loans
B) Conventional Home Purchase Loans
C) Refinancings
D) Home Improvement Loans
F) Non-occupant Loans on < 5 Family Dwellings (A B C & D)
Number
Average Value
Number
Average Value
Number
Average Value
Number
Average Value
Number
Average Value
LOANS ORIGINATED
2
$104,170
26
$288,434
18
$247,196
3
$59,007
16
$287,035
APPLICATIONS APPROVED, NOT ACCEPTED
0
$0
3
$190,123
4
$307,778
0
$0
2
$361,340
APPLICATIONS DENIED
0
$0
5
$246,384
5
$198,778
2
$41,760
3
$330,793
APPLICATIONS WITHDRAWN
0
$0
3
$256,167
3
$172,220
0
$0
1
$305,780
FILES CLOSED FOR INCOMPLETENESS
0
$0
0
$0
2
$195,285
0
$0
1
$284,780
Aggregated Statistics For Year 1999 (Based on 1 partial tract)
A) FHA, FSA/RHS & VA Home Purchase Loans
B) Conventional Home Purchase Loans
C) Refinancings
D) Home Improvement Loans
F) Non-occupant Loans on < 5 Family Dwellings (A B C & D)

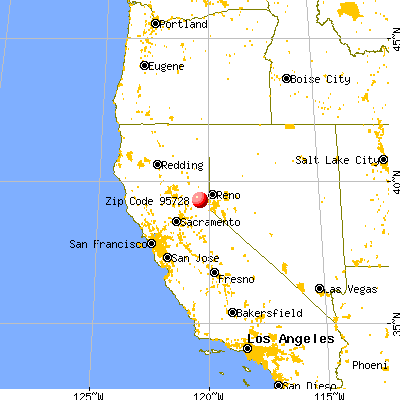


 Nearest zip codes: 95724, 96161, 96146, 96126, 95715, 96145.


