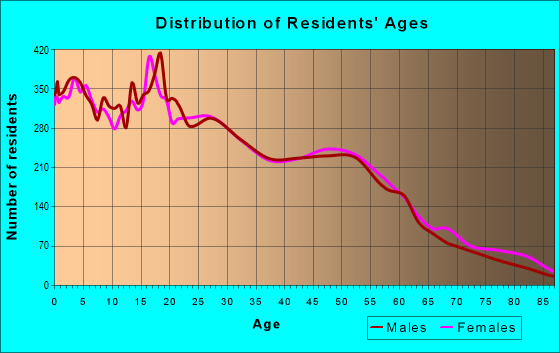
Estimated zip code population in 2022: 40,968 Zip code population in 2010: 36,764 Zip code population in 2000: 34,879
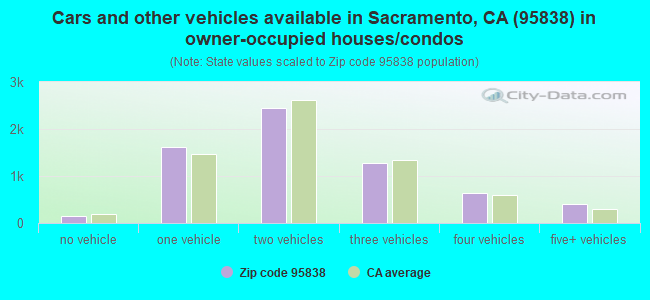
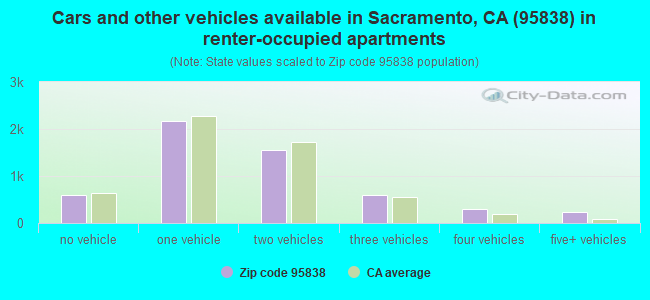
Houses and condos: 12,421 Renter-occupied apartments: 5,456
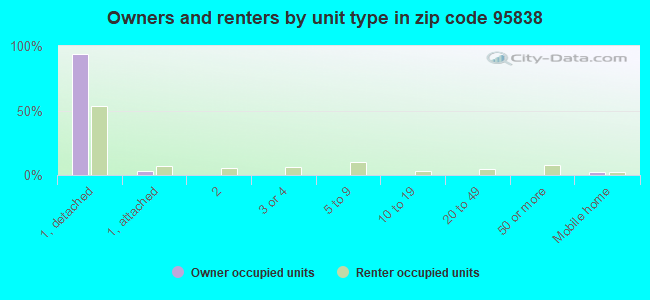
% of renters here:
46%
State:
44%
March 2022 cost of living index in zip code 95838: 101.3 (near average, U.S. average is 100)
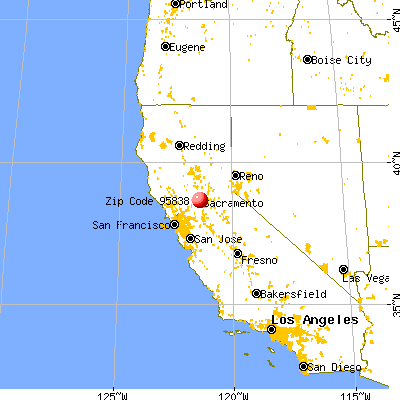
Land area: 9.1 sq. mi. Water area: 0.0 sq. mi.
Population density: 4,517 people per square mile
(average).
OSM Map
General Map
Google Map
MSN Map
OSM Map
General Map
Google Map
MSN Map
OSM Map
General Map
Google Map
MSN Map
OSM Map
General Map
Google Map
MSN Map
Please wait while loading the map...
Real estate property taxes paid for housing units in 2022:
This zip code:
0.7% ($2,516)
California:
0.7% ($4,831)
Median real estate property taxes paid for housing units with mortgages in 2022: $2,607 (0.7%) Median real estate property taxes paid for housing units with no mortgage in 2022: $1,740 (0.5%)
Averages for the 2020 tax year for zip code 95838, filed in 2021:
Average Adjusted Gross Income (AGI) in 2020: $41,623 (Individual Income Tax Returns)
Here:
$41,623
State:
$95,910
Salary/wage: $39,107 (reported on 87.0% of returns)
Here:
$39,107
State:
$77,331
(% of AGI for various income ranges: 1249.5% for AGIs below $25k, 4006.9% for AGIs $25k-50k, 7437.7% for AGIs $50k-75k, 10784.0% for AGIs $75k-100k, 18846.8% for AGIs $100k-200k, 72715.0% for AGIs over 200k)
Taxable interest for individuals: $200 (reported on 21.0% of returns)
This zip code:
$200
California:
$2,294
(% of AGI for various income ranges: 2.0% for AGIs below $25k, 4.2% for AGIs $25k-50k, 6.8% for AGIs $50k-75k, 14.5% for AGIs $75k-100k, 21.2% for AGIs $100k-200k, 395.0% for AGIs over 200k)
Ordinary dividends: $1,534 (reported on 3.8% of returns)
Here:
$1,534
State:
$10,949
(% of AGI for various income ranges: 1.0% for AGIs below $25k, 4.2% for AGIs $25k-50k, 21.1% for AGIs $50k-75k, 25.2% for AGIs $75k-100k, 19.6% for AGIs $100k-200k, 275.0% for AGIs over 200k)
Net capital gain/loss in AGI: +$3,200 (reported on 5.5% of returns)
Here:
+$3,200
State:
+$49,306
(% of AGI for various income ranges: 21.1% for AGIs $50k-75k, 46.1% for AGIs $75k-100k, 209.5% for AGIs $100k-200k, 6025.0% for AGIs over 200k)
Profit/loss from business: +$7,916 (reported on 14.3% of returns)
Here:
+$7,916
State:
+$15,671
(% of AGI for various income ranges: 116.9% for AGIs below $25k, 129.2% for AGIs $25k-50k, 190.0% for AGIs $50k-75k, 239.7% for AGIs $75k-100k, 467.7% for AGIs $100k-200k)
Taxable individual retirement arrangement distribution: $12,272 (reported on 1.6% of returns)
95838:
$12,272
California:
$23,505
(% of AGI for various income ranges: 7.9% for AGIs below $25k, 15.6% for AGIs $25k-50k, 34.6% for AGIs $50k-75k, 81.0% for AGIs $75k-100k, 174.6% for AGIs $100k-200k)
Total itemized deductions: $24,360 (reported on 6.1% of returns)
Here:
$24,360
State:
$39,517
(% of AGI for various income ranges: 24.6% for AGIs below $25k, 102.5% for AGIs $25k-50k, 359.6% for AGIs $50k-75k, 635.1% for AGIs $75k-100k, 1163.5% for AGIs $100k-200k, 7765.0% for AGIs over 200k)
Charity contributions: $5,170 (reported on 4.2% of returns)
Here:
$5,170
State:
$12,598
(% of AGI for various income ranges: 2.7% for AGIs below $25k, 11.9% for AGIs $25k-50k, 45.7% for AGIs $50k-75k, 98.5% for AGIs $75k-100k, 214.7% for AGIs $100k-200k, 1245.0% for AGIs over 200k)
Taxes paid: $6,968 (reported on 6.1% of returns)
95838:
$6,968
State:
$8,807
(% of AGI for various income ranges: 5.5% for AGIs below $25k, 26.3% for AGIs $25k-50k, 106.7% for AGIs $50k-75k, 191.1% for AGIs $75k-100k, 360.5% for AGIs $100k-200k, 1370.0% for AGIs over 200k)
Earned income credit: $2,417 (reported on 25.7% of returns)
Here:
$2,417
State:
$2,074
(% of AGI for various income ranges: 130.3% for AGIs below $25k, 99.5% for AGIs $25k-50k, 2.3% for AGIs $50k-75k)
Percentage of individuals using paid preparers for their 2020 taxes: 91.6%
Here:
92%
State:
92%
(% for various income ranges: 91.3% for AGIs below $25k, 92.5% for AGIs $25k-50k, 91.6% for AGIs $50k-75k, 90.8% for AGIs $75k-100k, 90.3% for AGIs $100k-200k, 88.9% for AGIs over 200k)
Averages for the 2012 tax year for zip code 95838, filed in 2013:
Average Adjusted Gross Income (AGI) in 2012: $30,602 (Individual Income Tax Returns)
Here:
$30,602
State:
$72,726
Salary/wage: $28,934 (reported on 87.0% of returns)
Here:
$28,934
State:
$59,079
(% of AGI for various income ranges: 76.8% for AGIs below $25k, 87.1% for AGIs $25k-50k, 83.3% for AGIs $50k-75k, 84.9% for AGIs $75k-100k, 86.1% for AGIs $100k-200k)
Taxable interest for individuals: $316 (reported on 18.5% of returns)
This zip code:
$316
California:
$2,146
(% of AGI for various income ranges: 0.1% for AGIs below $25k, 0.2% for AGIs $25k-50k, 0.2% for AGIs $50k-75k, 0.2% for AGIs $75k-100k, 0.6% for AGIs $100k-200k)
Ordinary dividends: $1,176 (reported on 3.6% of returns)
Here:
$1,176
State:
$9,308
(% of AGI for various income ranges: 0.1% for AGIs below $25k, 0.1% for AGIs $25k-50k, 0.1% for AGIs $50k-75k, 0.5% for AGIs $100k-200k)
Net capital gain/loss in AGI: +$966 (reported on 2.3% of returns)
Here:
+$966
State:
+$30,460
(% of AGI for various income ranges: 0.1% for AGIs $75k-100k, 0.6% for AGIs $100k-200k)
Profit/loss from business: +$8,801 (reported on 14.7% of returns)
Here:
+$8,801
State:
+$17,064
(% of AGI for various income ranges: 11.9% for AGIs below $25k, 2.8% for AGIs $25k-50k, 1.7% for AGIs $50k-75k, 1.3% for AGIs $75k-100k, 0.5% for AGIs $100k-200k)
Taxable individual retirement arrangement distribution: $9,776 (reported on 2.5% of returns)
95838:
$9,776
California:
$19,557
(% of AGI for various income ranges: 0.4% for AGIs below $25k, 0.6% for AGIs $25k-50k, 0.9% for AGIs $50k-75k, 1.1% for AGIs $75k-100k, 2.1% for AGIs $100k-200k)
Total itemized deductions: $17,436 (29% of AGI, reported on 18.1% of returns)
Here:
$17,436
State:
$34,004
Here:
29.3% of AGI
State:
22.7% of AGI
(% of AGI for various income ranges: 4.0% for AGIs below $25k, 9.3% for AGIs $25k-50k, 13.4% for AGIs $50k-75k, 14.8% for AGIs $75k-100k, 19.7% for AGIs $100k-200k)
Charity contributions: $2,546 (reported on 13.6% of returns)
Here:
$2,546
State:
$4,659
(% of AGI for various income ranges: 0.3% for AGIs below $25k, 0.9% for AGIs $25k-50k, 1.5% for AGIs $50k-75k, 1.7% for AGIs $75k-100k, 2.7% for AGIs $100k-200k)
Taxes paid: $4,424 (reported on 18.1% of returns)
95838:
$4,424
State:
$14,448
(% of AGI for various income ranges: 0.8% for AGIs below $25k, 2.0% for AGIs $25k-50k, 3.2% for AGIs $50k-75k, 4.2% for AGIs $75k-100k, 6.6% for AGIs $100k-200k)
Earned income credit: $2,725 (reported on 38.0% of returns)
Here:
$2,725
State:
$2,286
(% of AGI for various income ranges: 11.6% for AGIs below $25k, 2.1% for AGIs $25k-50k)
Percentage of individuals using paid preparers for their 2012 taxes: 56.9%
Here:
57%
State:
64%
(% for various income ranges: 55.3% for AGIs below $25k, 57.8% for AGIs $25k-50k, 60.3% for AGIs $50k-75k, 57.7% for AGIs $75k-100k, 67.7% for AGIs $100k-200k)
Averages for the 2004 tax year for zip code 95838, filed in 2005:
Average Adjusted Gross Income (AGI) in 2004: $29,768 (Individual Income Tax Returns)
Here:
$29,768
State:
$58,600
Salary/wage: $28,479 (reported on 91.1% of returns)
Here:
$28,479
State:
$49,455
(% of AGI for various income ranges: 95.8% for AGIs below $10k, 85.4% for AGIs $10k-25k, 90.6% for AGIs $25k-50k, 89.5% for AGIs $50k-75k, 86.8% for AGIs $75k-100k, 65.2% for AGIs over 100k)
Taxable interest for individuals: $428 (reported on 27.6% of returns)
This zip code:
$428
California:
$2,365
(% of AGI for various income ranges: 1.0% for AGIs below $10k, 0.5% for AGIs $10k-25k, 0.3% for AGIs $25k-50k, 0.4% for AGIs $50k-75k, 0.3% for AGIs $75k-100k, 0.5% for AGIs over 100k)
Taxable dividends: $822 (reported on 5.5% of returns)
Here:
$822
State:
$4,746
(% of AGI for various income ranges: 0.2% for AGIs below $10k, 0.2% for AGIs $10k-25k, 0.1% for AGIs $25k-50k, 0.1% for AGIs $50k-75k, 0.1% for AGIs $75k-100k, 0.5% for AGIs over 100k)
Net capital gain/loss: +$9,779 (reported on 4.1% of returns)
Here:
+$9,779
State:
+$23,418
(% of AGI for various income ranges: -0.3% for AGIs below $10k, -0.1% for AGIs $10k-25k, 0.1% for AGIs $25k-50k, 0.6% for AGIs $50k-75k, 1.6% for AGIs $75k-100k, 12.8% for AGIs over 100k)
Profit/loss from business: +$6,044 (reported on 11.9% of returns)
Here:
+$6,044
State:
+$16,826
(% of AGI for various income ranges: 3.7% for AGIs below $10k, 4.9% for AGIs $10k-25k, 1.5% for AGIs $25k-50k, 1.6% for AGIs $50k-75k, 2.5% for AGIs $75k-100k, 2.5% for AGIs over 100k)
IRA payment deduction: $2,248 (reported on 1.1% of returns)
95838:
$2,248
California:
$3,192
(% of AGI for various income ranges: 0.1% for AGIs $10k-25k, 0.1% for AGIs $25k-50k, 0.1% for AGIs $50k-75k, 0.1% for AGIs $75k-100k)
Self-employed pension: $3,077 (reported on 0.1% of returns)
Here:
$3,077
California:
$17,688
Total itemized deductions: $19,221 (38% of AGI, reported on 28.3% of returns)
Here:
$19,221
State:
$28,113
Here:
37.6% of AGI
State:
25.3% of AGI
(% of AGI for various income ranges: 8.0% for AGIs below $10k, 8.2% for AGIs $10k-25k, 22.9% for AGIs $25k-50k, 19.8% for AGIs $50k-75k, 20.8% for AGIs $75k-100k, 17.0% for AGIs over 100k)
Charity contributions deductions: $2,023 (4% of AGI, reported on 22.9% of returns)
Here:
$2,023
State:
$3,923
Here:
3.8% of AGI
State:
3.3% of AGI
(% of AGI for various income ranges: 0.4% for AGIs below $10k, 0.7% for AGIs $10k-25k, 1.5% for AGIs $25k-50k, 2.0% for AGIs $50k-75k, 2.5% for AGIs $75k-100k, 2.0% for AGIs over 100k)
Total tax: $3,045 (reported on 60.6% of returns)
95838:
$3,045
State:
$10,761
(% of AGI for various income ranges: 2.2% for AGIs below $10k, 3.1% for AGIs $10k-25k, 4.8% for AGIs $25k-50k, 7.3% for AGIs $50k-75k, 9.2% for AGIs $75k-100k, 14.7% for AGIs over 100k)
Earned income credit: $1,936 (reported on 30.1% of returns)
Here:
$1,936
State:
$1,763
Percentage of individuals using paid preparers for their 2004 taxes: 64.1%
Here:
64%
State:
66%
(% for various income ranges: 57.5% for AGIs below $10k, 68.1% for AGIs $10k-25k, 65.4% for AGIs $25k-50k, 61.0% for AGIs $50k-75k, 62.9% for AGIs $75k-100k, 66.2% for AGIs over 100k)
Likely homosexual households (counted as self-reported same-sex unmarried-partner households)
Lesbian couples: 0.1% of all households
Gay men: 0.2% of all households
Household received Food Stamps/SNAP in the past 12 months: 3,752 Household did not receive Food Stamps/SNAP in the past 12 months: 8,695
Women who had a birth in the past 12 months: 707 (382 now married, 327 unmarried) Women who did not have a birth in the past 12 months: 9,031 (3,600 now married, 5,430 unmarried)
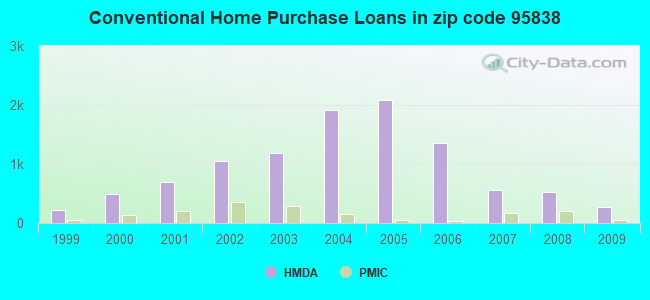
Housing units in zip code 95838 with a mortgage: 4,863 (356 second mortgage, 8 home equity loan, 189 both second mortgage and home equity loan) Houses without a mortgage: 34
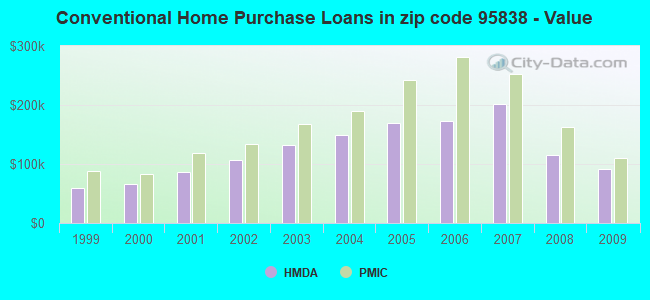
Median monthly owner costs for units with a mortgage: $1,732 Median monthly owner costs for units without a mortgage: $570
Residents with income below the poverty level in 2022:
This zip code:
20.2%
Whole state:
12.2%
Residents with income below 50% of the poverty level in 2022:
This zip code:
9.0%
Whole state:
6.2%
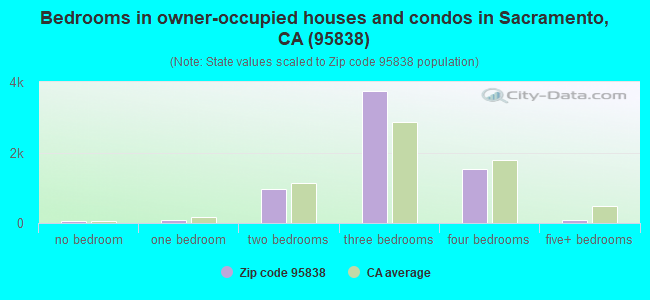
Median number of rooms in houses and condos:
Here:
5.7
State:
6.0
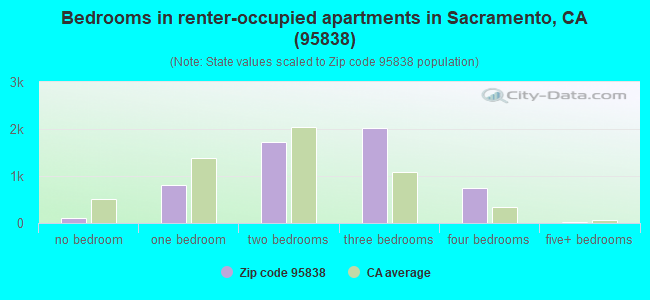
Median number of rooms in apartments:
Here:
4.5
State:
3.9
Notable locations in this zip code not listed on our city pages
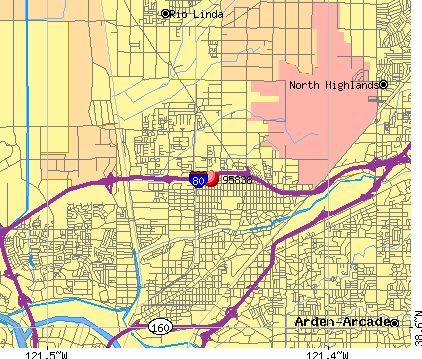
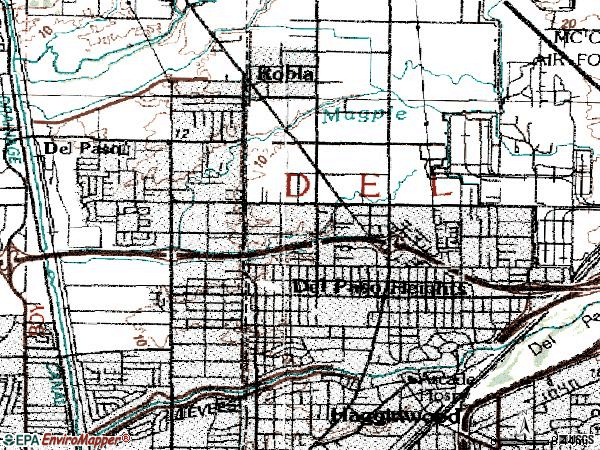
Notable locations in zip code 95838: Del Paso Heights Neighborhood Library (A), Sacramento City Fire Department Station 17 (B), City of Sacramento Police - William J Kinney Police Facility (C). Display/hide their locations on the map
Churches in zip code 95838 include: Christian Outreach Fellowship Church (A), Del Paso Church of God (B), Del Paso General Baptist Church (C), Faith Temple Church of God in Christ (D), First Samoan Assembly of God Church (E), Greater Grace Community Apostolic Church (F), Kingdom Hall Jehovahs Witnesses (G), Liberty Ministries Church of God (H), Miracle Church of God in Christ (I). Display/hide their locations on the map
Parks in zip code 95838 include: Del Paso Heights Park (1), Del Paso Park (2), North Norwood Park (3), Redding Park (4), Hagginwood Park (5), Bell Avenue Park (6), Main Avenue Park (7), North Avenue Park (8), Robertson Park (9). Display/hide their locations on the map
5,015 married couples with children.
4,274 single-parent households (1,467 men, 2,807 women).
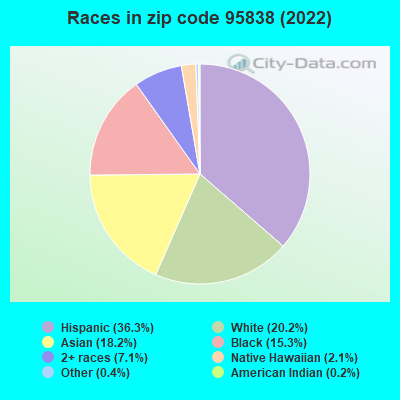
54.9% of residents of 95838 zip code speak English at home.
22.0% of residents speak Spanish at home (60% very well, 17% well, 13% not well, 10% not at all).
8.2% of residents speak other Indo-European language at home (62% very well, 18% well, 15% not well, 6% not at all).
12.5% of residents speak Asian or Pacific Island language at home (54% very well, 25% well, 16% not well, 4% not at all).
2.3% of residents speak other language at home (48% very well, 17% well, 22% not well, 13% not at all).
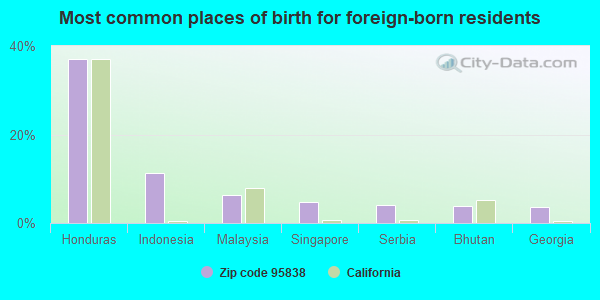
Foreign born population: 10,077 (24.6%) (54.3% of them are naturalized citizens)
Major facilities with environmental interests located in this zip code:
GRANT UNION HIGH (1400 GRAND AVE. in SACRAMENTO, CA)
(National Center for Education Statistics) - STATE ID-3433794 HAZARDOUS WASTE BIENNIAL REPORTER (Resource Conservation and Recovery Act (tracking hazardous waste)) Large Quantity Generators, more that 1000 kg of hazardous waste/month (Resource Conservation and Recovery Act (tracking hazardous waste)) Organizations: GRANT JOINT UNION HIGH (SCHOOL DISTRICT)
Alternative names: GRANT HIGH SCHOOL
EBARA TECHNOLOGIES INCORPORATED (51 MAIN AVE in SACRAMENTO, CA)
STATE MASTER (California - Hazardous Waste Tracking) - HAZARDOU WASTE PROGRAM HAZARDOUS WASTE BIENNIAL REPORTER (Resource Conservation and Recovery Act (tracking hazardous waste)) Small Quantity Generators, between 100 kg and 1000 kg of hazardous waste/month (Resource Conservation and Recovery Act (tracking hazardous waste)) - notification Business NAICS classification: PUMP AND PUMPING EQUIPMENT MANUFACTURING.
CENTRAL FREIGHT LINES INC (1621 MAIN AVENUE in SACRAMENTO, CA)
STATE MASTER (California - Hazardous Waste Tracking) - HAZARDOU WASTE PROGRAM Small Quantity Generators, between 100 kg and 1000 kg of hazardous waste/month (Resource Conservation and Recovery Act (tracking hazardous waste)) - notification Alternative names: VECTA TRANSPORTATION SYSTEMS
HALE'S TRUCK TRAILER REPAIR (4585 PELL DR in SACRAMENTO, CA) . Federal Facility
STATE MASTER (California - Hazardous Waste Tracking) - HAZARDOU WASTE PROGRAM Small Quantity Generators, between 100 kg and 1000 kg of hazardous waste/month (Resource Conservation and Recovery Act (tracking hazardous waste)) - notification Organizations: RICHARD PARQUETTE (CONTACT/OWNER)
Alternative names: TRUCK TRAILER SALES INC
CHEVRON STATION NO 91069 (4221 RALEY BLVD in SACRAMENTO, CA)
STATE MASTER (California - Hazardous Waste Tracking) - HAZARDOU WASTE PROGRAM Small Quantity Generators, between 100 kg and 1000 kg of hazardous waste/month (Resource Conservation and Recovery Act (tracking hazardous waste)) - notification Organizations: CHEVRON PRODUCTS CO (CONTACT/OWNER)
FAIRBANKS ELEMENTARY (227 FAIRBANKS AVE. in SACRAMENTO, CA)
(National Center for Education Statistics) - STATE ID-6032940 Organizations: DEL PASO HEIGHTS ELEMENTARY (SCHOOL DISTRICT)
GLENWOOD ELEMENTARY (201 JESSIE AVE. in SACRAMENTO, CA)
(National Center for Education Statistics) - STATE ID-6112296 Organizations: ROBLA ELEMENTARY (SCHOOL DISTRICT)
KEEMA (ELWOOD J.) HIGH (ALT.) (2035 NORTH AVENUE in SACRAMENTO, CA)
(National Center for Education Statistics) - STATE ID-3430634 Organizations: GRANT JOINT UNION HIGH (SCHOOL DISTRICT)
MAIN AVENUE ELEMENTARY (1400 MAIN AVE. in SACRAMENTO, CA)
(National Center for Education Statistics) - STATE ID-6033732 Organizations: ROBLA ELEMENTARY (SCHOOL DISTRICT)
MOREY AVENUE EARLY CHILDHOOD DEVEL. (155 MOREY AVE. in SACRAMENTO, CA)
(National Center for Education Statistics) - STATE ID-6032965 Organizations: DEL PASO HEIGHTS ELEMENTARY (SCHOOL DISTRICT)
NORTH AVENUE ELEMENTARY (1281 NORTH AVE. in SACRAMENTO, CA)
(National Center for Education Statistics) - STATE ID-6032973 Organizations: DEL PASO HEIGHTS ELEMENTARY (SCHOOL DISTRICT)
CASTORI (MICHAEL J.) ELEMENTARY (1801 SOUTH AVE. in SACRAMENTO, CA)
(National Center for Education Statistics) - STATE ID-6033427 Organizations: NORTH SACRAMENTO ELEMENTARY (SCHOOL DISTRICT)
CALIFORNIA AMERICAN WATER COMPANY (PARKWAY) (PARKWAY DRINKING WATER SYSTEM in SACRAMENTO, CA)
(Integrated Compliance Information System) - ICIS-09-2004-0283, FORMAL ENFORCEMENT ACTION
Housing units lacking complete plumbing facilities: 0.1% Housing units lacking complete kitchen facilities: 1.4%
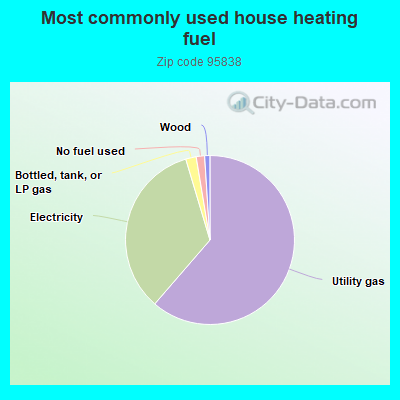
61.1%Utility gas
33.9%Electricity
2.0%Bottled, tank, or LP gas
1.6%No fuel used
1.0%Wood
Population in 1990: 26,996. Population change in the 1990s: +7,883 (+29.2%).
Place of birth for U.S.-born residents:
This state: 26,089
Northeast: 880
Midwest: 821
South: 1,980
West: 933
52% of the 95838 zip code residents lived in the same house 5 years ago. Out of people who lived in different houses, 75% lived in this county. Out of people who lived in different counties, 50% lived in California.
89% of the 95838 zip code residents lived in the same house 1 year ago. Out of people who lived in different houses, 65% moved from this county. Out of people who lived in different houses, 16% moved from different county within same state. Out of people who lived in different houses, 11% moved from different state. Out of people who lived in different houses, 7% moved from abroad.
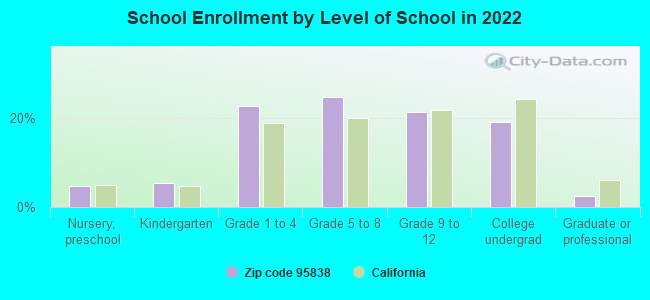
Private vs. public school enrollment:
Students in private schools in grades 1 to 8 (elementary and middle school): 358
Here:
6.4%
California:
10.5%
Students in private schools in grades 9 to 12 (high school): 150
Here:
6.0%
California:
8.5%
Students in private undergraduate colleges: 130
Here:
5.9%
California:
15.9%
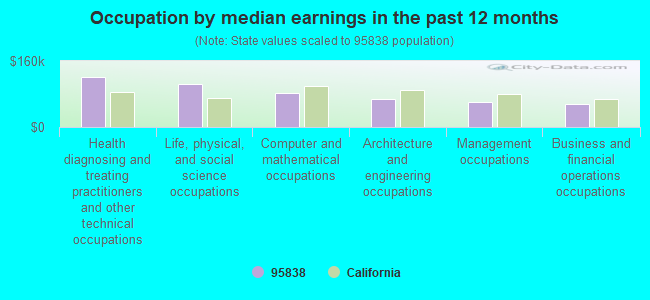
Occupation by median earnings in the past 12 months ($)
120,932Health diagnosing and treating practitioners and other technical occupations
104,660Life, physical, and social science occupations
82,659Computer and mathematical occupations
68,094Architecture and engineering occupations
60,025Management occupations
55,818Business and financial operations occupations
Companies with federal contracts located in this zip code (SACRAMENTO, CA):
COMPOSITE ENGINEERING INC (5381 RALEY BLVD; small business) : $92,611,212 in 114 contractsfrom 1999 to 2006
Contracts for Drones, Miscellaneous Fabricated Nonmetallic Materials, Guided Missile Components, Airframe Structural Components, and moreby Air Force, Navy, Army, Defense Logistics Agency, and others Signed by year:2000: $1,704,108; 2001: $789,310; 2002: $11,811,657; 2003: $2,077,483; 2004: $20,353,663; 2005: $27,111,407; 2006: $28,608,920.
Biggest contracts:
$19,823,973 with Air Force for Drones. Signed on 2005-05-12. Completion date: 2008-03-01.
$15,000,785, same as above.Signed on 2006-03-17. Completion date: 2009-12-30.
$7,892,946, same as above.Signed on 2004-08-11. Completion date: 2005-03-01.
$6,603,770, same as above.Signed on 2002-07-12. Completion date: 2004-03-12.
VALLEJO BUSINESS PARK ASSOCIAT (171 SPARTAN WAY; small business) : $685,932 in 38 contractsfrom 2003 to 2006
Contracts for Lease or Rental of Facilities -- Office Buildings by Public Buildings Service Signed by year:2000: $0; 2001: $0; 2002: $0; 2003: $204,996; 2004: $51,249; 2005: $232,587; 2006: $197,100.
Biggest contracts:
$19,710 with Public Buildings Service for Lease or Rental of Facilities -- Office Buildings. Signed on 2006-07-01. Completion date: 2006-09-30.
$19,710, same as above.Signed on 2006-07-01. Completion date: 2006-09-30.
$19,710, same as above.Signed on 2006-07-01. Completion date: 2006-09-30.
$19,710, same as above.Signed on 2006-01-01. Completion date: 2006-02-28.
COMTECH COMMUNICATIONS, INC (120 MAIN AVENUE SUITE G; small business) : $64,771 in 4 contractsfrom 2003 to 2005
$55,100 with Forest Service for Miscellaneous Electrical and Electronic Components. Signed on 2003-05-15. Completion date: 2003-10-15.
$9,671 with Navy for Miscellaneous Alarm, Signal and Security Detection Systems. Signed on 2005-09-28. Completion date: 2005-12-31.
$0 with U.S. Fish and Wildlife Service for Installation of Equipment -- Fiber Optics Materials, Components, Assemblies, and Accessories. Signed on 2003-12-09. Completion date: 2004-09-30.
$0, same as above.Signed on 2003-12-09. Completion date: 2004-09-30.
COMCAST CORPORATION (4350 PELL DR) : $26,332 in 2 contractsfrom 2004 to 2005
$17,332 with Public Buildings Service for Cable, Cord, and Wire Assemblies: Communications Equipment. Signed on 2004-01-19. Completion date: 2005-02-01.
$9,000 with Army for Miscellaneous Items. Signed on 2005-09-25. Completion date: 2006-01-01.
SPACE CASE COMPANY (4721 PELL DR STE 1; small business) : $24,673 in 10 contractsfrom 2002 to 2004
Contracts for Boxes, Cartons, and Crates by Department of Defense, American Forces Information Service Signed by year:2000: $0; 2001: $0; 2002: $7,859; 2003: $12,724; 2004: $4,090; 2005: $0; 2006: $0.
Biggest contracts:
$7,043 with Department of Defense for Boxes, Cartons, and Crates. Signed on 2002-09-21. Completion date: 2002-10-10.
$5,443, same as above.Signed on 2003-07-08. Completion date: 2003-08-15.
$4,090 with American Forces Information Service for Boxes, Cartons, and Crates. Signed on 2004-03-02. Completion date: 2004-03-26.
$2,289 with Department of Defense for Boxes, Cartons, and Crates. Signed on 2003-03-03. Completion date: 2003-04-07.
FEDERAL BENEFIT SOLUTIONS (6 FIG LEAF CT; small business)
$7,980 with Air Force for Education Services. Taking place in WA. Signed on 2005-09-21. Completion date: 2005-10-20.
INTEGRATED CLEANING SYSTEMS WE (251 OPPORTUNITY ST, STE E; small business)
$7,502 with Air Force for Maintenance, Repair and Rebuilding of Equipment -- Miscellaneous. Signed on 2006-05-23. Completion date: 2006-06-23.
R A H ENVIRONMENTAL INC (4645 RALEY BLVD; small business)
$3,000 with Air Force for Other Housekeeping Services. Signed on 2006-05-16. Completion date: 2006-05-19.
GRANT JOINT UNION HIGH SCHOOL (1333 GRAND AVE; small business)
$3,000 with Army for Passenger Motor Charter Service. Signed on 2005-02-24. Completion date: 2005-03-23.
Top industries in this zip code by the number of employees in 2005:
Information: Cable and Other Program Distribution (250-499 employees: 2 establishments)
Construction: New Single-Family Housing Construction (except Operative Builders) (250-499: 1, 5-9: 1, 1-4: 3)
Administrative and Support and Waste Management and Remediation Services: Private Mail Centers (250-499: 1)
2006 - 2018 National Fire Incident Reporting System (NFIRS) incidents
Based on the data from the years 2006 - 2018 the average number of fire incidents per year is 167. The highest number of reported fire incidents - 252 took place in 2017, and the least - 98 in 2012. The data has an increasing trend.
When looking into fire subcategories, the most reports belonged to: Outside Fires (64.6%), and Mobile Property/Vehicle Fires (18.7%).
Fire incident types reported to NFIRS in Zip Code 95838


 Nearest zip codes: 95815, 95673, 95652, 95821, 95825, 95811.
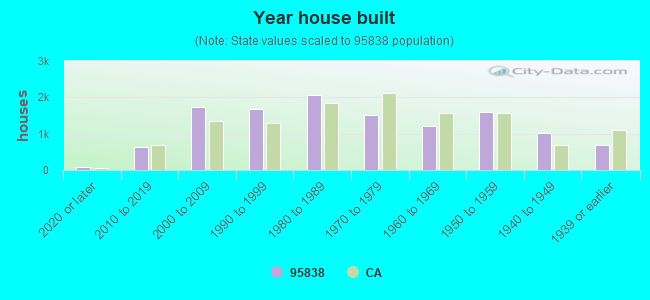


 Based on the data from the years 2006 - 2018 the average number of fire incidents per year is 167. The highest number of reported fire incidents - 252 took place in 2017, and the least - 98 in 2012. The data has an increasing trend.
 When looking into fire subcategories, the most reports belonged to: Outside Fires (64.6%), and Mobile Property/Vehicle Fires (18.7%).