Estimated zip code population in 2022: 588 Zip code population in 2010: 687 Zip code population in 2000: 613
Houses and condos: 373 Renter-occupied apartments: 92
% of renters here:
31%
State:
44%
March 2022 cost of living index in zip code 95922: 96.1 (near average, U.S. average is 100)
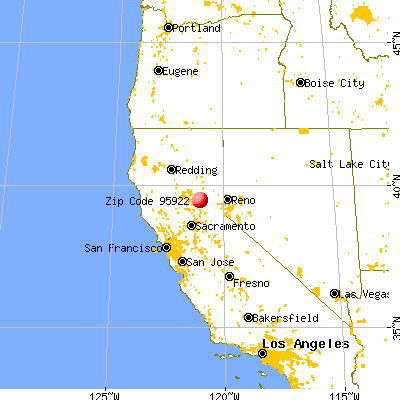
Land area: 62.8 sq. mi. Water area: 4.2 sq. mi.
Population density: 9 people per square mile
(very low).
OSM Map
General Map
Google Map
MSN Map
OSM Map
General Map
Google Map
MSN Map
OSM Map
General Map
Google Map
MSN Map
OSM Map
General Map
Google Map
MSN Map
Please wait while loading the map...
Real estate property taxes paid for housing units in 2022:
This zip code:
0.6% ($1,801)
California:
0.7% ($4,831)
Median real estate property taxes paid for housing units with mortgages in 2022: $2,561 (0.7%) Median real estate property taxes paid for housing units with no mortgage in 2022: $1,366 (0.5%)
Business Search- 14 Million verified businesses
Males: 315
(53.6%)
Females: 272
(46.4%)
For population 25 years and over in 95922:
High school or higher: 89.2%
Bachelor's degree or higher: 16.8%
Graduate or professional degree: 5.6%
Unemployed: 6.1%
Mean travel time to work (commute): 38.0 minutes
For population 15 years and over in 95922:
Never married: 18.6%
Now married: 49.2%
Separated: 0.0%
Widowed: 8.8%
Divorced: 23.4%
Zip code 95922 compared to state average:
Median household income below state average.
Median house value significantly below state average.
Black race population percentage significantly below state average.
Hispanic race population percentage significantly below state average.
Median age significantly above state average.
Foreign-born population percentage significantly below state average.
Length of stay since moving in significantly above state average.
Number of college students significantly below state average.
Percentage of population with a bachelor's degree or higher below state average.
Estimated median house/condo value in 2022: $308,924
95922:
$308,924
California:
$715,900
According to our research of California and other state lists, there was 1 registered sex offender living in 95922 zip code as of June 09, 2024. The ratio of all residents to sex offenders in zip code 95922 is 546 to 1.
Median resident age:
This zip code:
61.6 years
California median age:
37.9 years
Average household size:
This zip code:
2.0 people
California:
2.8 people
Averages for the 2020 tax year for zip code 95922, filed in 2021:
Average Adjusted Gross Income (AGI) in 2020: $43,452 (Individual Income Tax Returns)
Here:
$43,452
State:
$95,910
Salary/wage: $33,892 (reported on 61.9% of returns)
Here:
$33,892
State:
$77,331
(% of AGI for various income ranges: 791.4% for AGIs below $25k, 2780.0% for AGIs $25k-50k, 6850.0% for AGIs $50k-75k)
Taxable interest for individuals: $100 (reported on 23.8% of returns)
This zip code:
$100
California:
$2,294
(% of AGI for various income ranges: 5.7% for AGIs below $25k, 2.5% for AGIs $50k-75k)
Ordinary dividends: $1,250 (reported on 9.5% of returns)
Here:
$1,250
State:
$10,949
(% of AGI for various income ranges: 35.7% for AGIs below $25k)
Net capital gain/loss in AGI: +$2,900 (reported on 9.5% of returns)
Here:
+$2,900
State:
+$49,306
(% of AGI for various income ranges: 82.9% for AGIs below $25k)
Profit/loss from business: +$12,500 (reported on 23.8% of returns)
Here:
+$12,500
State:
+$15,671
(% of AGI for various income ranges: 892.9% for AGIs below $25k)
Earned income credit: $2,650 (reported on 19.0% of returns)
Here:
$2,650
State:
$2,074
(% of AGI for various income ranges: 151.4% for AGIs below $25k)
Percentage of individuals using paid preparers for their 2020 taxes: 100.0%
Here:
100%
State:
92%
(% for various income ranges: 100.0% for AGIs below $25k, 100.0% for AGIs $25k-50k, 100.0% for AGIs $50k-75k, 100.0% for AGIs $100k-200k)
Averages for the 2012 tax year for zip code 95922, filed in 2013:
Average Adjusted Gross Income (AGI) in 2012: $39,047 (Individual Income Tax Returns)
Here:
$39,047
State:
$72,726
Salary/wage: $37,782 (reported on 57.9% of returns)
Here:
$37,782
State:
$59,079
(% of AGI for various income ranges: 50.7% for AGIs below $25k, 112.8% for AGIs $25k-50k, 58.6% for AGIs $75k-100k)
Taxable interest for individuals: $150 (reported on 31.6% of returns)
This zip code:
$150
California:
$2,146
Ordinary dividends: $550 (reported on 10.5% of returns)
Here:
$550
State:
$9,308
Net capital gain/loss in AGI: +$650 (reported on 10.5% of returns)
Here:
+$650
State:
+$30,460
Profit/loss from business: +$10,660 (reported on 26.3% of returns)
Here:
+$10,660
State:
+$17,064
Total itemized deductions: $20,160 (28% of AGI, reported on 26.3% of returns)
Here:
$20,160
State:
$34,004
Here:
28.3% of AGI
State:
22.7% of AGI
Charity contributions: $767 (reported on 15.8% of returns)
Here:
$767
State:
$4,659
Taxes paid: $4,740 (reported on 26.3% of returns)
95922:
$4,740
State:
$14,448
Earned income credit: $1,550 (reported on 21.1% of returns)
Here:
$1,550
State:
$2,286
(% of AGI for various income ranges: 5.7% for AGIs below $25k)
Percentage of individuals using paid preparers for their 2012 taxes: 52.6%
Here:
53%
State:
64%
(% for various income ranges: 44.4% for AGIs below $25k, 100.0% for AGIs $25k-50k, 66.7% for AGIs $75k-100k)
Averages for the 2004 tax year for zip code 95922, filed in 2005:
Average Adjusted Gross Income (AGI) in 2004: $36,297 (Individual Income Tax Returns)
Here:
$36,297
State:
$58,600
Salary/wage: $34,544 (reported on 74.7% of returns)
Here:
$34,544
State:
$49,455
(% of AGI for various income ranges: 84.2% for AGIs below $10k, 66.5% for AGIs $10k-25k, 76.0% for AGIs $25k-50k, 77.8% for AGIs $50k-75k, 62.2% for AGIs over 100k)
Taxable interest for individuals: $1,485 (reported on 44.1% of returns)
This zip code:
$1,485
California:
$2,365
(% of AGI for various income ranges: 9.8% for AGIs below $10k, 4.7% for AGIs $10k-25k, 0.7% for AGIs $25k-50k, 1.1% for AGIs $50k-75k, 1.5% for AGIs over 100k)
Taxable dividends: $1,171 (reported on 17.9% of returns)
Here:
$1,171
State:
$4,746
Total itemized deductions: $20,812 (30% of AGI, reported on 27.9% of returns)
Here:
$20,812
State:
$28,113
Here:
29.5% of AGI
State:
25.3% of AGI
(% of AGI for various income ranges: 17.8% for AGIs $10k-25k, 9.4% for AGIs $25k-50k, 19.5% for AGIs $50k-75k, 18.4% for AGIs over 100k)
Charity contributions deductions: $1,359 (2% of AGI, reported on 17.0% of returns)
Here:
$1,359
State:
$3,923
Here:
1.5% of AGI
State:
3.3% of AGI
(% of AGI for various income ranges: 1.0% for AGIs $10k-25k, 0.7% for AGIs $50k-75k, 1.0% for AGIs over 100k)
Total tax: $4,824 (reported on 74.2% of returns)
95922:
$4,824
State:
$10,761
(% of AGI for various income ranges: 8.7% for AGIs below $10k, 4.5% for AGIs $10k-25k, 6.7% for AGIs $25k-50k, 7.9% for AGIs $50k-75k, 16.4% for AGIs over 100k)
Earned income credit: $1,267 (reported on 19.7% of returns)
Here:
$1,267
State:
$1,763
Percentage of individuals using paid preparers for their 2004 taxes: 61.1%
Here:
61%
State:
66%
(% for various income ranges: 53.6% for AGIs below $10k, 58.1% for AGIs $10k-25k, 60.3% for AGIs $25k-50k, 63.9% for AGIs $50k-75k, 94.1% for AGIs over 100k)
Likely homosexual households (counted as self-reported same-sex unmarried-partner households)
Lesbian couples: 0.0% of all households
Gay men: 0.7% of all households
Household received Food Stamps/SNAP in the past 12 months: 55 Household did not receive Food Stamps/SNAP in the past 12 months: 247
Women who had a birth in the past 12 months: 6 (6 now married, 0 unmarried) Women who did not have a birth in the past 12 months: 62 (8 now married, 54 unmarried)
Housing units in zip code 95922 with a mortgage: 82 (6 second mortgage, 6 both second mortgage and home equity loan) Houses without a mortgage: 14
Median monthly owner costs for units with a mortgage: $1,846 Median monthly owner costs for units without a mortgage: $483
Residents with income below the poverty level in 2022:
This zip code:
13.0%
Whole state:
12.2%
Residents with income below 50% of the poverty level in 2022:
This zip code:
7.2%
Whole state:
6.2%
Median number of rooms in houses and condos:
Here:
5.0
State:
6.0
Median number of rooms in apartments:
Here:
4.6
State:
3.9
Notable locations in this zip code not listed on our city pages
Notable locations in zip code 95922: Frenchy Point Campground (A), Weed Point (B), Pendola Ranch (C), Garden Point Campground (D), Camp Pendola (E), Baker Ranch (F), Bartsch Ranch (G), Beresford Ranch (H), Burris Ranch (I), Girot Ranch (J), Hornswaggle Group Campground (K), Schoolhouse Campground (L), Dark Day Boat Ramp (M), Dark Day Picnic Area (N), North Yuba Ranger Station (O), Moonshine Campground (P), Kelly Ranch (Q), Kennedy Ranch (R), Skyline Ranch (S), Oak Valley Guard Station (T). Display/hide their locations on the map
Rivers and creeks: Brushy Creek (A), Deadwood Creek (B), Slate Creek (C), Sleighville Creek (D), Schoolhouse Creek (E), North Yuba River (F), Mill Creek (G), Middle Yuba River (H), Lost Creek (I). Display/hide their locations on the map
In group quarters: 5 (-1 institutionalized population)
Size of family households: 81 2-persons, 20 3-persons, 14 4-persons, 7 5-persons, 7 6-persons
Size of nonfamily households: 134 1-person, 27 2-persons, 8 3-persons
26 married couples with children.
12 single-parent households (12 women).
93.3% of residents of 95922 zip code speak English at home.
5.8% of residents speak Spanish at home (97% very well, 3% not at all).
0.9% of residents speak other Indo-European language at home (40% very well, 60% well).
0.5% of residents speak other language at home (100% very well).
Foreign born population: 5 (0.9%) (80.3% of them are naturalized citizens)
This zip code:
0.9%
Whole state:
26.7%
50%Sweden
50%United Kingdom, excluding England and Scotland
15%Finnish
14%English
11%German
11%Irish
3%Italian
2%American
2%Assyrian
Year of entry for the foreign-born population
12010 or later
02000 to 2009
01990 to 1999
3Before 1990
Facilities with environmental interests located in this zip code:
CAMPTONVILLE ELEMENTARY (100 SCHOOL ST. in CAMPTONVILLE, CA)
(National Center for Education Statistics) - STATE ID-6056600
CAMPTONVILLE DISPOSAL SITE (OFF OLD CAMPTONVILLE RD ON WIL in CAMPTONVILLE, CA)
CRITERIA AND HAZARDOUS AIR POLLUTANT INVENTORY (Inventory of air pollution sources) Business SIC classification: REFUSE SYSTEMS Business NAICS classification: SOLID WASTE LANDFILL.
Housing units lacking complete plumbing facilities: 4.9% Housing units lacking complete kitchen facilities: 5.8%
48.3%Wood
34.9%Bottled, tank, or LP gas
11.0%Electricity
3.1%Solar energy
2.7%Other fuel
0.7%Utility gas
Population in 1990: 1,090.
Place of birth for U.S.-born residents:
This state: 297
Northeast: 96
Midwest: 29
South: 78
West: 75
67% of the 95922 zip code residents lived in the same house 5 years ago. Out of people who lived in different houses, 21% lived in this county. Out of people who lived in different counties, 50% lived in California.
83% of the 95922 zip code residents lived in the same house 1 year ago. Out of people who lived in different houses, 23% moved from this county. Out of people who lived in different houses, 60% moved from different county within same state. Out of people who lived in different houses, 15% moved from different state.
Private vs. public school enrollment:
Students in private schools in grades 1 to 8 (elementary and middle school): 7
Here:
32.1%
California:
10.5%
Students in private schools in grades 9 to 12 (high school): 9
Here:
47.3%
California:
8.5%
Students in private undergraduate colleges:
Here:
0.0%
California:
15.9%
Occupation by median earnings in the past 12 months ($)
104,352Office and administrative support occupations
23,911Education, training, and library occupations
23,612Management occupations
23,064Construction and extraction occupations
13,398Building and grounds cleaning and maintenance occupations
Top industries in this zip code by the number of employees in 2005:
Educational Services: Elementary and Secondary Schools (100-249 employees: 1 establishment)
Construction: New Single-Family Housing Construction (except Operative Builders) (5-9: 1, 1-4: 1)
Health Care and Social Assistance: Services for the Elderly and Persons with Disabilities (5-9: 1)
Real Estate and Rental and Leasing: Lessors of Other Real Estate Property (1-4: 2)
Arts, Entertainment, and Recreation: Marinas (1-4: 1)
Construction: Glass and Glazing Contractors (1-4: 1)
Health Care and Social Assistance: Other Individual and Family Services (1-4: 1)
Other Services (except Public Administration): General Automotive Repair (1-4: 1)
Fatal accident statistics in 2013:
Fatal accident count: 2
Vehicles involved in fatal accidents: 2
Fatal accidents caused by drunken drivers: 2
Fatalities: 2
Persons involved in fatal accidents: 8
Pedestrians involved in fatal accidents: 1
Fatal accident statistics in 2012:
Fatal accident count: 1
Vehicles involved in fatal accidents: 1
Fatal accidents caused by drunken drivers: 1
Fatalities: 1
Persons involved in fatal accidents: 1
Pedestrians involved in fatal accidents: 0
Home Mortgage Disclosure Act Aggregated Statistics For Year 2009 (Based on 2 partial tracts)
A) FHA, FSA/RHS & VA Home Purchase Loans
B) Conventional Home Purchase Loans
C) Refinancings
D) Home Improvement Loans
F) Non-occupant Loans on < 5 Family Dwellings (A B C & D)
G) Loans On Manufactured Home Dwelling (A B C & D)
Number
Average Value
Number
Average Value
Number
Average Value
Number
Average Value
Number
Average Value
Number
Average Value
LOANS ORIGINATED
4
$221,615
3
$152,020
12
$184,766
0
$0
4
$158,088
3
$168,330
APPLICATIONS APPROVED, NOT ACCEPTED
1
$140,320
0
$0
1
$259,420
0
$0
0
$0
0
$0
APPLICATIONS DENIED
1
$162,730
2
$181,005
14
$178,522
1
$59,550
2
$113,795
5
$156,952
APPLICATIONS WITHDRAWN
0
$0
0
$0
5
$175,760
1
$34,200
1
$128,530
2
$106,275
FILES CLOSED FOR INCOMPLETENESS
0
$0
0
$0
1
$119,980
0
$0
0
$0
0
$0
Aggregated Statistics For Year 2008 (Based on 2 partial tracts)
A) FHA, FSA/RHS & VA Home Purchase Loans
B) Conventional Home Purchase Loans
C) Refinancings
D) Home Improvement Loans
F) Non-occupant Loans on < 5 Family Dwellings (A B C & D)
G) Loans On Manufactured Home Dwelling (A B C & D)
Number
Average Value
Number
Average Value
Number
Average Value
Number
Average Value
Number
Average Value
Number
Average Value
LOANS ORIGINATED
3
$175,800
4
$156,318
14
$196,821
1
$182,190
4
$145,042
7
$193,304
APPLICATIONS APPROVED, NOT ACCEPTED
0
$0
1
$136,790
3
$255,590
0
$0
1
$292,150
2
$177,025
APPLICATIONS DENIED
1
$85,790
2
$220,510
14
$185,682
4
$134,060
1
$96,990
4
$159,708
APPLICATIONS WITHDRAWN
1
$97,580
0
$0
6
$222,230
1
$64,860
1
$134,430
1
$267,970
FILES CLOSED FOR INCOMPLETENESS
0
$0
0
$0
2
$199,285
0
$0
0
$0
1
$170,690
Aggregated Statistics For Year 2007 (Based on 2 partial tracts)
B) Conventional Home Purchase Loans
C) Refinancings
D) Home Improvement Loans
F) Non-occupant Loans on < 5 Family Dwellings (A B C & D)
G) Loans On Manufactured Home Dwelling (A B C & D)
Number
Average Value
Number
Average Value
Number
Average Value
Number
Average Value
Number
Average Value
LOANS ORIGINATED
8
$233,592
24
$208,571
6
$140,128
5
$212,374
9
$155,196
APPLICATIONS APPROVED, NOT ACCEPTED
1
$299,520
7
$257,234
1
$43,340
1
$180,120
2
$210,780
APPLICATIONS DENIED
4
$175,110
22
$234,540
4
$106,350
1
$133,840
6
$177,027
APPLICATIONS WITHDRAWN
1
$388,550
8
$262,814
2
$116,740
1
$84,020
1
$261,190
FILES CLOSED FOR INCOMPLETENESS
0
$0
4
$243,578
0
$0
0
$0
0
$0
Aggregated Statistics For Year 2006 (Based on 2 partial tracts)
A) FHA, FSA/RHS & VA Home Purchase Loans
B) Conventional Home Purchase Loans
C) Refinancings
D) Home Improvement Loans
F) Non-occupant Loans on < 5 Family Dwellings (A B C & D)
G) Loans On Manufactured Home Dwelling (A B C & D)
Number
Average Value
Number
Average Value
Number
Average Value
Number
Average Value
Number
Average Value
Number
Average Value
LOANS ORIGINATED
2
$192,210
14
$204,991
31
$214,386
6
$98,708
4
$217,782
11
$167,607
APPLICATIONS APPROVED, NOT ACCEPTED
0
$0
3
$193,880
9
$219,528
1
$24,170
1
$193,090
2
$121,605
APPLICATIONS DENIED
0
$0
10
$187,051
33
$239,467
6
$137,917
2
$202,820
9
$175,471
APPLICATIONS WITHDRAWN
0
$0
6
$168,380
18
$237,559
2
$94,780
1
$137,080
2
$217,415
FILES CLOSED FOR INCOMPLETENESS
0
$0
0
$0
4
$262,962
0
$0
0
$0
1
$178,060
Aggregated Statistics For Year 2005 (Based on 2 partial tracts)
A) FHA, FSA/RHS & VA Home Purchase Loans
B) Conventional Home Purchase Loans
C) Refinancings
D) Home Improvement Loans
F) Non-occupant Loans on < 5 Family Dwellings (A B C & D)
G) Loans On Manufactured Home Dwelling (A B C & D)
Number
Average Value
Number
Average Value
Number
Average Value
Number
Average Value
Number
Average Value
Number
Average Value
LOANS ORIGINATED
0
$0
24
$191,116
39
$184,666
7
$126,174
4
$239,745
12
$174,644
APPLICATIONS APPROVED, NOT ACCEPTED
1
$123,230
4
$213,215
9
$163,712
1
$160,370
1
$315,730
3
$159,683
APPLICATIONS DENIED
1
$98,170
8
$180,529
24
$173,514
4
$138,630
2
$149,020
9
$108,126
APPLICATIONS WITHDRAWN
0
$0
6
$159,928
16
$150,919
1
$62,790
0
$0
6
$123,522
FILES CLOSED FOR INCOMPLETENESS
0
$0
1
$166,270
6
$194,518
1
$97,280
0
$0
2
$158,895
Aggregated Statistics For Year 2004 (Based on 2 partial tracts)
A) FHA, FSA/RHS & VA Home Purchase Loans
B) Conventional Home Purchase Loans
C) Refinancings
D) Home Improvement Loans
F) Non-occupant Loans on < 5 Family Dwellings (A B C & D)
G) Loans On Manufactured Home Dwelling (A B C & D)
Number
Average Value
Number
Average Value
Number
Average Value
Number
Average Value
Number
Average Value
Number
Average Value
LOANS ORIGINATED
1
$137,670
16
$148,579
37
$155,407
6
$127,747
6
$145,680
10
$132,807
APPLICATIONS APPROVED, NOT ACCEPTED
1
$88,730
2
$110,255
11
$140,271
1
$80,190
1
$72,230
3
$90,800
APPLICATIONS DENIED
0
$0
11
$136,546
32
$152,541
4
$109,370
2
$98,170
12
$158,922
APPLICATIONS WITHDRAWN
0
$0
5
$134,310
15
$143,567
1
$61,320
1
$251,460
2
$119,245
FILES CLOSED FOR INCOMPLETENESS
0
$0
1
$90,210
3
$168,133
0
$0
1
$45,100
1
$67,800
Aggregated Statistics For Year 2003 (Based on 2 partial tracts)
A) FHA, FSA/RHS & VA Home Purchase Loans
B) Conventional Home Purchase Loans
C) Refinancings
D) Home Improvement Loans
F) Non-occupant Loans on < 5 Family Dwellings (A B C & D)
Number
Average Value
Number
Average Value
Number
Average Value
Number
Average Value
Number
Average Value
LOANS ORIGINATED
1
$118,510
9
$156,571
44
$130,771
2
$34,195
5
$111,906
APPLICATIONS APPROVED, NOT ACCEPTED
0
$0
2
$136,640
8
$128,718
1
$58,960
1
$167,150
APPLICATIONS DENIED
0
$0
4
$136,272
19
$136,182
2
$39,505
1
$119,980
APPLICATIONS WITHDRAWN
0
$0
1
$238,200
13
$126,152
1
$11,790
0
$0
FILES CLOSED FOR INCOMPLETENESS
0
$0
1
$64,270
3
$119,297
0
$0
0
$0
Aggregated Statistics For Year 2002 (Based on 2 partial tracts)
A) FHA, FSA/RHS & VA Home Purchase Loans
B) Conventional Home Purchase Loans
C) Refinancings
F) Non-occupant Loans on < 5 Family Dwellings (A B C & D)
Number
Average Value
Number
Average Value
Number
Average Value
Number
Average Value
LOANS ORIGINATED
2
$117,920
17
$102,781
28
$123,090
4
$78,638
APPLICATIONS APPROVED, NOT ACCEPTED
0
$0
1
$112,610
4
$102,295
0
$0
APPLICATIONS DENIED
0
$0
3
$99,250
14
$100,548
1
$132,950
APPLICATIONS WITHDRAWN
0
$0
2
$149,315
11
$119,045
1
$205,180
FILES CLOSED FOR INCOMPLETENESS
0
$0
0
$0
2
$115,415
0
$0
Aggregated Statistics For Year 2001 (Based on 2 partial tracts)
A) FHA, FSA/RHS & VA Home Purchase Loans
B) Conventional Home Purchase Loans
C) Refinancings
D) Home Improvement Loans
F) Non-occupant Loans on < 5 Family Dwellings (A B C & D)
Number
Average Value
Number
Average Value
Number
Average Value
Number
Average Value
Number
Average Value
LOANS ORIGINATED
2
$105,980
9
$106,227
23
$103,398
0
$0
4
$111,582
APPLICATIONS APPROVED, NOT ACCEPTED
0
$0
1
$141,500
2
$120,280
0
$0
0
$0
APPLICATIONS DENIED
1
$93,750
3
$81,463
12
$119,075
2
$26,825
1
$49,530
APPLICATIONS WITHDRAWN
0
$0
1
$72,520
6
$90,750
0
$0
0
$0
FILES CLOSED FOR INCOMPLETENESS
0
$0
0
$0
1
$81,070
0
$0
0
$0
Aggregated Statistics For Year 2000 (Based on 2 partial tracts)
A) FHA, FSA/RHS & VA Home Purchase Loans
B) Conventional Home Purchase Loans
C) Refinancings
D) Home Improvement Loans
F) Non-occupant Loans on < 5 Family Dwellings (A B C & D)
Number
Average Value
Number
Average Value
Number
Average Value
Number
Average Value
Number
Average Value
LOANS ORIGINATED
3
$98,463
11
$89,030
8
$97,321
1
$38,030
2
$82,840
APPLICATIONS APPROVED, NOT ACCEPTED
1
$63,090
1
$176,590
2
$99,790
1
$97,280
0
$0
APPLICATIONS DENIED
1
$66,040
5
$86,848
9
$113,104
2
$26,385
1
$38,620
APPLICATIONS WITHDRAWN
1
$52,180
2
$112,615
4
$105,390
0
$0
0
$0
FILES CLOSED FOR INCOMPLETENESS
0
$0
0
$0
1
$56,600
0
$0
0
$0
Aggregated Statistics For Year 1999 (Based on 1 partial tract)
A) FHA, FSA/RHS & VA Home Purchase Loans
B) Conventional Home Purchase Loans
C) Refinancings
D) Home Improvement Loans
F) Non-occupant Loans on < 5 Family Dwellings (A B C & D)


 Nearest zip codes: 95960, 95925, 95944, 95930, 95935, 95941.