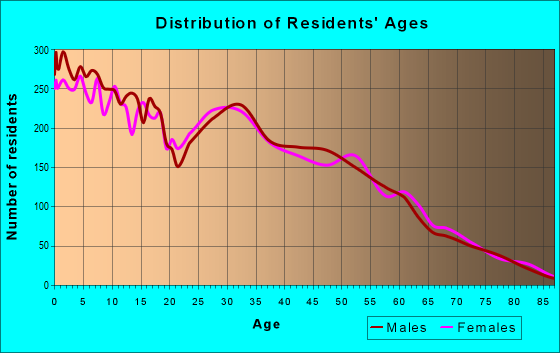
Estimated zip code population in 2022: 32,391 Zip code population in 2010: 26,510 Zip code population in 2000: 6,435
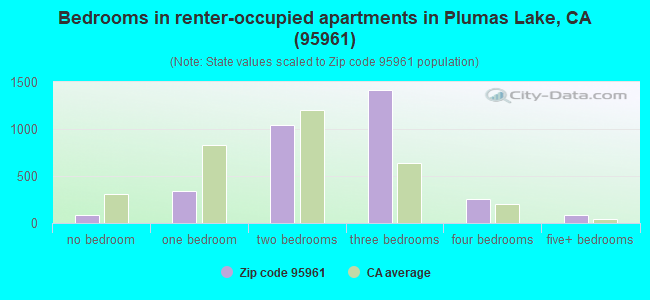
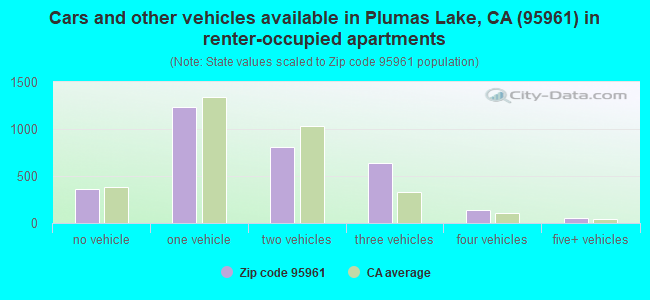
Houses and condos: 10,361 Renter-occupied apartments: 3,232
% of renters here:
32%
State:
44%
March 2022 cost of living index in zip code 95961: 93.0 (less than average, U.S. average is 100)
Land area: 45.8 sq. mi. Water area: 0.7 sq. mi.
Population density: 708 people per square mile
(low).
OSM Map
General Map
Google Map
MSN Map
OSM Map
General Map
Google Map
MSN Map
OSM Map
General Map
Google Map
MSN Map
OSM Map
General Map
Google Map
MSN Map
Please wait while loading the map...
Real estate property taxes paid for housing units in 2022:
This zip code:
0.9% ($3,462)
California:
0.7% ($4,831)
Median real estate property taxes paid for housing units with mortgages in 2022: $3,805 (0.9%) Median real estate property taxes paid for housing units with no mortgage in 2022: $2,060 (0.7%)
Averages for the 2020 tax year for zip code 95961, filed in 2021:
Average Adjusted Gross Income (AGI) in 2020: $56,128 (Individual Income Tax Returns)
Here:
$56,128
State:
$95,910
Salary/wage: $52,755 (reported on 86.8% of returns)
Here:
$52,755
State:
$77,331
(% of AGI for various income ranges: 1267.2% for AGIs below $25k, 3850.6% for AGIs $25k-50k, 7207.8% for AGIs $50k-75k, 10415.6% for AGIs $75k-100k, 19717.7% for AGIs $100k-200k, 65500.0% for AGIs over 200k)
Taxable interest for individuals: $295 (reported on 30.0% of returns)
This zip code:
$295
California:
$2,294
(% of AGI for various income ranges: 5.3% for AGIs below $25k, 7.0% for AGIs $25k-50k, 13.0% for AGIs $50k-75k, 15.3% for AGIs $75k-100k, 26.7% for AGIs $100k-200k, 270.0% for AGIs over 200k)
Ordinary dividends: $1,678 (reported on 6.6% of returns)
Here:
$1,678
State:
$10,949
(% of AGI for various income ranges: 4.9% for AGIs below $25k, 6.4% for AGIs $25k-50k, 9.4% for AGIs $50k-75k, 34.5% for AGIs $75k-100k, 45.9% for AGIs $100k-200k, 275.7% for AGIs over 200k)
Net capital gain/loss in AGI: +$11,723 (reported on 8.2% of returns)
Here:
+$11,723
State:
+$49,306
(% of AGI for various income ranges: 3.2% for AGIs below $25k, 5.5% for AGIs $25k-50k, 31.5% for AGIs $50k-75k, 69.7% for AGIs $75k-100k, 270.0% for AGIs $100k-200k, 11611.4% for AGIs over 200k)
Profit/loss from business: +$9,091 (reported on 12.3% of returns)
Here:
+$9,091
State:
+$15,671
(% of AGI for various income ranges: 109.1% for AGIs below $25k, 94.5% for AGIs $25k-50k, 161.5% for AGIs $50k-75k, 136.2% for AGIs $75k-100k, 243.4% for AGIs $100k-200k, 3482.9% for AGIs over 200k)
Taxable individual retirement arrangement distribution: $14,808 (reported on 2.9% of returns)
95961:
$14,808
California:
$23,505
(% of AGI for various income ranges: 16.7% for AGIs below $25k, 32.4% for AGIs $25k-50k, 55.5% for AGIs $50k-75k, 99.9% for AGIs $75k-100k, 249.5% for AGIs $100k-200k)
Total itemized deductions: $26,230 (reported on 9.2% of returns)
Here:
$26,230
State:
$39,517
(% of AGI for various income ranges: 25.8% for AGIs below $25k, 107.2% for AGIs $25k-50k, 412.1% for AGIs $50k-75k, 668.3% for AGIs $75k-100k, 1187.6% for AGIs $100k-200k, 4814.3% for AGIs over 200k)
Charity contributions: $4,784 (reported on 6.5% of returns)
Here:
$4,784
State:
$12,598
(% of AGI for various income ranges: 10.9% for AGIs $25k-50k, 42.0% for AGIs $50k-75k, 65.6% for AGIs $75k-100k, 195.2% for AGIs $100k-200k, 764.3% for AGIs over 200k)
Taxes paid: $8,077 (reported on 9.2% of returns)
95961:
$8,077
State:
$8,807
(% of AGI for various income ranges: 6.3% for AGIs below $25k, 30.1% for AGIs $25k-50k, 118.3% for AGIs $50k-75k, 226.3% for AGIs $75k-100k, 393.3% for AGIs $100k-200k, 1197.1% for AGIs over 200k)
Earned income credit: $2,346 (reported on 20.8% of returns)
Here:
$2,346
State:
$2,074
(% of AGI for various income ranges: 123.8% for AGIs below $25k, 94.2% for AGIs $25k-50k, 2.8% for AGIs $50k-75k)
Percentage of individuals using paid preparers for their 2020 taxes: 94.3%
Here:
94%
State:
92%
(% for various income ranges: 94.2% for AGIs below $25k, 94.4% for AGIs $25k-50k, 94.1% for AGIs $50k-75k, 95.1% for AGIs $75k-100k, 94.0% for AGIs $100k-200k, 91.7% for AGIs over 200k)
Averages for the 2012 tax year for zip code 95961, filed in 2013:
Average Adjusted Gross Income (AGI) in 2012: $41,151 (Individual Income Tax Returns)
Here:
$41,151
State:
$72,726
Salary/wage: $38,754 (reported on 89.2% of returns)
Here:
$38,754
State:
$59,079
(% of AGI for various income ranges: 78.4% for AGIs below $25k, 86.3% for AGIs $25k-50k, 86.7% for AGIs $50k-75k, 86.0% for AGIs $75k-100k, 84.8% for AGIs $100k-200k, 54.6% for AGIs over 200k)
Taxable interest for individuals: $365 (reported on 27.6% of returns)
This zip code:
$365
California:
$2,146
(% of AGI for various income ranges: 0.3% for AGIs below $25k, 0.2% for AGIs $25k-50k, 0.3% for AGIs $50k-75k, 0.3% for AGIs $75k-100k, 0.2% for AGIs $100k-200k, 0.3% for AGIs over 200k)
Ordinary dividends: $1,459 (reported on 6.2% of returns)
Here:
$1,459
State:
$9,308
(% of AGI for various income ranges: 0.3% for AGIs below $25k, 0.1% for AGIs $25k-50k, 0.2% for AGIs $50k-75k, 0.3% for AGIs $75k-100k, 0.3% for AGIs $100k-200k)
Net capital gain/loss in AGI: +$567 (reported on 5.5% of returns)
Here:
+$567
State:
+$30,460
(% of AGI for various income ranges: 0.2% for AGIs $75k-100k, 0.2% for AGIs $100k-200k)
Profit/loss from business: +$8,014 (reported on 11.6% of returns)
Here:
+$8,014
State:
+$17,064
(% of AGI for various income ranges: 6.7% for AGIs below $25k, 2.0% for AGIs $25k-50k, 1.1% for AGIs $50k-75k, 1.4% for AGIs $75k-100k, 1.9% for AGIs $100k-200k)
Taxable individual retirement arrangement distribution: $9,834 (reported on 3.9% of returns)
95961:
$9,834
California:
$19,557
(% of AGI for various income ranges: 1.0% for AGIs below $25k, 0.7% for AGIs $25k-50k, 0.8% for AGIs $50k-75k, 1.2% for AGIs $75k-100k, 1.1% for AGIs $100k-200k)
Total itemized deductions: $19,889 (27% of AGI, reported on 28.1% of returns)
Here:
$19,889
State:
$34,004
Here:
27.1% of AGI
State:
22.7% of AGI
(% of AGI for various income ranges: 6.7% for AGIs below $25k, 9.8% for AGIs $25k-50k, 14.9% for AGIs $50k-75k, 17.0% for AGIs $75k-100k, 18.5% for AGIs $100k-200k, 13.8% for AGIs over 200k)
Charity contributions: $2,177 (reported on 20.2% of returns)
Here:
$2,177
State:
$4,659
(% of AGI for various income ranges: 0.4% for AGIs below $25k, 0.8% for AGIs $25k-50k, 1.0% for AGIs $50k-75k, 1.6% for AGIs $75k-100k, 1.5% for AGIs $100k-200k, 1.2% for AGIs over 200k)
Taxes paid: $6,166 (reported on 27.9% of returns)
95961:
$6,166
State:
$14,448
(% of AGI for various income ranges: 1.7% for AGIs below $25k, 2.5% for AGIs $25k-50k, 4.1% for AGIs $50k-75k, 5.2% for AGIs $75k-100k, 6.7% for AGIs $100k-200k, 6.9% for AGIs over 200k)
Earned income credit: $2,500 (reported on 30.5% of returns)
Here:
$2,500
State:
$2,286
(% of AGI for various income ranges: 9.8% for AGIs below $25k, 2.1% for AGIs $25k-50k)
Percentage of individuals using paid preparers for their 2012 taxes: 56.6%
Here:
57%
State:
64%
(% for various income ranges: 54.9% for AGIs below $25k, 59.1% for AGIs $25k-50k, 57.1% for AGIs $50k-75k, 54.9% for AGIs $75k-100k, 56.7% for AGIs $100k-200k, 75.0% for AGIs over 200k)
Averages for the 2004 tax year for zip code 95961, filed in 2005:
Average Adjusted Gross Income (AGI) in 2004: $34,953 (Individual Income Tax Returns)
Here:
$34,953
State:
$58,600
Salary/wage: $34,007 (reported on 89.9% of returns)
Here:
$34,007
State:
$49,455
(% of AGI for various income ranges: 89.4% for AGIs below $10k, 81.8% for AGIs $10k-25k, 89.3% for AGIs $25k-50k, 89.8% for AGIs $50k-75k, 87.2% for AGIs $75k-100k, 81.8% for AGIs over 100k)
Taxable interest for individuals: $427 (reported on 31.6% of returns)
This zip code:
$427
California:
$2,365
(% of AGI for various income ranges: 2.8% for AGIs below $10k, 0.7% for AGIs $10k-25k, 0.4% for AGIs $25k-50k, 0.2% for AGIs $50k-75k, 0.2% for AGIs $75k-100k, 0.2% for AGIs over 100k)
Taxable dividends: $695 (reported on 6.4% of returns)
Here:
$695
State:
$4,746
(% of AGI for various income ranges: 0.3% for AGIs below $10k, 0.2% for AGIs $10k-25k, 0.1% for AGIs $25k-50k, 0.1% for AGIs $50k-75k, 0.1% for AGIs $75k-100k)
Net capital gain/loss: +$5,844 (reported on 6.3% of returns)
Here:
+$5,844
State:
+$23,418
(% of AGI for various income ranges: 0.8% for AGIs below $10k, 0.4% for AGIs $10k-25k, -0.0% for AGIs $25k-50k, 0.9% for AGIs $50k-75k, 0.8% for AGIs $75k-100k, 7.6% for AGIs over 100k)
Profit/loss from business: +$5,848 (reported on 11.4% of returns)
Here:
+$5,848
State:
+$16,826
(% of AGI for various income ranges: 5.6% for AGIs below $10k, 5.2% for AGIs $10k-25k, 1.8% for AGIs $25k-50k, 1.7% for AGIs $50k-75k, 0.2% for AGIs $75k-100k, -0.0% for AGIs over 100k)
IRA payment deduction: $2,136 (reported on 0.7% of returns)
95961:
$2,136
California:
$3,192
Total itemized deductions: $17,288 (30% of AGI, reported on 29.6% of returns)
Here:
$17,288
State:
$28,113
Here:
29.7% of AGI
State:
25.3% of AGI
(% of AGI for various income ranges: 8.2% for AGIs below $10k, 5.6% for AGIs $10k-25k, 12.4% for AGIs $25k-50k, 19.4% for AGIs $50k-75k, 17.7% for AGIs $75k-100k, 18.2% for AGIs over 100k)
Charity contributions deductions: $1,814 (3% of AGI, reported on 23.9% of returns)
Here:
$1,814
State:
$3,923
Here:
3.0% of AGI
State:
3.3% of AGI
(% of AGI for various income ranges: 0.6% for AGIs $10k-25k, 1.0% for AGIs $25k-50k, 1.8% for AGIs $50k-75k, 1.6% for AGIs $75k-100k, 1.5% for AGIs over 100k)
Total tax: $3,573 (reported on 67.0% of returns)
95961:
$3,573
State:
$10,761
(% of AGI for various income ranges: 1.7% for AGIs below $10k, 3.3% for AGIs $10k-25k, 5.2% for AGIs $25k-50k, 7.3% for AGIs $50k-75k, 9.8% for AGIs $75k-100k, 13.5% for AGIs over 100k)
Earned income credit: $1,813 (reported on 22.6% of returns)
Here:
$1,813
State:
$1,763
Percentage of individuals using paid preparers for their 2004 taxes: 62.3%
Here:
62%
State:
66%
(% for various income ranges: 54.7% for AGIs below $10k, 61.9% for AGIs $10k-25k, 65.4% for AGIs $25k-50k, 62.3% for AGIs $50k-75k, 69.1% for AGIs $75k-100k, 62.9% for AGIs over 100k)
Household received Food Stamps/SNAP in the past 12 months: 1,886 Household did not receive Food Stamps/SNAP in the past 12 months: 8,183
Women who had a birth in the past 12 months: 940 (518 now married, 424 unmarried) Women who did not have a birth in the past 12 months: 7,087 (3,212 now married, 3,858 unmarried)
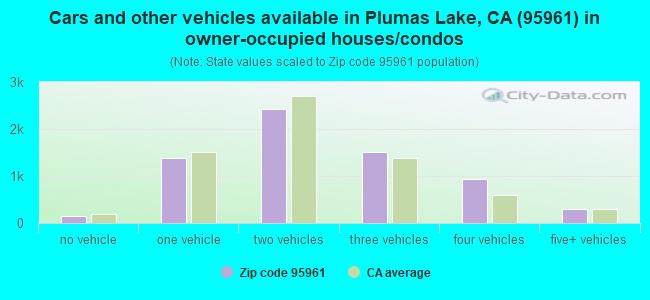
Housing units in zip code 95961 with a mortgage: 4,858 (258 second mortgage, 21 home equity loan, 187 both second mortgage and home equity loan) Houses without a mortgage: 313
Median monthly owner costs for units with a mortgage: $2,042 Median monthly owner costs for units without a mortgage: $571
Residents with income below the poverty level in 2022:
This zip code:
12.2%
Whole state:
12.2%
Residents with income below 50% of the poverty level in 2022:
This zip code:
5.5%
Whole state:
6.2%
Median number of rooms in houses and condos:
Here:
6.3
State:
6.0
Median number of rooms in apartments:
Here:
4.7
State:
3.9
Notable locations in this zip code not listed on our city pages
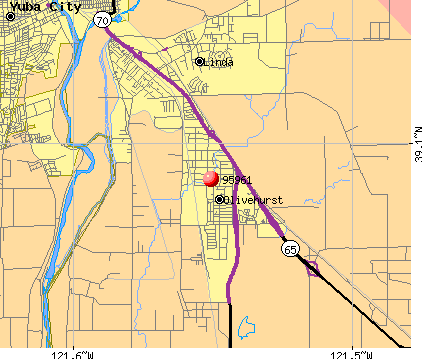
Notable locations in zip code 95961: Plumas Landing (A), Marysville Municipal Golf Course (B), Reach Air Medical Services (C), Linda Fire Protection District Station 3 (D), Linda Fire Protection District Station 2 (E), Olivehurst Public Utility District Fire Department (F). Display/hide their locations on the map
Streams, rivers, and creeks: Dry Creek (A), Grasshopper Slough (B), Hutchinson Creek (C), Yuba River (D), Bear River (E), Reeds Creek (F), Best Slough (G). Display/hide their locations on the map
6,367 married couples with children.
1,840 single-parent households (517 men, 1,323 women).
67.1% of residents of 95961 zip code speak English at home.
24.1% of residents speak Spanish at home (69% very well, 14% well, 12% not well, 6% not at all).
1.4% of residents speak other Indo-European language at home (81% very well, 13% well, 6% not at all).
6.3% of residents speak Asian or Pacific Island language at home (63% very well, 23% well, 8% not well, 6% not at all).
0.3% of residents speak other language at home (100% very well).
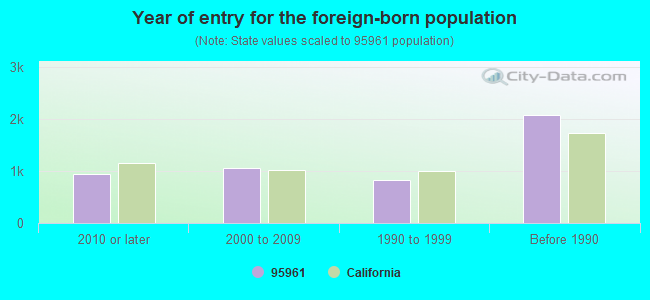
Foreign born population: 4,247 (13.1%) (62.1% of them are naturalized citizens)
This zip code:
13.1%
Whole state:
26.7%
67%Honduras
9%Indonesia
6%Singapore
3%Malaysia
2%Romania
2%Thailand
2%Lithuania
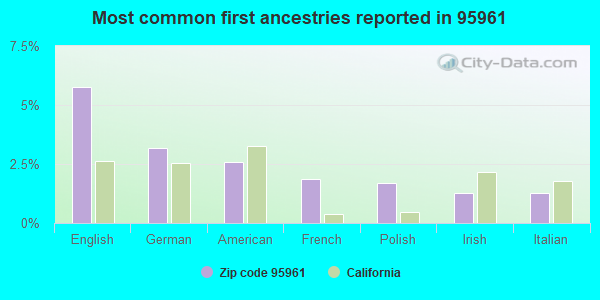
6%English
3%German
3%American
2%French
2%Polish
1%Irish
1%Italian
Year of entry for the foreign-born population
9362010 or later
1,0652000 to 2009
8241990 to 1999
2,079Before 1990
Facilities with environmental interests located in this zip code:
ELLA ELEMENTARY (4850 OLIVEHURST AVE. in OLIVEHURST, CA)
(National Center for Education Statistics) - STATE ID-6056683 Organizations: MARYSVILLE JOINT UNIFIED (SCHOOL DISTRICT)
LINDHURST HIGH (4446 OLIVE DR. in OLIVEHURST, CA)
(National Center for Education Statistics) - STATE ID-5830013 Organizations: MARYSVILLE JOINT UNIFIED (SCHOOL DISTRICT)
CECIL'S RADIATOR SHOP (5174 LINDHURST AVENUE in OLIVEHURST, CA)
SUPERFUND (Superfund database) Large Quantity Generators, more that 1000 kg of hazardous waste/month (Resource Conservation and Recovery Act (tracking hazardous waste)) - notification Organizations: CECIL SIMPSON TRUST (CONTACT/OWNER)
Alternative names: CECIL SIMPSON TRUST LUCILLE TAYLOR TRUST
LINVINGSTON'S CONCRETE SERVICE INC PLANT 4 (2572 SLAUGHTERHOUSE RD in OLIVEHURST, CA)
CRITERIA AND HAZARDOUS AIR POLLUTANT INVENTORY (Inventory of air pollution sources) TRI REPORTER (Tracking of toxic chemicals releasing facilities) Business SIC classification: READY-MIXED CONCRETE Alternative names: LINGINSTON'S CONCRETE SERVICE INC PLANT 4, LIVINGSTON'S CONCRETE, INC, LIVINGSTON'S CONCRETE SERVICE INC, LIVINGSTON'S CONCRETE SERVICE INC PLANT #4
Housing units lacking complete plumbing facilities: 0.4% Housing units lacking complete kitchen facilities: 0.5%
62.6%Utility gas
29.8%Electricity
2.6%Solar energy
1.8%Bottled, tank, or LP gas
1.2%Other fuel
1.0%No fuel used
1.0%Wood
Population in 1990: 6,418. Population change in the 1990s: +17 (+0.3%).
Place of birth for U.S.-born residents:
This state: 22,824
Northeast: 447
Midwest: 860
South: 1,819
West: 1,474
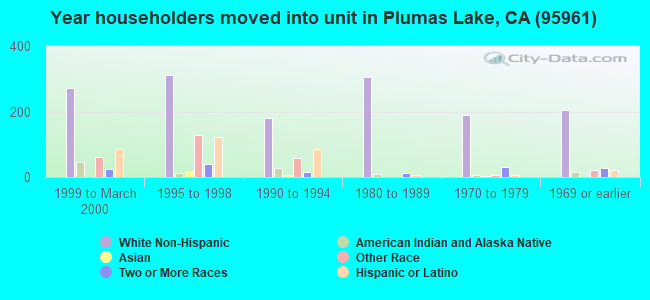
52% of the 95961 zip code residents lived in the same house 5 years ago. Out of people who lived in different houses, 69% lived in this county. Out of people who lived in different counties, 50% lived in California.
86% of the 95961 zip code residents lived in the same house 1 year ago. Out of people who lived in different houses, 43% moved from this county. Out of people who lived in different houses, 44% moved from different county within same state. Out of people who lived in different houses, 6% moved from different state. Out of people who lived in different houses, 6% moved from abroad.
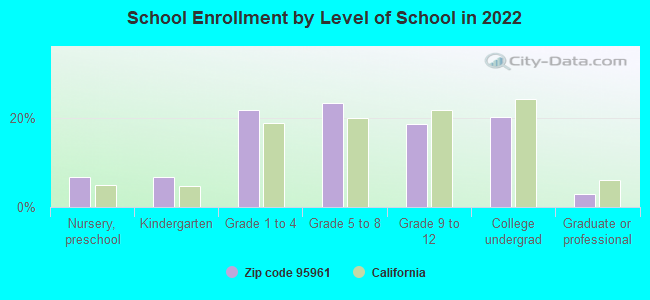
Private vs. public school enrollment:
Students in private schools in grades 1 to 8 (elementary and middle school): 422
Here:
10.0%
California:
10.5%
Students in private schools in grades 9 to 12 (high school): 70
Here:
4.0%
California:
8.5%
Students in private undergraduate colleges: 146
Here:
7.8%
California:
15.9%
Occupation by median earnings in the past 12 months ($)
121,186Health diagnosing and treating practitioners and other technical occupations
107,646Law enforcement workers including supervisors
92,300Life, physical, and social science occupations
84,988Architecture and engineering occupations
82,384Fire fighting and prevention, and other protective service workers including supervisors
81,032Computer and mathematical occupations
Top industries in this zip code by the number of employees in 2005:
Health Care and Social Assistance: Offices of Physicians (except Mental Health Specialists) (20-49 employees: 1 establishment)
Construction: Power and Communication Line and Related Structures Construction (20-49: 1)
Construction: New Single-Family Housing Construction (except Operative Builders) (20-49: 1)
Health Care and Social Assistance: Child Day Care Services (20-49: 1)
Health Care and Social Assistance: Offices of Dentists (10-19: 1)
People in group quarters in 2010:
46 people in group homes intended for adults
People in group quarters in 2000:
26 people in other nonhousehold living situations
23 people in homes for the mentally retarded
9 people in other workers' dormitories
5 people in other noninstitutional group quarters
Fatal accident statistics in 2013:
Fatal accident count: 1
Vehicles involved in fatal accidents: 1
Fatal accidents caused by drunken drivers: 1
Fatalities: 1
Persons involved in fatal accidents: 2
Pedestrians involved in fatal accidents: 0
Fatal accident statistics in 2012:
Fatal accident count: 4
Vehicles involved in fatal accidents: 5
Fatal accidents caused by drunken drivers: 3
Fatalities: 4
Persons involved in fatal accidents: 9
Pedestrians involved in fatal accidents: 0
2005 - 2018 National Fire Incident Reporting System (NFIRS) incidents
According to the data from the years 2005 - 2018 the average number of fires per year is 58. The highest number of fires - 147 took place in 2008, and the least - 0 in 2013. The data has a declining trend.
When looking into fire subcategories, the most reports belonged to: Outside Fires (60.8%), and Structure Fires (22.9%).
Fire incident types reported to NFIRS in Zip Code 95961
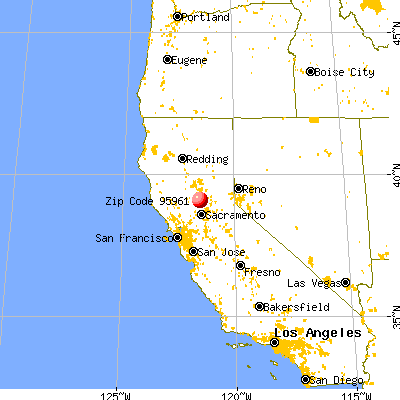


 Nearest zip codes: 95991, 95674, 95993, 95692, 95901, 95659.
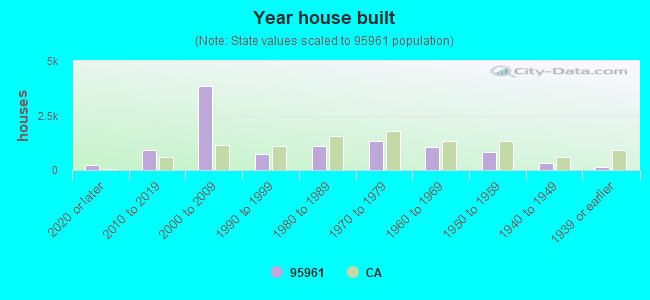


 According to the data from the years 2005 - 2018 the average number of fires per year is 58. The highest number of fires - 147 took place in 2008, and the least - 0 in 2013. The data has a declining trend.
 When looking into fire subcategories, the most reports belonged to: Outside Fires (60.8%), and Structure Fires (22.9%).