Estimated zip code population in 2022: 7,260 Zip code population in 2010: 7,165 Zip code population in 2000: 7,295
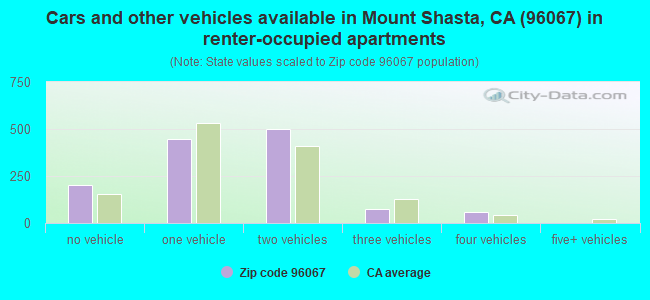
Houses and condos: 4,470 Renter-occupied apartments: 1,287
% of renters here:
35%
State:
44%
March 2022 cost of living index in zip code 96067: 95.1 (less than average, U.S. average is 100)
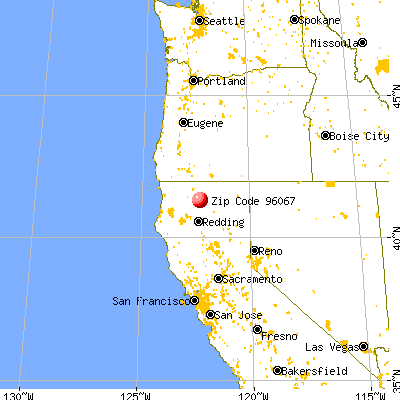
Land area: 135.8 sq. mi. Water area: 0.9 sq. mi.
Population density: 53 people per square mile
(very low).
OSM Map
General Map
Google Map
MSN Map
OSM Map
General Map
Google Map
MSN Map
OSM Map
General Map
Google Map
MSN Map
OSM Map
General Map
Google Map
MSN Map
Please wait while loading the map...
Real estate property taxes paid for housing units in 2022:
This zip code:
0.7% ($2,494)
California:
0.7% ($4,831)
Median real estate property taxes paid for housing units with mortgages in 2022: $2,769 (0.7%) Median real estate property taxes paid for housing units with no mortgage in 2022: $2,317 (0.7%)
Business Search- 14 Million verified businesses
Males: 3,598
(49.6%)
Females: 3,662
(50.4%)
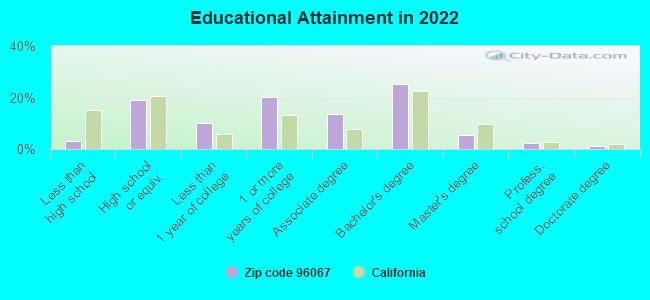
For population 25 years and over in 96067:
High school or higher: 96.5%
Bachelor's degree or higher: 34.1%
Graduate or professional degree: 9.1%
Unemployed: 2.6%
Mean travel time to work (commute): 15.9 minutes
For population 15 years and over in 96067:
Never married: 23.2%
Now married: 56.7%
Separated: 1.7%
Widowed: 9.3%
Divorced: 9.1%
Zip code 96067 compared to state average:
Median household income below state average.
Median house value below state average.
Unemployed percentage below state average.
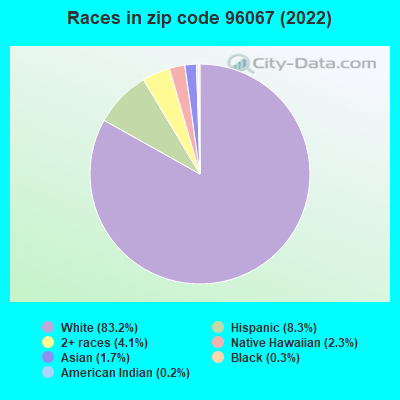
Black race population percentage significantly below state average.
Hispanic race population percentage significantly below state average.
Median age significantly above state average.
Foreign-born population percentage significantly below state average.
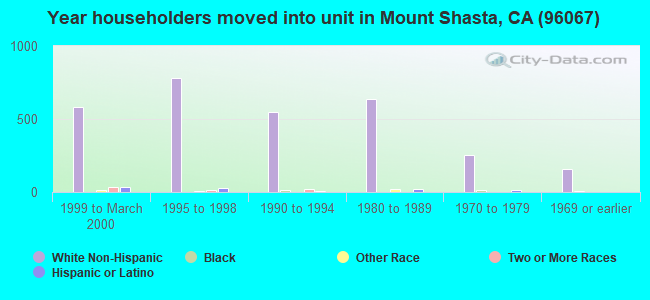
Length of stay since moving in significantly above state average.
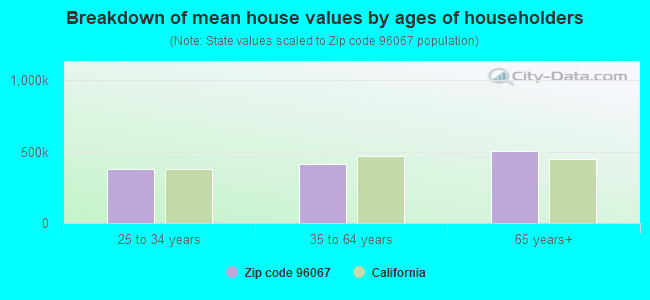
Estimated median house/condo value in 2022: $380,481
96067:
$380,481
California:
$715,900
According to our research of California and other state lists, there were 12 registered sex offenders living in 96067 zip code as of May 28, 2024. The ratio of all residents to sex offenders in zip code 96067 is 577 to 1. The ratio of registered sex offenders to all residents in this zip code is near the state average.
Median resident age:
This zip code:
52.0 years
California median age:
37.9 years
Average household size:
This zip code:
1.9 people
California:
2.8 people
Averages for the 2020 tax year for zip code 96067, filed in 2021:
Average Adjusted Gross Income (AGI) in 2020: $69,807 (Individual Income Tax Returns)
Here:
$69,807
State:
$95,910
Salary/wage: $53,195 (reported on 66.1% of returns)
Here:
$53,195
State:
$77,331
(% of AGI for various income ranges: 1071.4% for AGIs below $25k, 3174.1% for AGIs $25k-50k, 5891.6% for AGIs $50k-75k, 8376.7% for AGIs $75k-100k, 18247.6% for AGIs $100k-200k, 63732.5% for AGIs over 200k)
Taxable interest for individuals: $1,744 (reported on 45.1% of returns)
This zip code:
$1,744
California:
$2,294
(% of AGI for various income ranges: 49.1% for AGIs below $25k, 95.1% for AGIs $25k-50k, 142.2% for AGIs $50k-75k, 105.0% for AGIs $75k-100k, 262.8% for AGIs $100k-200k, 1867.5% for AGIs over 200k)
Ordinary dividends: $6,735 (reported on 26.8% of returns)
Here:
$6,735
State:
$10,949
(% of AGI for various income ranges: 61.1% for AGIs below $25k, 146.9% for AGIs $25k-50k, 215.6% for AGIs $50k-75k, 533.9% for AGIs $75k-100k, 558.8% for AGIs $100k-200k, 5937.5% for AGIs over 200k)
Net capital gain/loss in AGI: +$21,290 (reported on 27.6% of returns)
Here:
+$21,290
State:
+$49,306
(% of AGI for various income ranges: 41.9% for AGIs below $25k, 105.3% for AGIs $25k-50k, 211.9% for AGIs $50k-75k, 425.0% for AGIs $75k-100k, 1226.4% for AGIs $100k-200k, 40410.0% for AGIs over 200k)
Profit/loss from business: +$19,196 (reported on 22.1% of returns)
Here:
+$19,196
State:
+$15,671
(% of AGI for various income ranges: 209.6% for AGIs below $25k, 455.5% for AGIs $25k-50k, 710.6% for AGIs $50k-75k, 711.7% for AGIs $75k-100k, 1201.2% for AGIs $100k-200k, 13002.5% for AGIs over 200k)
Taxable individual retirement arrangement distribution: $17,735 (reported on 13.4% of returns)
96067:
$17,735
California:
$23,505
(% of AGI for various income ranges: 78.1% for AGIs below $25k, 211.6% for AGIs $25k-50k, 329.4% for AGIs $50k-75k, 783.9% for AGIs $75k-100k, 1078.0% for AGIs $100k-200k, 4760.0% for AGIs over 200k)
Self-employed (Keogh) retirement plans: $22,600 (reported on 1.1% of returns)
96067:
$22,600
California:
$30,163
(% of AGI for various income ranges: 51.4% for AGIs $25k-50k, 256.8% for AGIs $100k-200k)
Total itemized deductions: $30,935 (reported on 10.9% of returns)
Here:
$30,935
State:
$39,517
(% of AGI for various income ranges: 91.7% for AGIs below $25k, 245.5% for AGIs $25k-50k, 512.2% for AGIs $50k-75k, 751.1% for AGIs $75k-100k, 1662.8% for AGIs $100k-200k, 8330.0% for AGIs over 200k)
Charity contributions: $11,267 (reported on 8.2% of returns)
Here:
$11,267
State:
$12,598
(% of AGI for various income ranges: 41.4% for AGIs $25k-50k, 67.2% for AGIs $50k-75k, 117.8% for AGIs $75k-100k, 288.0% for AGIs $100k-200k, 5055.0% for AGIs over 200k)
Taxes paid: $7,322 (reported on 10.9% of returns)
96067:
$7,322
State:
$8,807
(% of AGI for various income ranges: 17.9% for AGIs below $25k, 47.1% for AGIs $25k-50k, 118.1% for AGIs $50k-75k, 185.0% for AGIs $75k-100k, 507.2% for AGIs $100k-200k, 1462.5% for AGIs over 200k)
Earned income credit: $1,679 (reported on 11.5% of returns)
Here:
$1,679
State:
$2,074
(% of AGI for various income ranges: 62.6% for AGIs below $25k, 52.4% for AGIs $25k-50k)
Percentage of individuals using paid preparers for their 2020 taxes: 93.4%
Here:
93%
State:
92%
(% for various income ranges: 91.7% for AGIs below $25k, 93.8% for AGIs $25k-50k, 92.7% for AGIs $50k-75k, 97.1% for AGIs $75k-100k, 94.7% for AGIs $100k-200k, 94.4% for AGIs over 200k)
Averages for the 2012 tax year for zip code 96067, filed in 2013:
Average Adjusted Gross Income (AGI) in 2012: $51,018 (Individual Income Tax Returns)
Here:
$51,018
State:
$72,726
Salary/wage: $40,219 (reported on 70.3% of returns)
Here:
$40,219
State:
$59,079
(% of AGI for various income ranges: 56.6% for AGIs below $25k, 60.5% for AGIs $25k-50k, 60.3% for AGIs $50k-75k, 54.6% for AGIs $75k-100k, 58.6% for AGIs $100k-200k, 39.6% for AGIs over 200k)
Taxable interest for individuals: $1,814 (reported on 45.0% of returns)
This zip code:
$1,814
California:
$2,146
(% of AGI for various income ranges: 2.3% for AGIs below $25k, 1.6% for AGIs $25k-50k, 1.3% for AGIs $50k-75k, 1.6% for AGIs $75k-100k, 1.4% for AGIs $100k-200k, 1.7% for AGIs over 200k)
Ordinary dividends: $4,498 (reported on 24.7% of returns)
Here:
$4,498
State:
$9,308
(% of AGI for various income ranges: 3.1% for AGIs below $25k, 2.1% for AGIs $25k-50k, 2.0% for AGIs $50k-75k, 2.6% for AGIs $75k-100k, 2.1% for AGIs $100k-200k, 1.5% for AGIs over 200k)
Net capital gain/loss in AGI: +$10,972 (reported on 22.1% of returns)
Here:
+$10,972
State:
+$30,460
(% of AGI for various income ranges: 1.5% for AGIs $50k-75k, 1.4% for AGIs $75k-100k, 4.3% for AGIs $100k-200k, 21.4% for AGIs over 200k)
Profit/loss from business: +$13,445 (reported on 25.0% of returns)
Here:
+$13,445
State:
+$17,064
(% of AGI for various income ranges: 15.6% for AGIs below $25k, 8.6% for AGIs $25k-50k, 5.4% for AGIs $50k-75k, 4.6% for AGIs $75k-100k, 4.5% for AGIs $100k-200k, 5.8% for AGIs over 200k)
Taxable individual retirement arrangement distribution: $13,193 (reported on 13.2% of returns)
96067:
$13,193
California:
$19,557
(% of AGI for various income ranges: 3.4% for AGIs below $25k, 4.0% for AGIs $25k-50k, 4.0% for AGIs $50k-75k, 4.0% for AGIs $75k-100k, 4.4% for AGIs $100k-200k)
Self-employment retirement plans: $15,575 (reported on 1.2% of returns)
96067:
$15,575
California:
$24,530
Total itemized deductions: $23,917 (27% of AGI, reported on 33.8% of returns)
Here:
$23,917
State:
$34,004
Here:
26.6% of AGI
State:
22.7% of AGI
(% of AGI for various income ranges: 15.3% for AGIs below $25k, 14.3% for AGIs $25k-50k, 13.6% for AGIs $50k-75k, 15.7% for AGIs $75k-100k, 18.7% for AGIs $100k-200k, 15.8% for AGIs over 200k)
Charity contributions: $3,769 (reported on 27.9% of returns)
Here:
$3,769
State:
$4,659
(% of AGI for various income ranges: 1.2% for AGIs below $25k, 1.2% for AGIs $25k-50k, 1.6% for AGIs $50k-75k, 2.0% for AGIs $75k-100k, 2.2% for AGIs $100k-200k, 3.8% for AGIs over 200k)
Taxes paid: $7,741 (reported on 33.5% of returns)
96067:
$7,741
State:
$14,448
(% of AGI for various income ranges: 2.7% for AGIs below $25k, 3.1% for AGIs $25k-50k, 3.7% for AGIs $50k-75k, 4.7% for AGIs $75k-100k, 6.8% for AGIs $100k-200k, 7.8% for AGIs over 200k)
Earned income credit: $1,658 (reported on 17.4% of returns)
Here:
$1,658
State:
$2,286
(% of AGI for various income ranges: 4.6% for AGIs below $25k, 0.8% for AGIs $25k-50k)
Percentage of individuals using paid preparers for their 2012 taxes: 56.5%
Here:
56%
State:
64%
(% for various income ranges: 46.1% for AGIs below $25k, 56.4% for AGIs $25k-50k, 63.3% for AGIs $50k-75k, 71.0% for AGIs $75k-100k, 69.7% for AGIs $100k-200k, 87.5% for AGIs over 200k)
Averages for the 2004 tax year for zip code 96067, filed in 2005:
Average Adjusted Gross Income (AGI) in 2004: $42,173 (Individual Income Tax Returns)
Here:
$42,173
State:
$58,600
Salary/wage: $33,969 (reported on 74.1% of returns)
Here:
$33,969
State:
$49,455
(% of AGI for various income ranges: 154.3% for AGIs below $10k, 58.5% for AGIs $10k-25k, 65.8% for AGIs $25k-50k, 65.3% for AGIs $50k-75k, 70.0% for AGIs $75k-100k, 45.1% for AGIs over 100k)
Taxable interest for individuals: $2,147 (reported on 55.1% of returns)
This zip code:
$2,147
California:
$2,365
(% of AGI for various income ranges: 15.9% for AGIs below $10k, 4.3% for AGIs $10k-25k, 2.3% for AGIs $25k-50k, 2.1% for AGIs $50k-75k, 3.3% for AGIs $75k-100k, 2.3% for AGIs over 100k)
Taxable dividends: $3,102 (reported on 31.0% of returns)
Here:
$3,102
State:
$4,746
(% of AGI for various income ranges: 11.2% for AGIs below $10k, 2.9% for AGIs $10k-25k, 2.2% for AGIs $25k-50k, 1.7% for AGIs $50k-75k, 2.0% for AGIs $75k-100k, 2.3% for AGIs over 100k)
Net capital gain/loss: +$13,549 (reported on 29.1% of returns)
Here:
+$13,549
State:
+$23,418
(% of AGI for various income ranges: -1.5% for AGIs below $10k, 2.9% for AGIs $10k-25k, 2.5% for AGIs $25k-50k, 2.4% for AGIs $50k-75k, 4.4% for AGIs $75k-100k, 21.9% for AGIs over 100k)
Profit/loss from business: +$15,227 (reported on 25.0% of returns)
Here:
+$15,227
State:
+$16,826
(% of AGI for various income ranges: 10.5% for AGIs below $10k, 11.1% for AGIs $10k-25k, 7.4% for AGIs $25k-50k, 7.8% for AGIs $50k-75k, 4.3% for AGIs $75k-100k, 11.9% for AGIs over 100k)
IRA payment deduction: $3,506 (reported on 4.8% of returns)
96067:
$3,506
California:
$3,192
(% of AGI for various income ranges: 0.4% for AGIs $10k-25k, 0.7% for AGIs $25k-50k, 0.5% for AGIs $50k-75k, 0.2% for AGIs $75k-100k, 0.2% for AGIs over 100k)
Self-employed pension: $13,556 (reported on 1.7% of returns)
Here:
$13,556
California:
$17,688
Total itemized deductions: $19,788 (26% of AGI, reported on 35.7% of returns)
Here:
$19,788
State:
$28,113
Here:
25.6% of AGI
State:
25.3% of AGI
(% of AGI for various income ranges: 33.1% for AGIs below $10k, 15.7% for AGIs $10k-25k, 15.6% for AGIs $25k-50k, 17.3% for AGIs $50k-75k, 19.3% for AGIs $75k-100k, 15.6% for AGIs over 100k)
Charity contributions deductions: $2,754 (3% of AGI, reported on 30.7% of returns)
Here:
$2,754
State:
$3,923
Here:
3.4% of AGI
State:
3.3% of AGI
(% of AGI for various income ranges: 1.7% for AGIs below $10k, 1.1% for AGIs $10k-25k, 1.7% for AGIs $25k-50k, 1.9% for AGIs $50k-75k, 2.2% for AGIs $75k-100k, 2.4% for AGIs over 100k)
Total tax: $6,263 (reported on 76.8% of returns)
96067:
$6,263
State:
$10,761
(% of AGI for various income ranges: 6.8% for AGIs below $10k, 5.4% for AGIs $10k-25k, 7.5% for AGIs $25k-50k, 9.3% for AGIs $50k-75k, 10.7% for AGIs $75k-100k, 17.2% for AGIs over 100k)
Earned income credit: $1,299 (reported on 14.8% of returns)
Here:
$1,299
State:
$1,763
Percentage of individuals using paid preparers for their 2004 taxes: 62.4%
Here:
62%
State:
66%
(% for various income ranges: 51.0% for AGIs below $10k, 61.0% for AGIs $10k-25k, 62.5% for AGIs $25k-50k, 69.4% for AGIs $50k-75k, 69.0% for AGIs $75k-100k, 82.4% for AGIs over 100k)
Likely homosexual households (counted as self-reported same-sex unmarried-partner households)
Lesbian couples: 0.0% of all households
Gay men: 0.3% of all households
Household received Food Stamps/SNAP in the past 12 months: 427 Household did not receive Food Stamps/SNAP in the past 12 months: 3,257
Women who did not have a birth in the past 12 months: 1,184 (710 now married, 464 unmarried)
Housing units in zip code 96067 with a mortgage: 979 (104 second mortgage, 108 both second mortgage and home equity loan) Median monthly owner costs for units with a mortgage: $1,876 Median monthly owner costs for units without a mortgage: $658
Residents with income below the poverty level in 2022:
This zip code:
10.7%
Whole state:
12.2%
Residents with income below 50% of the poverty level in 2022:
This zip code:
6.5%
Whole state:
6.2%
Median number of rooms in houses and condos:
Here:
5.5
State:
6.0
Median number of rooms in apartments:
Here:
4.1
State:
3.9
Notable locations in this zip code not listed on our city pages
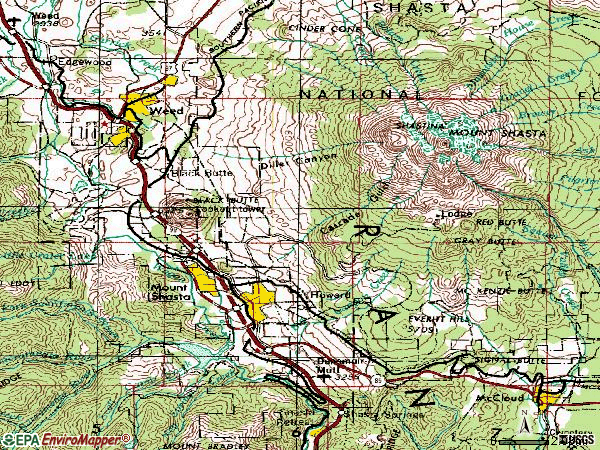
Notable locations in zip code 96067: Pierce (A), Mount Shasta State Fish Hatchery (B), McBride Springs Campground (C), Lake Siskiyou Campground (D), Wyehka Lodge (E), Black Butte Trailhead Parking (F), Big Canon (G), Ney Springs (H), Small (I), Shasta Alpine Lodge (J), Sisson Museum (K), Mount Shasta City Hall (L), Mount Shasta Branch Siskiyou County Public Library (M), Mount Shasta Fire Protection District Station 1 (N), Mount Shasta Ambulance (O), Mount Shasta Fire Protection District Station 2 (P), Mount Shasta City Fire Department Station 2 (Q), Mount Shasta City Fire Department Station 1 (R). Display/hide their locations on the map
Churches in zip code 96067 include: Saint Anthonys Catholic Church (A), Kingdom Hall of Jehovahs Witnesses (B), Church of the Nazarene (C), The Church of Jesus Christ of Latter Day Saints (D), Church of Christ (E). Display/hide their locations on the map
Lakes and reservoirs: Durney Lake (A), Toad Lake (B), Dobkins Lake (C), Abrams Lake (D), Porcupine Lake (E), Chipmunk Lake (F), Little Crater Lake (G), Browns Lake (H). Display/hide their locations on the map
Rivers and creeks: Fawn Creek (A), Stink Creek (B), South Fork Sacramento River (C), Scott Camp Creek (D), North Fork Sacramento River (E), Ney Springs Creek (F), Middle Fork Sacramento River (G), Hedge Creek (H), Deer Creek (I). Display/hide their locations on the map
In group quarters: 81 (-1 institutionalized population)
Size of family households: 1,462 2-persons, 179 3-persons, 368 4-persons, 113 5-persons, 24 6-persons, 2 7-or-more-persons
Size of nonfamily households: 1,378 1-person, 194 2-persons
823 married couples with children.
347 single-parent households (92 men, 255 women).
90.1% of residents of 96067 zip code speak English at home.
5.9% of residents speak Spanish at home (69% very well, 31% well).
1.1% of residents speak other Indo-European language at home (79% very well, 21% not well).
3.1% of residents speak Asian or Pacific Island language at home (61% very well, 13% well, 3% not well, 23% not at all).
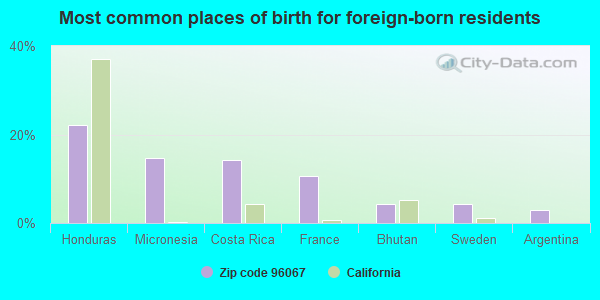
Foreign born population: 733 (10.1%) (76.7% of them are naturalized citizens)
This zip code:
10.1%
Whole state:
26.7%
22%Honduras
15%Micronesia
14%Costa Rica
11%France
4%Bhutan
4%Sweden
3%Argentina
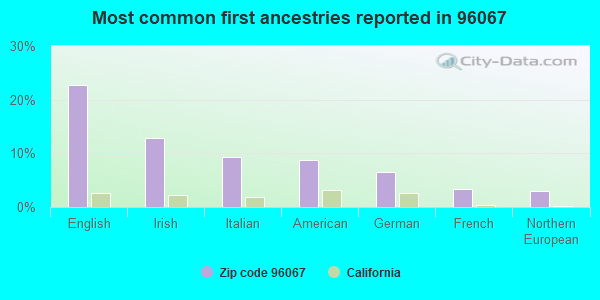
23%English
13%Irish
9%Italian
9%American
7%German
3%French
3%Northern European
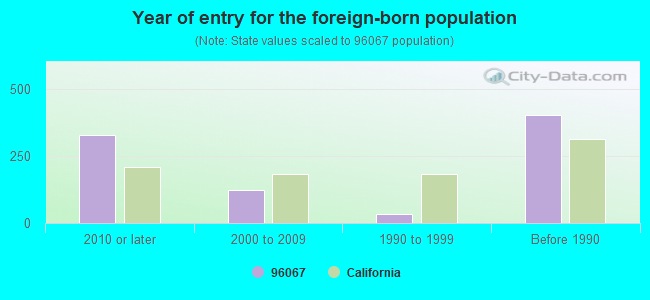
Year of entry for the foreign-born population
3282010 or later
1222000 to 2009
331990 to 1999
404Before 1990
Facilities with environmental interests located in this zip code:
HEADWATERS COMMUNITY DAY (595 E. ALMA ST. in MOUNT SHASTA, CA)
(National Center for Education Statistics) - STATE ID-6114425 Organizations: MT. SHASTA UNION ELEMENTARY (SCHOOL DISTRICT)
JEFFERSON HIGH (CONT.) (720 ROCKFELLOW DR. in MOUNT SHASTA, CA)
(National Center for Education Statistics) - STATE ID-4730057 Organizations: SISKIYOU UNION HIGH (SCHOOL DISTRICT)
CHALLENGE HOME CHARTER (601 E ALMA ST. in MOUNT SHASTA, CA)
(National Center for Education Statistics) - STATE ID-6115489 Organizations: MT. SHASTA UNION ELEMENTARY (SCHOOL DISTRICT)
MT SHASTA OPTIONS FOR YOUTH CHARTER (510 N. MOUNT SHASTA BLVD. in MOUNT SHASTA, CA)
(National Center for Education Statistics) - STATE ID-6115497 Organizations: MT. SHASTA UNION ELEMENTARY (SCHOOL DISTRICT)
MT. SHASTA ELEMENTARY (501 CEDAR ST. in MOUNT SHASTA, CA)
(National Center for Education Statistics) - STATE ID-6050884 Organizations: MT. SHASTA UNION ELEMENTARY (SCHOOL DISTRICT)
MT. SHASTA HIGH (710 EVERITT MEMORIAL HWY. in MOUNT SHASTA, CA)
(National Center for Education Statistics) - STATE ID-4735403 Organizations: SISKIYOU UNION HIGH (SCHOOL DISTRICT)
CALTRANS MT SHASTA MAINTENANCE STATION (1625 MOTT RD in MT SHASTA, CA)
Large Quantity Generators, more that 1000 kg of hazardous waste/month (Resource Conservation and Recovery Act (tracking hazardous waste)) Organizations: CALIFORNIA DOT (CONTACT/OPERATOR)
CCDA WATERS LLC (1400 SPRING HILL RD in MOUNT SHASTA CITY, CA)
Large Quantity Generators, more that 1000 kg of hazardous waste/month (Resource Conservation and Recovery Act (tracking hazardous waste))
MT SHASTA FISH HATCHERY (3N OLD STAGE RD in MT SHASTA, CA)
National Pollutant Discharge Elimination System NON-MAJOR (Tracking pollutant discharge elimination systems) - permit Business SIC classification: FISH HATCHERIES AND PRESERVES Organizations: CA DEPT OF FISH & GAME (CONTACT/OWNER)
Alternative names: CA DEPT OF FISH & GAME
MT SHASTA STP (1551 S OLD STAGE RD in MOUNT SHASTA, CA)
National Pollutant Discharge Elimination System NON-MAJOR (Tracking pollutant discharge elimination systems) - permit Business SIC classification: SEWERAGE SYSTEMS Organizations: MT SHASTA, CITY OF (CONTACT/OWNER)
Alternative names: MT SHASTA, CITY OF
CAL TRANS MT SHASTA (1500 MOTT RD in MT SHASTA, CA)
Small Quantity Generators, between 100 kg and 1000 kg of hazardous waste/month (Resource Conservation and Recovery Act (tracking hazardous waste)) Organizations: CALTRAN DIST 2 (CONTACT/OWNER)
MT SHASTA CLEANERS (110 SISQUYOU AVE in MOUNT SHASTA, CA)
Small Quantity Generators, between 100 kg and 1000 kg of hazardous waste/month (Resource Conservation and Recovery Act (tracking hazardous waste))
Housing units lacking complete plumbing facilities: 1.6% Housing units lacking complete kitchen facilities: 1.2%
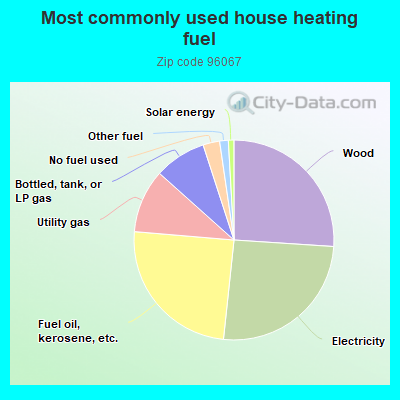
26.1%Wood
25.7%Electricity
24.7%Fuel oil, kerosene, etc.
10.3%Utility gas
8.4%Bottled, tank, or LP gas
2.7%No fuel used
1.4%Other fuel
0.9%Solar energy
Population in 1990: 6,719. Population change in the 1990s: +576 (+8.6%).
Place of birth for U.S.-born residents:
This state: 4,695
Northeast: 218
Midwest: 572
South: 325
West: 541
58% of the 96067 zip code residents lived in the same house 5 years ago. Out of people who lived in different houses, 51% lived in this county. Out of people who lived in different counties, 50% lived in California.
89% of the 96067 zip code residents lived in the same house 1 year ago. Out of people who lived in different houses, 29% moved from this county. Out of people who lived in different houses, 67% moved from different county within same state. Out of people who lived in different houses, 5% moved from different state.
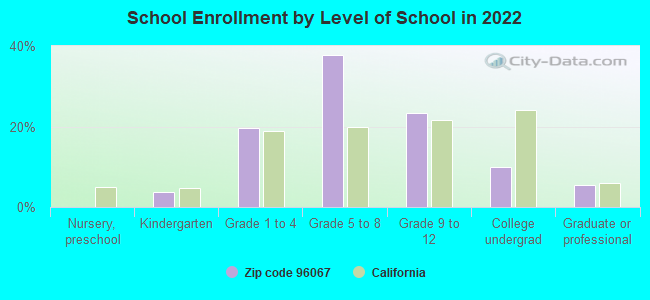
Private vs. public school enrollment:
Students in private schools in grades 1 to 8 (elementary and middle school): 121
Here:
15.0%
California:
10.5%
Students in private schools in grades 9 to 12 (high school): 16
Here:
5.0%
California:
8.5%
Students in private undergraduate colleges: 24
Here:
17.8%
California:
15.9%
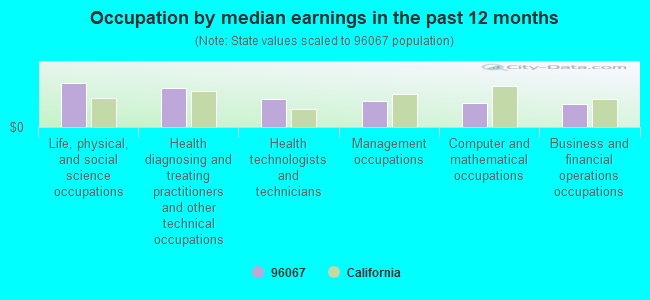
Occupation by median earnings in the past 12 months ($)
114,728Life, physical, and social science occupations
101,676Health diagnosing and treating practitioners and other technical occupations
73,802Health technologists and technicians
68,205Management occupations
62,340Computer and mathematical occupations
60,614Business and financial operations occupations
Companies with federal contracts located in this zip code:
WHOLESALE SOLAR (432 OM SHASTA PATH in MOUNT SHASTA, CA; small business)
$35,679 with Navy for Electrical and Electronic assemblies, Boards, Cards, and Associated Hardware. Signed on 2004-02-03. Completion date: 2004-02-10.
LANGUAGE QUEST (309 N MOUNT SHASTA BLVD in MOUNT SHASTA, CA; small business)
$2,838 with Air Force for Training Aids. Signed on 2005-09-26. Completion date: 2005-10-24.
Top industries in this zip code by the number of employees in 2005:
Health Care and Social Assistance: General Medical and Surgical Hospitals (250-499 employees: 1 establishment)
Accommodation and Food Services: Hotels (except Casino Hotels) and Motels (20-49: 2, 5-9: 2, 1-4: 3)
Health Care and Social Assistance: Offices of Physicians (except Mental Health Specialists) (10-19: 3, 5-9: 3, 1-4: 8)
Health Care and Social Assistance: Vocational Rehabilitation Services (50-99: 1)
Other Services (except Public Administration): Religious Organizations (20-49: 1, 10-19: 1, 5-9: 1, 1-4: 3)
People in group quarters in 2010:
30 people in nursing facilities/skilled-nursing facilities
26 people in other noninstitutional facilities
6 people in group homes intended for adults
People in group quarters in 2000:
38 people in religious group quarters
30 people in hospitals/wards and hospices for chronically ill
30 people in other hospitals or wards for chronically ill
16 people in nursing homes
2 people in other group homes
Fatal accident statistics in 2014:
Fatal accident count: 2
Vehicles involved in fatal accidents: 2
Fatal accidents caused by drunken drivers: 0
Fatalities: 2
Persons involved in fatal accidents: 3
Pedestrians involved in fatal accidents: 0
Fatal accident statistics in 2013:
Fatal accident count: 1
Vehicles involved in fatal accidents: 1
Fatal accidents caused by drunken drivers: 0
Fatalities: 1
Persons involved in fatal accidents: 2
Pedestrians involved in fatal accidents: 0
2004 - 2018 National Fire Incident Reporting System (NFIRS) incidents
According to the data from the years 2004 - 2018 the average number of fires per year is 53. The highest number of reported fires - 113 took place in 2017, and the least - 11 in 2008. The data has a growing trend.
When looking into fire subcategories, the most incidents belonged to: Outside Fires (41.4%), and Structure Fires (36.5%).
Fire incident types reported to NFIRS in Zip Code 96067


 Nearest zip codes: 96025, 96094, 96034, 96017, 96038, 96051.


 According to the data from the years 2004 - 2018 the average number of fires per year is 53. The highest number of reported fires - 113 took place in 2017, and the least - 11 in 2008. The data has a growing trend.
 When looking into fire subcategories, the most incidents belonged to: Outside Fires (41.4%), and Structure Fires (36.5%).