Estimated zip code population in 2022: 2,722 Zip code population in 2010: 3,292 Zip code population in 2000: 2,716
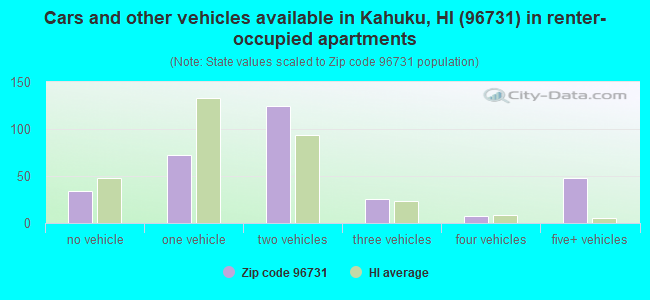
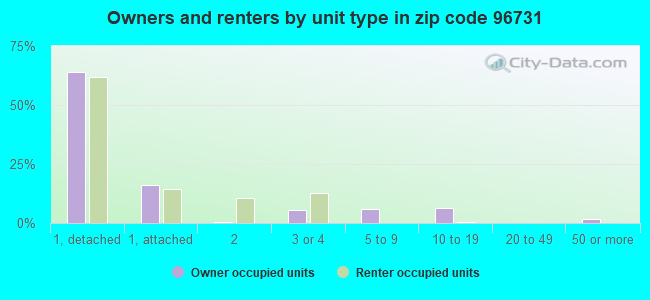
Houses and condos: 1,321 Renter-occupied apartments: 302
% of renters here:
37%
State:
37%
March 2022 cost of living index in zip code 96731: 135.8 (high, U.S. average is 100)
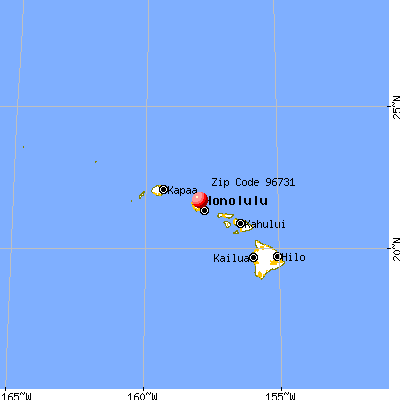
Land area: 19.4 sq. mi. Water area: 6.0 sq. mi.
Population density: 140 people per square mile
(very low).
OSM Map
General Map
Google Map
MSN Map
OSM Map
General Map
Google Map
MSN Map
OSM Map
General Map
Google Map
MSN Map
OSM Map
General Map
Google Map
MSN Map
Please wait while loading the map...
Real estate property taxes paid for housing units in 2022:
This zip code:
0.3% ($2,287)
Hawaii:
0.3% ($2,092)
Median real estate property taxes paid for housing units with mortgages in 2022: $2,244 (0.3%) Median real estate property taxes paid for housing units with no mortgage in 2022: $2,320 (0.3%)
Business Search- 14 Million verified businesses
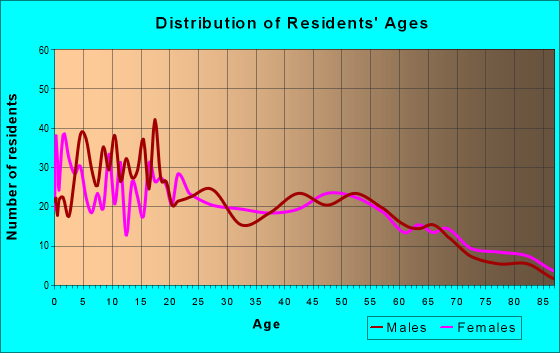
Males: 1,231
(45.2%)
Females: 1,491
(54.8%)
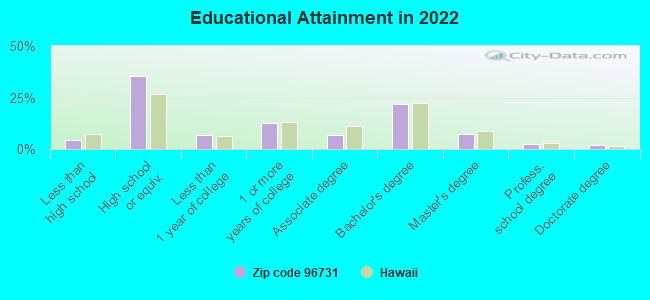
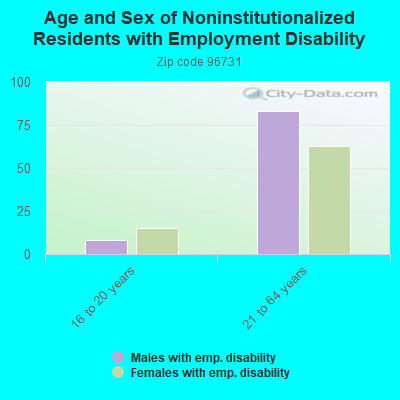
For population 25 years and over in 96731:
High school or higher: 94.6%
Bachelor's degree or higher: 33.6%
Graduate or professional degree: 11.8%
Unemployed: 7.6%
Mean travel time to work (commute): 33.5 minutes
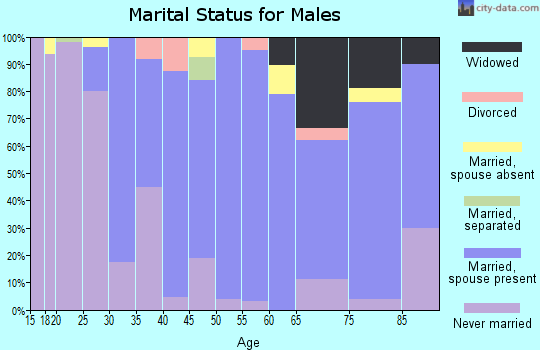
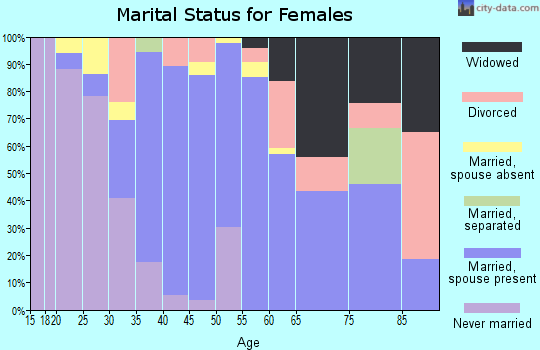
For population 15 years and over in 96731:
Never married: 30.6%
Now married: 54.8%
Separated: 0.5%
Widowed: 4.1%
Divorced: 10.0%
Zip code 96731 compared to state average:
Unemployed percentage above state average.
Median age below state average.
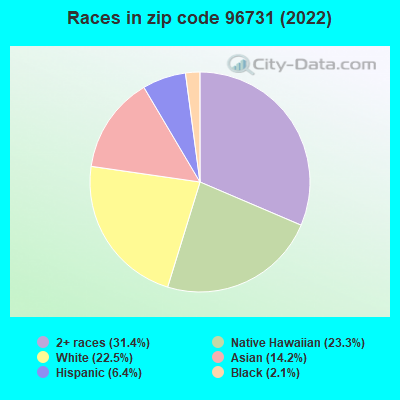
85531.4%Two or more races
63323.3%Native Hawaiian and Other Pacific Islander
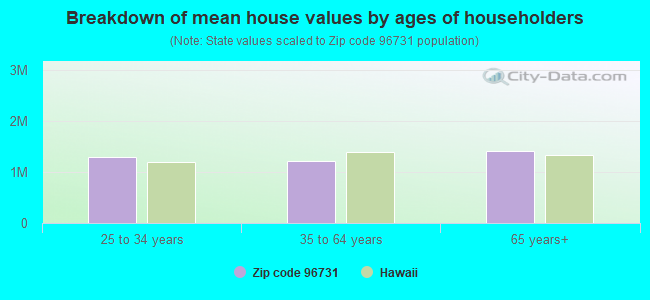
Estimated median house/condo value in 2022: $752,223
96731:
$752,223
Hawaii:
$820,100
According to our research of Hawaii and other state lists, there were 3 registered sex offenders living in 96731 zip code as of May 17, 2024. The ratio of all residents to sex offenders in zip code 96731 is 1,080 to 1. The ratio of registered sex offenders to all residents in this zip code is lower than the state average.
Median resident age:
This zip code:
33.7 years
Hawaii median age:
40.8 years
Average household size:
This zip code:
3.4 people
Hawaii:
2.8 people
Averages for the 2020 tax year for zip code 96731, filed in 2021:
Average Adjusted Gross Income (AGI) in 2020: $62,362 (Individual Income Tax Returns)
Here:
$62,362
State:
$72,945
Salary/wage: $48,152 (reported on 81.1% of returns)
Here:
$48,152
State:
$57,697
(% of AGI for various income ranges: 1092.6% for AGIs below $25k, 3250.8% for AGIs $25k-50k, 6427.7% for AGIs $50k-75k, 10187.5% for AGIs $75k-100k, 19917.8% for AGIs $100k-200k)
Taxable interest for individuals: $457 (reported on 23.6% of returns)
This zip code:
$457
Hawaii:
$1,356
(% of AGI for various income ranges: 3.3% for AGIs below $25k, 3.5% for AGIs $25k-50k, 21.5% for AGIs $50k-75k, 38.8% for AGIs $75k-100k, 66.7% for AGIs $100k-200k)
Ordinary dividends: $5,427 (reported on 8.7% of returns)
Here:
$5,427
State:
$6,387
(% of AGI for various income ranges: 7.0% for AGIs below $25k, 7.7% for AGIs $25k-50k, 16.2% for AGIs $50k-75k, 596.7% for AGIs $100k-200k)
Net capital gain/loss in AGI: +$20,392 (reported on 9.4% of returns)
Here:
+$20,392
State:
+$23,240
(% of AGI for various income ranges: 1.2% for AGIs $25k-50k, 26.9% for AGIs $50k-75k, 2676.7% for AGIs $100k-200k)
Profit/loss from business: +$9,743 (reported on 16.5% of returns)
Here:
+$9,743
State:
+$15,381
(% of AGI for various income ranges: 100.4% for AGIs below $25k, 148.8% for AGIs $25k-50k, 104.6% for AGIs $50k-75k, 186.2% for AGIs $75k-100k, 1225.6% for AGIs $100k-200k)
Taxable individual retirement arrangement distribution: $18,400 (reported on 3.1% of returns)
96731:
$18,400
Hawaii:
$19,883
(% of AGI for various income ranges: 43.3% for AGIs below $25k, 687.8% for AGIs $100k-200k)
Total itemized deductions: $33,262 (reported on 12.6% of returns)
Here:
$33,262
State:
$33,097
(% of AGI for various income ranges: 209.6% for AGIs below $25k, 500.0% for AGIs $50k-75k, 1018.8% for AGIs $75k-100k, 3656.7% for AGIs $100k-200k)
Charity contributions: $9,809 (reported on 8.7% of returns)
Here:
$9,809
State:
$7,368
(% of AGI for various income ranges: 243.1% for AGIs $50k-75k, 847.8% for AGIs $100k-200k)
Taxes paid: $7,262 (reported on 12.6% of returns)
96731:
$7,262
State:
$7,601
(% of AGI for various income ranges: 26.3% for AGIs below $25k, 105.4% for AGIs $50k-75k, 208.8% for AGIs $75k-100k, 874.4% for AGIs $100k-200k)
Earned income credit: $2,318 (reported on 17.3% of returns)
Here:
$2,318
State:
$2,008
(% of AGI for various income ranges: 98.5% for AGIs below $25k, 93.8% for AGIs $25k-50k)
Percentage of individuals using paid preparers for their 2020 taxes: 91.3%
Here:
91%
State:
89%
(% for various income ranges: 90.2% for AGIs below $25k, 93.9% for AGIs $25k-50k, 94.7% for AGIs $50k-75k, 91.7% for AGIs $75k-100k, 89.5% for AGIs $100k-200k, 66.7% for AGIs over 200k)
Averages for the 2012 tax year for zip code 96731, filed in 2013:
Average Adjusted Gross Income (AGI) in 2012: $44,185 (Individual Income Tax Returns)
Here:
$44,185
State:
$57,303
Salary/wage: $38,899 (reported on 88.4% of returns)
Here:
$38,899
State:
$47,500
(% of AGI for various income ranges: 81.4% for AGIs below $25k, 86.2% for AGIs $25k-50k, 83.9% for AGIs $50k-75k, 83.7% for AGIs $75k-100k, 63.4% for AGIs $100k-200k)
Taxable interest for individuals: $238 (reported on 22.5% of returns)
This zip code:
$238
Hawaii:
$1,212
(% of AGI for various income ranges: 0.1% for AGIs $25k-50k, 0.1% for AGIs $75k-100k, 0.2% for AGIs $100k-200k)
Ordinary dividends: $1,910 (reported on 7.8% of returns)
Here:
$1,910
State:
$5,430
(% of AGI for various income ranges: 0.3% for AGIs $25k-50k, 0.1% for AGIs $50k-75k, 0.7% for AGIs $100k-200k)
Net capital gain/loss in AGI: +$14,829 (reported on 5.4% of returns)
Here:
+$14,829
State:
+$13,910
Profit/loss from business: +$10,119 (reported on 16.3% of returns)
Here:
+$10,119
State:
+$15,881
(% of AGI for various income ranges: 4.8% for AGIs below $25k, 3.5% for AGIs $25k-50k, 3.2% for AGIs $50k-75k, 7.2% for AGIs $75k-100k, 2.5% for AGIs $100k-200k)
Taxable individual retirement arrangement distribution: $8,683 (reported on 4.7% of returns)
96731:
$8,683
Hawaii:
$15,720
Total itemized deductions: $23,000 (28% of AGI, reported on 27.9% of returns)
Here:
$23,000
State:
$25,496
Here:
27.9% of AGI
State:
23.1% of AGI
(% of AGI for various income ranges: 5.4% for AGIs below $25k, 10.2% for AGIs $25k-50k, 16.6% for AGIs $50k-75k, 17.8% for AGIs $75k-100k, 18.5% for AGIs $100k-200k)
Charity contributions: $5,297 (reported on 23.3% of returns)
Here:
$5,297
State:
$3,353
(% of AGI for various income ranges: 2.3% for AGIs $25k-50k, 3.0% for AGIs $50k-75k, 3.3% for AGIs $75k-100k, 3.8% for AGIs $100k-200k)
Taxes paid: $5,344 (reported on 27.9% of returns)
96731:
$5,344
State:
$8,029
(% of AGI for various income ranges: 0.6% for AGIs below $25k, 1.9% for AGIs $25k-50k, 3.1% for AGIs $50k-75k, 4.5% for AGIs $75k-100k, 5.3% for AGIs $100k-200k)
Earned income credit: $2,144 (reported on 24.8% of returns)
Here:
$2,144
State:
$2,113
(% of AGI for various income ranges: 7.1% for AGIs below $25k, 1.7% for AGIs $25k-50k)
Percentage of individuals using paid preparers for their 2012 taxes: 55.8%
Here:
56%
State:
53%
(% for various income ranges: 48.1% for AGIs below $25k, 57.9% for AGIs $25k-50k, 63.2% for AGIs $50k-75k, 62.5% for AGIs $75k-100k, 66.7% for AGIs $100k-200k)
Averages for the 2004 tax year for zip code 96731, filed in 2005:
Average Adjusted Gross Income (AGI) in 2004: $35,228 (Individual Income Tax Returns)
Here:
$35,228
State:
$46,564
Salary/wage: $31,904 (reported on 87.3% of returns)
Here:
$31,904
State:
$39,831
(% of AGI for various income ranges: 109.5% for AGIs below $10k, 85.2% for AGIs $10k-25k, 90.6% for AGIs $25k-50k, 89.5% for AGIs $50k-75k, 81.0% for AGIs $75k-100k, 46.2% for AGIs over 100k)
Taxable interest for individuals: $485 (reported on 35.9% of returns)
This zip code:
$485
Hawaii:
$1,263
(% of AGI for various income ranges: 4.6% for AGIs below $10k, 0.5% for AGIs $10k-25k, 0.4% for AGIs $25k-50k, 0.3% for AGIs $50k-75k, 0.4% for AGIs $75k-100k, 0.5% for AGIs over 100k)
Taxable dividends: $1,159 (reported on 11.4% of returns)
Here:
$1,159
State:
$3,145
(% of AGI for various income ranges: 2.3% for AGIs below $10k, 0.6% for AGIs $10k-25k, 0.4% for AGIs $25k-50k, 0.1% for AGIs $50k-75k, 0.2% for AGIs $75k-100k, 0.5% for AGIs over 100k)
Net capital gain/loss: +$25,400 (reported on 8.3% of returns)
Here:
+$25,400
State:
+$16,059
(% of AGI for various income ranges: -2.6% for AGIs below $10k, -0.2% for AGIs $10k-25k, 0.0% for AGIs $25k-50k, -0.2% for AGIs $50k-75k, 1.2% for AGIs $75k-100k, 27.5% for AGIs over 100k)
Profit/loss from business: +$10,132 (reported on 11.9% of returns)
Here:
+$10,132
State:
+$13,847
(% of AGI for various income ranges: 7.0% for AGIs below $10k, 3.6% for AGIs $10k-25k, 1.5% for AGIs $25k-50k, 1.3% for AGIs $50k-75k, 2.2% for AGIs $75k-100k, 8.3% for AGIs over 100k)
Profit/loss from farming: +$4,000 (reported on 2.6% of returns)
Here:
+$4,000
State:
-$719
Total itemized deductions: $18,607 (29% of AGI, reported on 32.8% of returns)
Here:
$18,607
State:
$20,647
Here:
29.4% of AGI
State:
23.5% of AGI
(% of AGI for various income ranges: 11.5% for AGIs $10k-25k, 16.5% for AGIs $25k-50k, 24.7% for AGIs $50k-75k, 19.3% for AGIs $75k-100k, 14.1% for AGIs over 100k)
Charity contributions deductions: $4,312 (7% of AGI, reported on 30.9% of returns)
Here:
$4,312
State:
$2,966
Here:
6.8% of AGI
State:
3.3% of AGI
(% of AGI for various income ranges: 2.2% for AGIs $10k-25k, 3.0% for AGIs $25k-50k, 5.2% for AGIs $50k-75k, 4.4% for AGIs $75k-100k, 4.1% for AGIs over 100k)
Total tax: $4,382 (reported on 65.2% of returns)
96731:
$4,382
State:
$7,224
(% of AGI for various income ranges: 3.9% for AGIs below $10k, 3.9% for AGIs $10k-25k, 5.7% for AGIs $25k-50k, 6.0% for AGIs $50k-75k, 8.7% for AGIs $75k-100k, 15.6% for AGIs over 100k)
Earned income credit: $1,715 (reported on 20.5% of returns)
Here:
$1,715
State:
$1,536
Percentage of individuals using paid preparers for their 2004 taxes: 48.8%
Here:
49%
State:
58%
(% for various income ranges: 39.4% for AGIs below $10k, 47.5% for AGIs $10k-25k, 49.1% for AGIs $25k-50k, 58.9% for AGIs $50k-75k, 53.7% for AGIs $75k-100k, 71.2% for AGIs over 100k)
Likely homosexual households (counted as self-reported same-sex unmarried-partner households)
Lesbian couples: 0.2% of all households
Gay men: 0.0% of all households
Household received Food Stamps/SNAP in the past 12 months: 115 Household did not receive Food Stamps/SNAP in the past 12 months: 693
Women who had a birth in the past 12 months: 36 (36 now married, 0 unmarried) Women who did not have a birth in the past 12 months: 541 (229 now married, 312 unmarried)
Housing units in zip code 96731 with a mortgage: 341 (61 second mortgage, 5 home equity loan, 35 both second mortgage and home equity loan) Median monthly owner costs for units with a mortgage: $2,922 Median monthly owner costs for units without a mortgage: $874
Residents with income below the poverty level in 2022:
This zip code:
10.6%
Whole state:
10.2%
Residents with income below 50% of the poverty level in 2022:
This zip code:
1.9%
Whole state:
4.7%
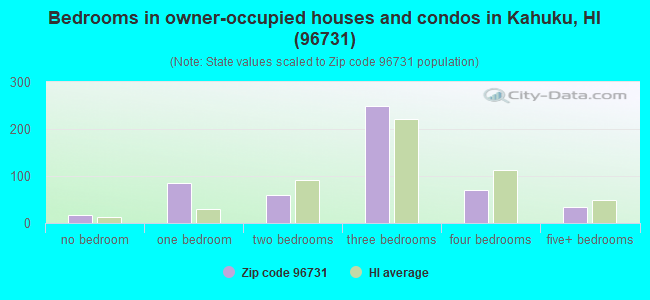
Median number of rooms in houses and condos:
Here:
5.1
State:
5.5
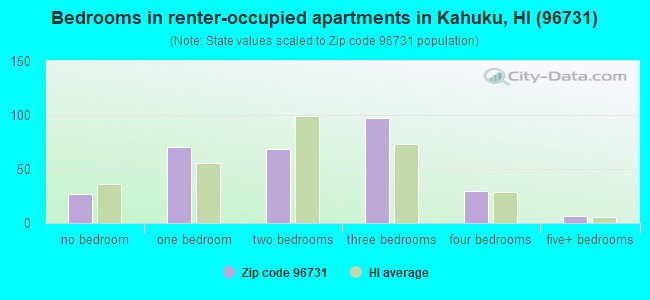
Median number of rooms in apartments:
Here:
4.5
State:
3.9
Notable locations in this zip code not listed on our city pages
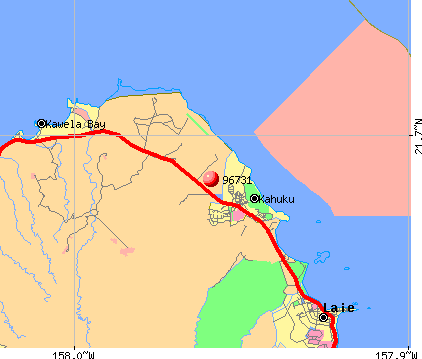
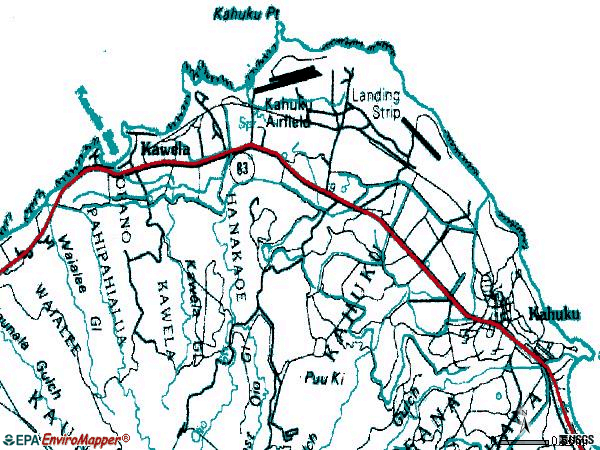
Notable locations in zip code 96731: Kahuku Golf Course (A), Kulima Golf Course (B), Kahuku Wastewater Treatment Plant (C), Kuilima Wastewater Treatment Plant (D), Honolulu Fire Department Station 13 Kahuku (E), Emergency Medical Services Unit Kahuku (F), Kahuku Public and School Library (G). Display/hide their locations on the map
Churches in zip code 96731 include: Holy Cross Episcopal Mission (A), Kahuku United Methodist Church (B), Saint Roch Church (C). Display/hide their locations on the map
Parks in zip code 96731 include: Mālaekahana State Recreation Area (1), Lā‘ie Point State Wayside (2), Waiale‘e Beach Park (3), Kawela Bay Beach Park (4), Kii Unit James Campbell National Wildlife Refuge (5), Punamano Unit James Campbell National Wildlife Refuge (6), Adams Field (7). Display/hide their locations on the map
In group quarters: 16 (-1 institutionalized population)
Size of family households: 149 2-persons, 108 3-persons, 147 4-persons, 78 5-persons, 26 6-persons, 48 7-or-more-persons
Size of nonfamily households: 193 1-person, 50 2-persons, 2 3-persons
371 married couples with children.
121 single-parent households (22 men, 99 women).
74.4% of residents of 96731 zip code speak English at home.
3.5% of residents speak Spanish at home (82% very well, 10% well, 8% not well).
2.3% of residents speak other Indo-European language at home (82% very well, 11% well, 7% not well).
13.0% of residents speak Asian or Pacific Island language at home (59% very well, 28% well, 12% not well, 2% not at all).
6.8% of residents speak other language at home (100% very well).
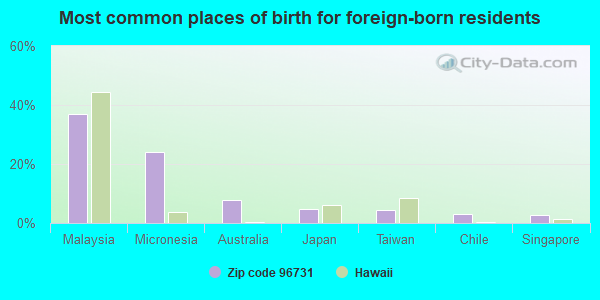
Foreign born population: 328 (12.1%) (64.4% of them are naturalized citizens)
This zip code:
12.1%
Whole state:
17.1%
37%Malaysia
24%Micronesia
8%Australia
5%Japan
4%Taiwan
3%Chile
3%Singapore
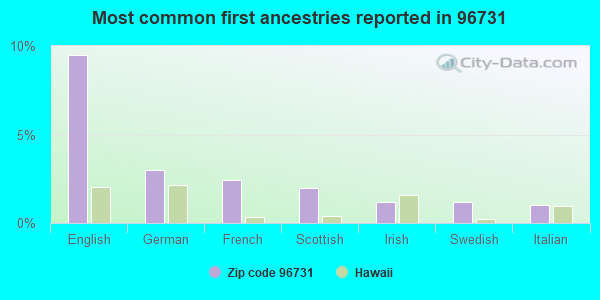
9%English
3%German
2%French
2%Scottish
1%Irish
1%Swedish
1%Italian
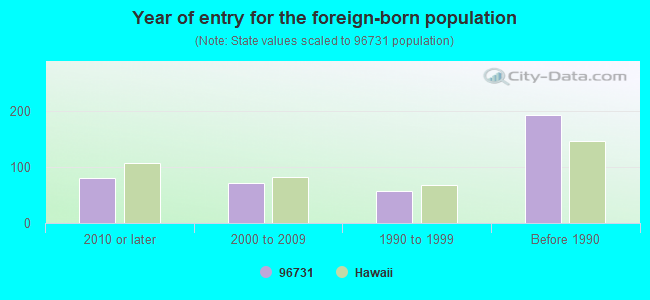
Year of entry for the foreign-born population
802010 or later
722000 to 2009
571990 to 1999
192Before 1990
Major facilities with environmental interests located in this zip code:
KAHUKU SHRIMP COMPANY (56-1069 KAMEHAMEHA HIGHWAY in KAHUKU, HI)
UNDERGROUND STORAGE TANK PROGRAM (Hawaii Underground Storage Tank Program) (Integrated Compliance Information System) - ICIS-09-2004-0225, FORMAL ENFORCEMENT ACTION National Pollutant Discharge Elimination System MAJOR (Tracking pollutant discharge elimination systems) - permit Business SIC classification: FISH HATCHERIES AND PRESERVES Alternative names: KAHUKU SHRIMP FARM
KAHUKU ELEMENTARY SCHOOL (56-170 PUALAEA STREET in KAHUKU, HI)
(National Center for Education Statistics) - STATE ID-4-331 Organizations: HAWAII DEPT OF EDUCATION (SCHOOL DISTRICT)
KAHUKU WWTP (56-701 KAMEHAMEHA HIGHWAY in KAHUKU, HI)
STATE MASTER (HEER-FRS) STATE MASTER (Hawaii environmental compliance and hazardous materials tracking) UNDERGROUND STORAGE TANK PROGRAM (Hawaii Underground Storage Tank Program) National Pollutant Discharge Elimination System NON-MAJOR (Tracking pollutant discharge elimination systems) - permit Business SIC classification: SEWERAGE SYSTEMS Alternative names: HONOLULU, CITY & COUNTY OF, KAHUKU WASTE WATER TREATMENT PLANT, KAHUKU WASTEWATER TREATMENT PLAN, KAHUKU WWTP, HONO CITY, COUNTY
KAHUKU HIGH SCHOOL (56-490 KAMEHAMEHA HIGHWAY in KAHUKU, HI)
STATE MASTER (HEER-FRS) STATE MASTER (Hawaii environmental compliance and hazardous materials tracking) SOLID WASTE PROGRAM (Hawaii Office Of Solid Waste) COMPLIANCE ACTIVITY (Tracking inspections of insecticide, fungicide, and rodenticide, and toxic substances) Alternative names: KAHUKU HIGH & INTERMEDIATE SCHOOL, KAHUKU HIGH SCHOOL COMMUNITY RECYCLING CENTER, KAHUKU INTERMEDIATE & HIGH SCHOOL
KAHUKU VILLAGE (56 485 KAMEHAMEHA HWY in KAHUKU, HI)
(Resource Conservation and Recovery Act (tracking hazardous waste)) Organizations: THE ESTATE OF JAMES CAMPBELL (CONTACT/OWNER)
KAHUKU ARMY ROAD (KAHUKU ARMY ROAD in KAHUKU, HI)
National Pollutant Discharge Elimination System NON-MAJOR (Tracking pollutant discharge elimination systems) - permit
KAHUKU SUGAR MILL (KAHUKU SUGAR MILL in KAHUKU, HI)
National Pollutant Discharge Elimination System NON-MAJOR (Tracking pollutant discharge elimination systems) - permit Business SIC classification: NONCLASSIFIABLE ESTABLISHMENTS Alternative names: IWILEI TO WAIKIKI ALIGNMENT
KAHUKU SUGAR MILL (56 565 KAMEHAMEHA HWY in KAHUKU, HI)
Small Quantity Generators, between 100 kg and 1000 kg of hazardous waste/month (Resource Conservation and Recovery Act (tracking hazardous waste)) Organizations: TETRA TECH INC (CONTACT/OPERATOR)
Alternative names: TEXACO STATION 611000113
KAHUKU TRAINING FACILITY (435 POIPU RD in KAHUKU, HI)
National Pollutant Discharge Elimination System NON-MAJOR (Tracking pollutant discharge elimination systems) - permit Business SIC classification: NONCLASSIFIABLE ESTABLISHMENTS Alternative names: CONSTRUCTION OF SOFTBALL FIEL
KAHUKU WTP (KAHUKU WTP in KAHUKU, HI)
National Pollutant Discharge Elimination System NON-MAJOR (Tracking pollutant discharge elimination systems) - permit
OCEAN VILLAS AT TURTLE BAY RES (57-091 KAMEHAMEHA HIGHWAY in KAHUKU, HI)
National Pollutant Discharge Elimination System NON-MAJOR (Tracking pollutant discharge elimination systems) - permit
TURTLE BAY RESORT DEVELOPMENT (57-091 KAMEHAMEHA HIGHWAY in KAHUKU, HI)
National Pollutant Discharge Elimination System NON-MAJOR (Tracking pollutant discharge elimination systems) - permit Business SIC classification: NONCLASSIFIABLE ESTABLISHMENTS
LINKS AT KUILIMA (57 091 KAMEHAMEHA HWY in KAHUKU, HI)
Conditionally Exempt Small Quantity Generators, less than 100 kg/month of hazardous waste (Resource Conservation and Recovery Act (tracking hazardous waste)) - notification Organizations: ASAHI JYUKEN (CONTACT/OWNER)
Housing units lacking complete plumbing facilities: 0.9% Housing units lacking complete kitchen facilities: 3.4%
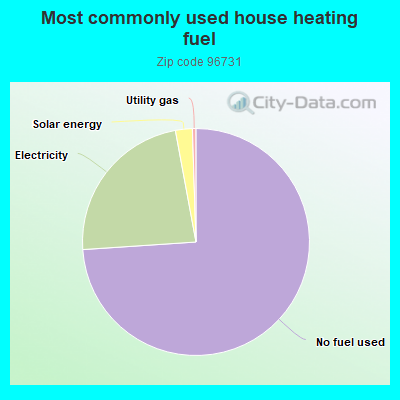
73.8%No fuel used
23.1%Electricity
2.4%Solar energy
0.5%Utility gas
Place of birth for U.S.-born residents:
This state: 1,654
Northeast: 119
Midwest: 108
South: 150
West: 289
67% of the 96731 zip code residents lived in the same house 5 years ago. Out of people who lived in different houses, 76% lived in this county. Out of people who lived in different counties, 50% lived in Hawaii.
90% of the 96731 zip code residents lived in the same house 1 year ago. Out of people who lived in different houses, 56% moved from this county. Out of people who lived in different houses, 7% moved from different county within same state. Out of people who lived in different houses, 30% moved from different state. Out of people who lived in different houses, 6% moved from abroad.
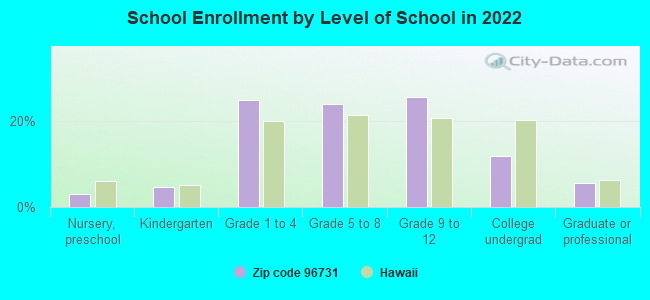
Private vs. public school enrollment:
Students in private schools in grades 1 to 8 (elementary and middle school): 20
Here:
6.7%
Hawaii:
21.6%
Students in private schools in grades 9 to 12 (high school): 21
Here:
12.9%
Hawaii:
21.5%
Students in private undergraduate colleges: 31
Here:
38.2%
Hawaii:
23.3%
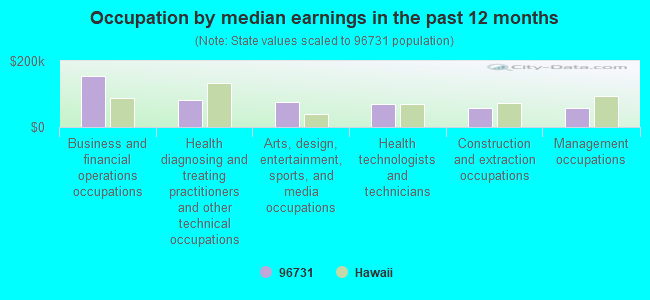
Occupation by median earnings in the past 12 months ($)
153,085Business and financial operations occupations
82,426Health diagnosing and treating practitioners and other technical occupations
74,591Arts, design, entertainment, sports, and media occupations
69,871Health technologists and technicians
58,306Construction and extraction occupations
56,433Management occupations
Companies with federal contracts located in this zip code:
TBR PROPERTY L L C (57-091 KAMEHAMEHA HWY in KAHUKU, HI) : $332,451 in 17 contractsfrom 2004 to 2006
Contracts for Other Education and Training Services, Lease or Rental of Facilities -- Troop Housing Facilities, Lodging - Hotel/Motel, Lease or Rental of Facilities -- Conference Space and Facilities by Army Signed by year:2000: $0; 2001: $0; 2002: $0; 2003: $0; 2004: $12,554; 2005: $136,237; 2006: $183,660.
Biggest contracts:
$86,838 with Army for Other Education and Training Services. Signed on 2005-03-21. Completion date: 2005-05-13.
$77,453 with Army for Lease or Rental of Facilities -- Troop Housing Facilities. Signed on 2006-05-12. Completion date: 2006-06-25.
$63,941 with Army for Lodging - Hotel/Motel. Signed on 2005-04-01. Completion date: 2015-04-15.
$19,686, same as above.Signed on 2006-03-23. Completion date: 2006-04-07.
KUILIMA RESORT COMPANY (57-091 KAMEHAMEHA HIGHWAY in KAHUKU, HI) : $279,988 in 9 contractsfrom 2001 to 2006
Contracts for Other Professional Services, Lodging - Hotel/Motel, Social Rehabilitation Services, Other Education and Training Services by Army Signed by year:2000: $0; 2001: $101,279; 2002: $155,948; 2003: $22,761; 2004: $0; 2005: $0; 2006: $0.
Biggest contracts:
$101,279 with Army for Other Professional Services. Signed on 2001-01-25. Completion date: 2001-04-14.
$85,108 with Army for Lodging - Hotel/Motel. Signed on 2002-08-17. Completion date: 2002-09-15.
$70,840, same as above.Signed on 2002-08-17. Completion date: 2002-09-08.
$10,158 with Army for Social Rehabilitation Services. Signed on 2006-01-20. Completion date: 2006-04-07.
ESTATES AT TURTLE BAY (56-565 KAM HWY in KAHUKU, HI; small business) : $99,008 in 4 contractsfrom 2003 to 2006
$62,389 with Army for Lodging - Hotel/Motel. Signed on 2005-08-19. Completion date: 2005-10-20.
$46,277, same as above.Signed on 2003-03-25. Completion date: 2003-06-12.
-$455, same as above.Signed on 2006-01-25. Completion date: 2005-10-20.
-$9,203, same as above.Signed on 2003-07-11. Completion date: 2003-06-12.
Top industries in this zip code by the number of employees in 2005:
Accommodation and Food Services: Hotels (except Casino Hotels) and Motels (250-499 employees: 1 establishment)
Health Care and Social Assistance: General Medical and Surgical Hospitals (100-249: 1)
Health Care and Social Assistance: Residential Mental Health and Substance Abuse Facilities (50-99: 1)
Health Care and Social Assistance: Child Day Care Services (10-19: 2, 5-9: 1)
Accommodation and Food Services: Full-Service Restaurants (20-49: 1)
Arts, Entertainment, and Recreation: Golf Courses and Country Clubs (20-49: 1)
Health Care and Social Assistance: Offices of Physicians (except Mental Health Specialists) (10-19: 1, 5-9: 1, 1-4: 4)
Other Services (except Public Administration): Other Similar Organizations (except Business, Professional, Labor, and Political Organizations) (10-19: 1, 5-9: 1)
Accommodation and Food Services: Mobile Food Services (10-19: 1)
People in group quarters in 2010:
10 people in nursing facilities/skilled-nursing facilities
4 people in other noninstitutional facilities
People in group quarters in 2000:
49 people in agriculture workers' dormitories on farms
46 people in nursing homes
24 people in homes or halfway houses for drug/alcohol abuse
10 people in wards in general hospitals for patients who have no usual home elsewhere
3 people in hospitals/wards and hospices for chronically ill
3 people in hospices or homes for chronically ill
Fatal accident statistics in 2014:
Fatal accident count: 1
Vehicles involved in fatal accidents: 2
Fatal accidents caused by drunken drivers: 0
Fatalities: 1
Persons involved in fatal accidents: 3
Pedestrians involved in fatal accidents: 0
Fatal accident statistics in 2012:
Fatal accident count: 2
Vehicles involved in fatal accidents: 4
Fatal accidents caused by drunken drivers: 1
Fatalities: 2
Persons involved in fatal accidents: 6
Pedestrians involved in fatal accidents: 0
Home Mortgage Disclosure Act Aggregated Statistics For Year 2009 (Based on 2 partial tracts)
A) FHA, FSA/RHS & VA Home Purchase Loans
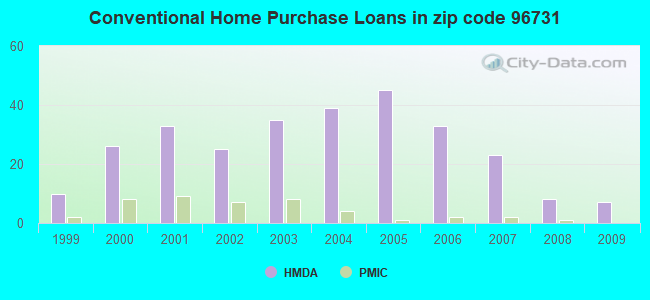
B) Conventional Home Purchase Loans
C) Refinancings
D) Home Improvement Loans
F) Non-occupant Loans on < 5 Family Dwellings (A B C & D)
Number
Average Value
Number
Average Value
Number
Average Value
Number
Average Value
Number
Average Value
LOANS ORIGINATED
2
$597,625
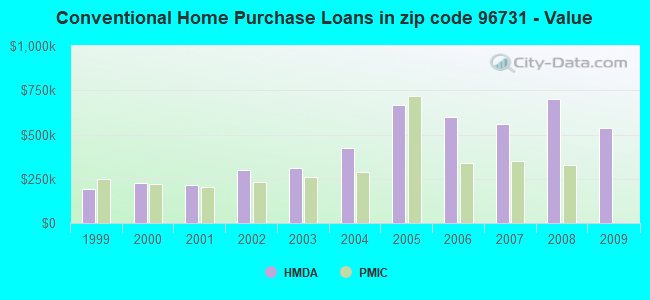
7
$534,100
50
$433,678
2
$261,800
15
$495,437
APPLICATIONS APPROVED, NOT ACCEPTED
0
$0
0
$0
8
$459,638
0
$0
1
$1,028,300
APPLICATIONS DENIED
1
$240,800
5
$279,020
32
$487,944
1
$487,900
10
$470,120
APPLICATIONS WITHDRAWN
1
$350,000
2
$748,300
12
$434,292
1
$367,500
5
$434,070
FILES CLOSED FOR INCOMPLETENESS
0
$0
0
$0
2
$598,500
0
$0
1
$321,650
Aggregated Statistics For Year 2008 (Based on 2 partial tracts)
B) Conventional Home Purchase Loans
C) Refinancings
D) Home Improvement Loans
F) Non-occupant Loans on < 5 Family Dwellings (A B C & D)
Number
Average Value
Number
Average Value
Number
Average Value
Number
Average Value
LOANS ORIGINATED
8
$700,088
30
$450,893
7
$192,850
8
$768,556
APPLICATIONS APPROVED, NOT ACCEPTED
4
$795,200
8
$350,131
0
$0
3
$566,883
APPLICATIONS DENIED
4
$719,688
25
$485,352
4
$264,250
8
$570,019
APPLICATIONS WITHDRAWN
2
$724,150
7
$468,350
1
$166,250
2
$712,250
FILES CLOSED FOR INCOMPLETENESS
1
$567,000
2
$1,300,950
0
$0
1
$2,061,500
Aggregated Statistics For Year 2007 (Based on 2 partial tracts)
B) Conventional Home Purchase Loans
C) Refinancings
D) Home Improvement Loans
F) Non-occupant Loans on < 5 Family Dwellings (A B C & D)
Number
Average Value
Number
Average Value
Number
Average Value
Number
Average Value
LOANS ORIGINATED
23
$562,146
55
$458,207
8
$356,606
23
$612,698
APPLICATIONS APPROVED, NOT ACCEPTED
7
$416,400
10
$545,230
1
$90,300
3
$690,667
APPLICATIONS DENIED
12
$543,200
28
$542,150
10
$338,660
7
$640,400
APPLICATIONS WITHDRAWN
6
$630,117
22
$498,257
1
$287,700
2
$484,750
FILES CLOSED FOR INCOMPLETENESS
2
$548,800
2
$496,475
1
$612,500
1
$859,250
Aggregated Statistics For Year 2006 (Based on 2 partial tracts)
B) Conventional Home Purchase Loans
C) Refinancings
D) Home Improvement Loans
F) Non-occupant Loans on < 5 Family Dwellings (A B C & D)
Number
Average Value
Number
Average Value
Number
Average Value
Number
Average Value
LOANS ORIGINATED
33
$599,550
71
$454,315
12
$287,904
31
$717,895
APPLICATIONS APPROVED, NOT ACCEPTED
7
$450,250
23
$455,943
4
$205,538
9
$596,594
APPLICATIONS DENIED
14
$526,825
31
$590,777
9
$215,289
16
$828,034
APPLICATIONS WITHDRAWN
10
$346,150
35
$446,640
4
$242,900
12
$574,992
FILES CLOSED FOR INCOMPLETENESS
3
$438,900
9
$347,394
0
$0
2
$172,025
Aggregated Statistics For Year 2005 (Based on 2 partial tracts)
B) Conventional Home Purchase Loans
C) Refinancings
D) Home Improvement Loans
F) Non-occupant Loans on < 5 Family Dwellings (A B C & D)
Number
Average Value
Number
Average Value
Number
Average Value
Number
Average Value
LOANS ORIGINATED
45
$668,026
78
$341,483
12
$396,842
39
$648,783
APPLICATIONS APPROVED, NOT ACCEPTED
5
$829,500
12
$314,271
2
$228,200
4
$551,600
APPLICATIONS DENIED
13
$614,169
27
$317,554
9
$228,278
9
$540,244
APPLICATIONS WITHDRAWN
13
$603,265
40
$357,928
7
$307,300
9
$685,922
FILES CLOSED FOR INCOMPLETENESS
3
$955,150
6
$427,525
0
$0
4
$801,938
Aggregated Statistics For Year 2004 (Based on 2 partial tracts)
B) Conventional Home Purchase Loans
C) Refinancings
D) Home Improvement Loans
F) Non-occupant Loans on < 5 Family Dwellings (A B C & D)
Number
Average Value
Number
Average Value
Number
Average Value
Number
Average Value
LOANS ORIGINATED
39
$421,203
87
$291,984
10
$222,845
42
$366,750
APPLICATIONS APPROVED, NOT ACCEPTED
5
$319,340
14
$279,325
1
$256,550
4
$384,738
APPLICATIONS DENIED
6
$661,150
33
$360,648
3
$347,200
7
$812,400
APPLICATIONS WITHDRAWN
5
$534,940
40
$282,074
4
$148,662
6
$448,583
FILES CLOSED FOR INCOMPLETENESS
2
$364,350
7
$271,450
0
$0
0
$0
Aggregated Statistics For Year 2003 (Based on 2 partial tracts)
B) Conventional Home Purchase Loans
C) Refinancings
D) Home Improvement Loans
F) Non-occupant Loans on < 5 Family Dwellings (A B C & D)
Number
Average Value
Number
Average Value
Number
Average Value
Number
Average Value
LOANS ORIGINATED
35
$308,430
131
$255,807
2
$157,150
36
$301,146
APPLICATIONS APPROVED, NOT ACCEPTED
5
$356,160
17
$242,715
1
$4,200
6
$273,175
APPLICATIONS DENIED
4
$329,262
33
$256,486
1
$85,050
5
$341,110
APPLICATIONS WITHDRAWN
3
$420,000
27
$263,252
1
$43,750
6
$327,717
FILES CLOSED FOR INCOMPLETENESS
2
$175,875
10
$218,505
0
$0
0
$0
Aggregated Statistics For Year 2002 (Based on 2 partial tracts)
A) FHA, FSA/RHS & VA Home Purchase Loans
B) Conventional Home Purchase Loans
C) Refinancings
D) Home Improvement Loans
F) Non-occupant Loans on < 5 Family Dwellings (A B C & D)
Number
Average Value
Number
Average Value
Number
Average Value
Number
Average Value
Number
Average Value
LOANS ORIGINATED
1
$256,550
25
$301,826
76
$251,503
1
$35,000
24
$269,442
APPLICATIONS APPROVED, NOT ACCEPTED
0
$0
4
$292,775
13
$197,535
0
$0
5
$168,630
APPLICATIONS DENIED
0
$0
6
$425,542
18
$231,369
2
$24,325
5
$368,130
APPLICATIONS WITHDRAWN
0
$0
5
$349,650
23
$218,491
0
$0
3
$185,150
FILES CLOSED FOR INCOMPLETENESS
0
$0
0
$0
5
$231,210
0
$0
0
$0
Aggregated Statistics For Year 2001 (Based on 2 partial tracts)
A) FHA, FSA/RHS & VA Home Purchase Loans
B) Conventional Home Purchase Loans
C) Refinancings
D) Home Improvement Loans
F) Non-occupant Loans on < 5 Family Dwellings (A B C & D)
Number
Average Value
Number
Average Value
Number
Average Value
Number
Average Value
Number
Average Value
LOANS ORIGINATED
2
$167,125
33
$212,705
59
$234,542
1
$46,900
23
$220,515
APPLICATIONS APPROVED, NOT ACCEPTED
0
$0
3
$231,467
4
$250,425
0
$0
1
$109,900
APPLICATIONS DENIED
1
$93,100
5
$256,340
15
$360,897
1
$23,100
5
$473,480
APPLICATIONS WITHDRAWN
0
$0
4
$172,375
11
$207,900
1
$175,000
2
$273,525
FILES CLOSED FOR INCOMPLETENESS
0
$0
1
$581,000
9
$248,267
0
$0
0
$0
Aggregated Statistics For Year 2000 (Based on 2 partial tracts)
A) FHA, FSA/RHS & VA Home Purchase Loans
B) Conventional Home Purchase Loans
C) Refinancings
D) Home Improvement Loans
F) Non-occupant Loans on < 5 Family Dwellings (A B C & D)
Number
Average Value
Number
Average Value
Number
Average Value
Number
Average Value
Number
Average Value
LOANS ORIGINATED
2
$140,175
26
$227,567
20
$233,660
6
$45,325
12
$243,688
APPLICATIONS APPROVED, NOT ACCEPTED
0
$0
4
$369,600
4
$278,075
0
$0
2
$447,650
APPLICATIONS DENIED
0
$0
7
$265,950
8
$251,212
0
$0
4
$329,525
APPLICATIONS WITHDRAWN
0
$0
4
$279,825
5
$182,070
1
$55,650
1
$560,700
FILES CLOSED FOR INCOMPLETENESS
0
$0
0
$0
11
$242,645
0
$0
0
$0
Aggregated Statistics For Year 1999 (Based on 1 partial tract)
A) FHA, FSA/RHS & VA Home Purchase Loans
B) Conventional Home Purchase Loans
C) Refinancings
D) Home Improvement Loans
F) Non-occupant Loans on < 5 Family Dwellings (A B C & D)
Detailed PMIC statistics for the following Tracts:0101.00
2003 - 2018 National Fire Incident Reporting System (NFIRS) incidents
According to the data from the years 2003 - 2018 the average number of fires per year is 17. The highest number of fires - 32 took place in 2007, and the least - 6 in 2003. The data has a rising trend.
When looking into fire subcategories, the most reports belonged to: Outside Fires (66.8%), and Mobile Property/Vehicle Fires (18.5%).
Fire incident types reported to NFIRS in Zip Code 96731


+$4,000
-$719
 Nearest zip codes: 96762, 96712, 96786, 96717, 96730, 96789.
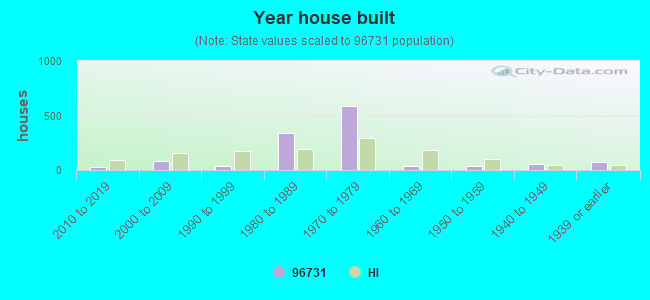


 According to the data from the years 2003 - 2018 the average number of fires per year is 17. The highest number of fires - 32 took place in 2007, and the least - 6 in 2003. The data has a rising trend.
 When looking into fire subcategories, the most reports belonged to: Outside Fires (66.8%), and Mobile Property/Vehicle Fires (18.5%).