Estimated zip code population in 2022: 4,365 Zip code population in 2010: 4,084 Zip code population in 2000: 2,075
Houses and condos: 1,708 Renter-occupied apartments: 297
% of renters here:
22%
State:
37%
March 2022 cost of living index in zip code 96754: 113.5 (more than average, U.S. average is 100)
Land area: 41.5 sq. mi. Water area: 3.8 sq. mi.
Population density: 105 people per square mile
(very low).
OSM Map
General Map
Google Map
MSN Map
OSM Map
General Map
Google Map
MSN Map
OSM Map
General Map
Google Map
MSN Map
OSM Map
General Map
Google Map
MSN Map
Please wait while loading the map...
Real estate property taxes paid for housing units in 2022:
This zip code:
0.2% ($2,418)
Hawaii:
0.3% ($2,092)
Median real estate property taxes paid for housing units with mortgages in 2022: $2,008 (0.2%) Median real estate property taxes paid for housing units with no mortgage in 2022: $2,732 (0.2%)
Estimated median house/condo value in 2022: $1,066,838
96754:
$1,066,838
Hawaii:
$820,100
According to our research of Hawaii and other state lists, there were 3 registered sex offenders living in 96754 zip code as of May 28, 2024. The ratio of all residents to sex offenders in zip code 96754 is 1,172 to 1. The ratio of registered sex offenders to all residents in this zip code is lower than the state average.
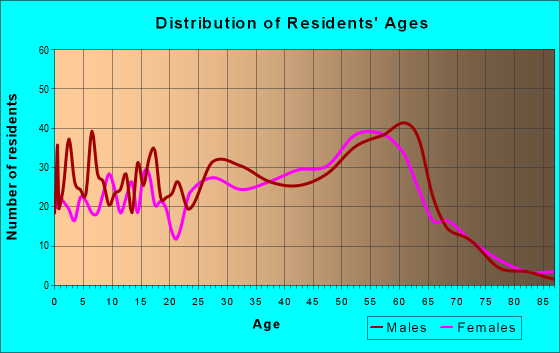
Median resident age:
This zip code:
43.0 years
Hawaii median age:
40.8 years
Average household size:
This zip code:
3.2 people
Hawaii:
2.8 people
Averages for the 2020 tax year for zip code 96754, filed in 2021:
Average Adjusted Gross Income (AGI) in 2020: $84,440 (Individual Income Tax Returns)
Here:
$84,440
State:
$72,945
Salary/wage: $49,396 (reported on 71.4% of returns)
Here:
$49,396
State:
$57,697
(% of AGI for various income ranges: 969.2% for AGIs below $25k, 3623.2% for AGIs $25k-50k, 8188.0% for AGIs $50k-75k, 11501.1% for AGIs $75k-100k, 20108.9% for AGIs $100k-200k, 92240.0% for AGIs over 200k)
Taxable interest for individuals: $2,376 (reported on 39.0% of returns)
This zip code:
$2,376
Hawaii:
$1,356
(% of AGI for various income ranges: 36.1% for AGIs below $25k, 41.0% for AGIs $25k-50k, 68.0% for AGIs $50k-75k, 110.0% for AGIs $75k-100k, 652.2% for AGIs $100k-200k, 4480.0% for AGIs over 200k)
Ordinary dividends: $14,471 (reported on 21.4% of returns)
Here:
$14,471
State:
$6,387
(% of AGI for various income ranges: 44.2% for AGIs below $25k, 123.2% for AGIs $25k-50k, 172.0% for AGIs $50k-75k, 516.7% for AGIs $75k-100k, 1247.8% for AGIs $100k-200k, 20580.0% for AGIs over 200k)
Net capital gain/loss in AGI: +$57,078 (reported on 21.4% of returns)
Here:
+$57,078
State:
+$23,240
(% of AGI for various income ranges: 14.2% for AGIs below $25k, 61.0% for AGIs $25k-50k, 258.7% for AGIs $50k-75k, 248.9% for AGIs $75k-100k, 1947.8% for AGIs $100k-200k, 115385.0% for AGIs over 200k)
Profit/loss from business: +$12,916 (reported on 29.0% of returns)
Here:
+$12,916
State:
+$15,381
(% of AGI for various income ranges: 335.8% for AGIs below $25k, 443.5% for AGIs $25k-50k, 941.3% for AGIs $50k-75k, 764.4% for AGIs $75k-100k, 1857.8% for AGIs $100k-200k, 7280.0% for AGIs over 200k)
Taxable individual retirement arrangement distribution: $19,738 (reported on 7.6% of returns)
96754:
$19,738
Hawaii:
$19,883
(% of AGI for various income ranges: 59.2% for AGIs below $25k, 208.7% for AGIs $25k-50k, 726.7% for AGIs $75k-100k, 1813.3% for AGIs $100k-200k)
Total itemized deductions: $31,956 (reported on 11.9% of returns)
Here:
$31,956
State:
$33,097
(% of AGI for various income ranges: 118.9% for AGIs below $25k, 268.4% for AGIs $25k-50k, 550.0% for AGIs $50k-75k, 1046.7% for AGIs $75k-100k, 2532.2% for AGIs $100k-200k, 13295.0% for AGIs over 200k)
Charity contributions: $7,635 (reported on 8.1% of returns)
Here:
$7,635
State:
$7,368
(% of AGI for various income ranges: 49.4% for AGIs $25k-50k, 73.3% for AGIs $75k-100k, 327.8% for AGIs $100k-200k, 3920.0% for AGIs over 200k)
Taxes paid: $7,200 (reported on 11.9% of returns)
96754:
$7,200
State:
$7,601
(% of AGI for various income ranges: 18.2% for AGIs below $25k, 45.5% for AGIs $25k-50k, 115.3% for AGIs $50k-75k, 258.9% for AGIs $75k-100k, 660.0% for AGIs $100k-200k, 2950.0% for AGIs over 200k)
Earned income credit: $1,565 (reported on 14.8% of returns)
Here:
$1,565
State:
$2,008
(% of AGI for various income ranges: 81.3% for AGIs below $25k, 56.8% for AGIs $25k-50k)
Percentage of individuals using paid preparers for their 2020 taxes: 91.9%
Here:
92%
State:
89%
(% for various income ranges: 90.3% for AGIs below $25k, 94.1% for AGIs $25k-50k, 93.3% for AGIs $50k-75k, 94.7% for AGIs $75k-100k, 91.7% for AGIs $100k-200k, 85.7% for AGIs over 200k)
Averages for the 2012 tax year for zip code 96754, filed in 2013:
Average Adjusted Gross Income (AGI) in 2012: $58,710 (Individual Income Tax Returns)
Here:
$58,710
State:
$57,303
Salary/wage: $39,850 (reported on 75.1% of returns)
Here:
$39,850
State:
$47,500
(% of AGI for various income ranges: 65.4% for AGIs below $25k, 76.1% for AGIs $25k-50k, 72.6% for AGIs $50k-75k, 61.3% for AGIs $75k-100k, 51.7% for AGIs $100k-200k, 21.1% for AGIs over 200k)
Taxable interest for individuals: $1,858 (reported on 38.1% of returns)
This zip code:
$1,858
Hawaii:
$1,212
(% of AGI for various income ranges: 1.8% for AGIs below $25k, 1.0% for AGIs $25k-50k, 1.0% for AGIs $50k-75k, 0.8% for AGIs $75k-100k, 1.8% for AGIs $100k-200k, 1.1% for AGIs over 200k)
Ordinary dividends: $10,424 (reported on 18.8% of returns)
Here:
$10,424
State:
$5,430
(% of AGI for various income ranges: 2.4% for AGIs below $25k, 0.8% for AGIs $25k-50k, 2.2% for AGIs $50k-75k, 2.6% for AGIs $75k-100k, 3.7% for AGIs $100k-200k, 5.4% for AGIs over 200k)
Net capital gain/loss in AGI: +$29,419 (reported on 17.1% of returns)
Here:
+$29,419
State:
+$13,910
(% of AGI for various income ranges: 4.9% for AGIs $100k-200k, 24.1% for AGIs over 200k)
Profit/loss from business: +$13,219 (reported on 32.0% of returns)
Here:
+$13,219
State:
+$15,881
(% of AGI for various income ranges: 19.5% for AGIs below $25k, 11.5% for AGIs $25k-50k, 6.2% for AGIs $50k-75k, 7.4% for AGIs $75k-100k, 11.5% for AGIs $100k-200k)
Taxable individual retirement arrangement distribution: $22,808 (reported on 7.2% of returns)
96754:
$22,808
Hawaii:
$15,720
(% of AGI for various income ranges: 2.4% for AGIs below $25k, 1.5% for AGIs $25k-50k, 2.0% for AGIs $50k-75k, 3.9% for AGIs $75k-100k, 9.4% for AGIs $100k-200k)
Total itemized deductions: $28,478 (23% of AGI, reported on 30.4% of returns)
Here:
$28,478
State:
$25,496
Here:
22.7% of AGI
State:
23.1% of AGI
(% of AGI for various income ranges: 12.6% for AGIs below $25k, 11.0% for AGIs $25k-50k, 14.8% for AGIs $50k-75k, 16.8% for AGIs $75k-100k, 19.7% for AGIs $100k-200k, 13.8% for AGIs over 200k)
Charity contributions: $3,105 (reported on 24.3% of returns)
Here:
$3,105
State:
$3,353
(% of AGI for various income ranges: 1.1% for AGIs below $25k, 0.7% for AGIs $25k-50k, 1.4% for AGIs $50k-75k, 1.3% for AGIs $75k-100k, 1.8% for AGIs $100k-200k, 1.3% for AGIs over 200k)
Taxes paid: $11,693 (reported on 29.8% of returns)
96754:
$11,693
State:
$8,029
(% of AGI for various income ranges: 1.8% for AGIs below $25k, 2.2% for AGIs $25k-50k, 4.1% for AGIs $50k-75k, 4.7% for AGIs $75k-100k, 6.8% for AGIs $100k-200k, 9.7% for AGIs over 200k)
Earned income credit: $1,669 (reported on 19.3% of returns)
Here:
$1,669
State:
$2,113
(% of AGI for various income ranges: 4.7% for AGIs below $25k, 0.9% for AGIs $25k-50k)
Percentage of individuals using paid preparers for their 2012 taxes: 61.3%
Here:
61%
State:
53%
(% for various income ranges: 51.3% for AGIs below $25k, 60.9% for AGIs $25k-50k, 68.0% for AGIs $50k-75k, 73.3% for AGIs $75k-100k, 84.6% for AGIs $100k-200k, 83.3% for AGIs over 200k)
Averages for the 2004 tax year for zip code 96754, filed in 2005:
Average Adjusted Gross Income (AGI) in 2004: $48,986 (Individual Income Tax Returns)
Here:
$48,986
State:
$46,564
Salary/wage: $31,220 (reported on 75.3% of returns)
Here:
$31,220
State:
$39,831
(% of AGI for various income ranges: 74.8% for AGIs $10k-25k, 78.7% for AGIs $25k-50k, 71.3% for AGIs $50k-75k, 62.1% for AGIs $75k-100k, 20.3% for AGIs over 100k)
Taxable interest for individuals: $2,139 (reported on 52.4% of returns)
This zip code:
$2,139
Hawaii:
$1,263
(% of AGI for various income ranges: 2.3% for AGIs $10k-25k, 1.7% for AGIs $25k-50k, 2.5% for AGIs $50k-75k, 1.5% for AGIs $75k-100k, 2.3% for AGIs over 100k)
Taxable dividends: $6,540 (reported on 22.5% of returns)
Here:
$6,540
State:
$3,145
(% of AGI for various income ranges: 1.2% for AGIs $10k-25k, 1.1% for AGIs $25k-50k, 2.2% for AGIs $50k-75k, 1.7% for AGIs $75k-100k, 4.2% for AGIs over 100k)
Net capital gain/loss: +$43,155 (reported on 20.8% of returns)
Here:
+$43,155
State:
+$16,059
(% of AGI for various income ranges: 0.1% for AGIs $10k-25k, 1.3% for AGIs $25k-50k, 2.3% for AGIs $50k-75k, 3.5% for AGIs $75k-100k, 34.7% for AGIs over 100k)
Profit/loss from business: +$13,934 (reported on 29.3% of returns)
Here:
+$13,934
State:
+$13,847
(% of AGI for various income ranges: 14.1% for AGIs $10k-25k, 7.1% for AGIs $25k-50k, 9.6% for AGIs $50k-75k, 7.8% for AGIs $75k-100k, 7.4% for AGIs over 100k)
IRA payment deduction: $2,983 (reported on 3.7% of returns)
96754:
$2,983
Hawaii:
$2,867
Self-employed pension: $11,300 (reported on 1.2% of returns)
Here:
$11,300
Hawaii:
$15,523
Total itemized deductions: $23,843 (28% of AGI, reported on 35.7% of returns)
Here:
$23,843
State:
$20,647
Here:
27.5% of AGI
State:
23.5% of AGI
(% of AGI for various income ranges: 18.7% for AGIs $10k-25k, 19.2% for AGIs $25k-50k, 23.3% for AGIs $50k-75k, 22.8% for AGIs $75k-100k, 12.9% for AGIs over 100k)
Charity contributions deductions: $2,937 (3% of AGI, reported on 31.7% of returns)
Here:
$2,937
State:
$2,966
Here:
3.3% of AGI
State:
3.3% of AGI
(% of AGI for various income ranges: 1.3% for AGIs $10k-25k, 1.9% for AGIs $25k-50k, 2.8% for AGIs $50k-75k, 3.1% for AGIs $75k-100k, 1.5% for AGIs over 100k)
Total tax: $8,131 (reported on 73.6% of returns)
96754:
$8,131
State:
$7,224
(% of AGI for various income ranges: 5.9% for AGIs $10k-25k, 6.9% for AGIs $25k-50k, 8.6% for AGIs $50k-75k, 10.0% for AGIs $75k-100k, 16.4% for AGIs over 100k)
Earned income credit: $1,388 (reported on 16.1% of returns)
Here:
$1,388
State:
$1,536
Percentage of individuals using paid preparers for their 2004 taxes: 69.2%
Here:
69%
State:
58%
(% for various income ranges: 63.2% for AGIs below $10k, 68.1% for AGIs $10k-25k, 69.0% for AGIs $25k-50k, 73.0% for AGIs $50k-75k, 75.3% for AGIs $75k-100k, 84.6% for AGIs over 100k)
Likely homosexual households (counted as self-reported same-sex unmarried-partner households)
Lesbian couples: 0.5% of all households
Gay men: 0.0% of all households
Household received Food Stamps/SNAP in the past 12 months: 31 Household did not receive Food Stamps/SNAP in the past 12 months: 1,309
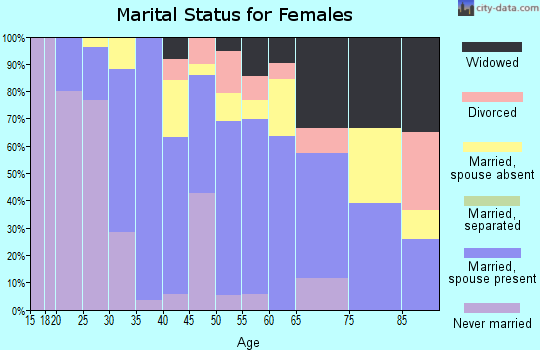
Women who had a birth in the past 12 months: 50 (36 now married, 13 unmarried) Women who did not have a birth in the past 12 months: 727 (160 now married, 574 unmarried)
Housing units in zip code 96754 with a mortgage: 594 (97 second mortgage, 67 both second mortgage and home equity loan) Median monthly owner costs for units with a mortgage: $2,702 Median monthly owner costs for units without a mortgage: $753
Residents with income below the poverty level in 2022:
This zip code:
16.0%
Whole state:
10.2%
Residents with income below 50% of the poverty level in 2022:
This zip code:
2.3%
Whole state:
4.7%
Median number of rooms in houses and condos:
Here:
5.6
State:
5.5
Median number of rooms in apartments:
Here:
4.2
State:
3.9
Notable locations in this zip code not listed on our city pages
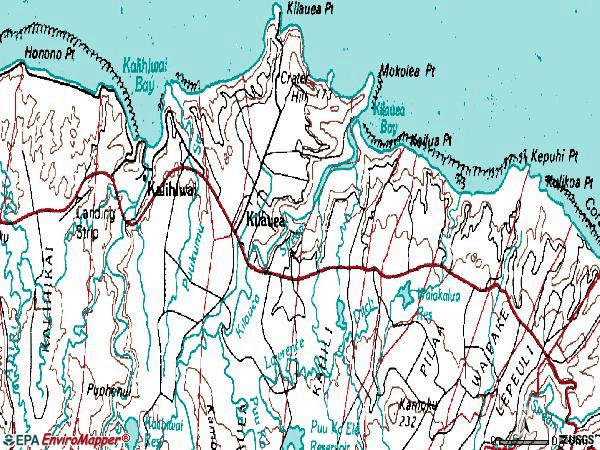
Reservoirs: Kalihiwai Reservoir (A), Puu Ka Ele Reservoir (B), Morita Reservoir (C), Waiakalua Reservoir (D), Ka Loko Reservoir (E). Display/hide their locations on the map
Streams, rivers, and creeks: Puu Ka Ele Stream (A), Puukumu Stream (B), Pohakuhonu Stream (C), Papaa Stream (D), Kaumoku Stream (E), Wailapa Stream (F), Kulihaili Stream (G), Waipake Stream (H), Kilauea Stream (I). Display/hide their locations on the map
521 married couples with children.
174 single-parent households (23 men, 151 women).
86.2% of residents of 96754 zip code speak English at home.
2.2% of residents speak Spanish at home (96% very well, 4% not well).
1.6% of residents speak other Indo-European language at home (100% very well).
10.1% of residents speak Asian or Pacific Island language at home (61% very well, 23% well, 17% not well).
1.1% of residents speak other language at home (48% very well, 52% well).
Foreign born population: 535 (12.3%) (45.3% of them are naturalized citizens)
This zip code:
12.3%
Whole state:
17.1%
70%Malaysia
8%Thailand
4%Iraq
3%Belgium
3%Honduras
3%Fiji
2%South Africa
13%American
6%European
4%English
4%German
4%Irish
2%Italian
2%Bulgarian
Year of entry for the foreign-born population
1102010 or later
2142000 to 2009
601990 to 1999
274Before 1990
Facilities with environmental interests located in this zip code:
KILAUEA ELEMENTARY SCHOOL (2440 KOLO ROAD in KILAUEA, HI)
(Geographic Names Information System) (National Center for Education Statistics) - STATE ID-7-459 Organizations: HAWAII DEPT OF EDUCATION (SCHOOL DISTRICT)
HULEIA NATIONAL WILDLIFE REFUGE (LIGHTHOUSE RD & STATE HWY 56 in KILAUEA, HI)
STATE MASTER (HEER-FRS) STATE MASTER (Hawaii environmental compliance and hazardous materials tracking) UNDERGROUND STORAGE TANK PROGRAM (Hawaii Underground Storage Tank Program) (Resource Conservation and Recovery Act (tracking hazardous waste)) Organizations: USDOI FW (CONTACT/OWNER)
Alternative names: KILAUEA POINT NATIONAL WILDLIFE REFUGE, KILAUEA POINT NWR, us fish & wildlife service KILAUEA POINT NATIONAL WILDLIFE REFUGE
National Pollutant Discharge Elimination System NON-MAJOR (Tracking pollutant discharge elimination systems) - permit Business SIC classification: NONCLASSIFIABLE ESTABLISHMENTS Alternative names: HAWAII REGIONAL HSG PRIVATIZ
KALOKO RESERVOIR (KALOKO RESERVOIR in KILAUEA, HI)
National Pollutant Discharge Elimination System NON-MAJOR (Tracking pollutant discharge elimination systems) - permit Business SIC classification: GENERAL CONTRACTORS-RESIDENTIAL BUILDINGS, OTHER THAN SINGLE-FAMILY
KILAUEA KINGDOM HALL SUBDIVISION (KILAUEA KINGDOM HALL in KILAUEA, HI)
National Pollutant Discharge Elimination System NON-MAJOR (Tracking pollutant discharge elimination systems) - permit
National Pollutant Discharge Elimination System NON-MAJOR (Tracking pollutant discharge elimination systems) - permit
PILA'A (PILA'A in KILAUEA, HI)
National Pollutant Discharge Elimination System NON-MAJOR (Tracking pollutant discharge elimination systems) - permit Business SIC classification: GENERAL CONTRACTORS-RESIDENTIAL BUILDINGS, OTHER THAN SINGLE-FAMILY
KILAUEA LIGHTHOUSE (3500 KILAUEA ROAD in KILAUEA, HI)
ENFORCEMENT/COMPLIANCE ACTIVITY (Integrated Compliance Information System)
KONG LUNG CENTER (P.O. BOX 36, KILAUEA AVE. in KILAUEA, HI)
ENFORCEMENT/COMPLIANCE ACTIVITY (Integrated Compliance Information System)
NAKAMALEI CRATER HILL SCHOOL (4480 HOOKUI RD in KILAUEA, HI)
COMPLIANCE ACTIVITY (Tracking inspections of insecticide, fungicide, and rodenticide, and toxic substances)
Housing units lacking complete plumbing facilities: 1.4% Housing units lacking complete kitchen facilities: 1.9%
50.8%No fuel used
34.6%Electricity
7.7%Bottled, tank, or LP gas
6.1%Utility gas
0.9%Solar energy
Place of birth for U.S.-born residents:
This state: 1,584
Northeast: 314
Midwest: 345
South: 552
West: 943
56% of the 96754 zip code residents lived in the same house 5 years ago. Out of people who lived in different houses, 66% lived in this county. Out of people who lived in different counties, 50% lived in Hawaii.
88% of the 96754 zip code residents lived in the same house 1 year ago. Out of people who lived in different houses, 35% moved from this county. Out of people who lived in different houses, 37% moved from different county within same state. Out of people who lived in different houses, 32% moved from different state.
Private vs. public school enrollment:
Students in private schools in grades 1 to 8 (elementary and middle school): 172
Here:
36.7%
Hawaii:
21.6%
Students in private schools in grades 9 to 12 (high school): 49
Here:
34.7%
Hawaii:
21.5%
Students in private undergraduate colleges: 2
Here:
3.7%
Hawaii:
23.3%
Occupation by median earnings in the past 12 months ($)
266,046Legal occupations
101,784Fire fighting and prevention, and other protective service workers including supervisors
80,514Transportation occupations
71,873Architecture and engineering occupations
69,601Management occupations
68,094Business and financial operations occupations
Top industries in this zip code by the number of employees in 2005:
Administrative and Support and Waste Management and Remediation Services: Professional Employer Organizations (100-249 employees: 1 establishment)
Administrative and Support and Waste Management and Remediation Services: Landscaping Services (20-49: 1, 5-9: 3, 1-4: 3)
Educational Services: Elementary and Secondary Schools (20-49: 1, 10-19: 1)
Real Estate and Rental and Leasing: Offices of Real Estate Agents and Brokers (10-19: 1, 1-4: 14)
Construction: Water and Sewer Line and Related Structures Construction (20-49: 1, 5-9: 1, 1-4: 1)
Construction: Site Preparation Contractors (10-19: 2, 5-9: 1, 1-4: 2)
Accommodation and Food Services: Limited-Service Restaurants (20-49: 1, 5-9: 1)
Construction: New Single-Family Housing Construction (except Operative Builders) (5-9: 3, 1-4: 7)
People in group quarters in 2010:
35 people in other noninstitutional facilities
2 people in group homes intended for adults
Fatal accident statistics in 2014:
Fatal accident count: 2
Vehicles involved in fatal accidents: 5
Fatal accidents caused by drunken drivers: 1
Fatalities: 3
Persons involved in fatal accidents: 12
Pedestrians involved in fatal accidents: 0
Fatal accident statistics in 2011:
Fatal accident count: 1
Vehicles involved in fatal accidents: 1
Fatal accidents caused by drunken drivers: 1
Fatalities: 1
Persons involved in fatal accidents: 2
Pedestrians involved in fatal accidents: 0
2003 - 2018 National Fire Incident Reporting System (NFIRS) incidents
Based on the data from the years 2003 - 2018 the average number of fire incidents per year is 12. The highest number of reported fire incidents - 20 took place in 2010, and the least - 6 in 2007. The data has a declining trend.
When looking into fire subcategories, the most reports belonged to: Outside Fires (59.3%), and Structure Fires (23.3%).
Fire incident types reported to NFIRS in Zip Code 96754
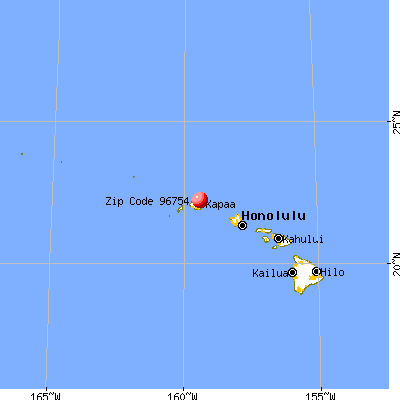


 Nearest zip codes: 96703, 96722, 96746, 96714, 96751, 96766.


 Based on the data from the years 2003 - 2018 the average number of fire incidents per year is 12. The highest number of reported fire incidents - 20 took place in 2010, and the least - 6 in 2007. The data has a declining trend.
 When looking into fire subcategories, the most reports belonged to: Outside Fires (59.3%), and Structure Fires (23.3%).